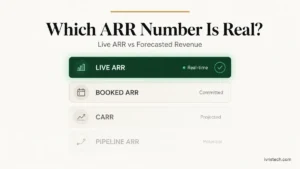
SaaS churn is the metric that decides whether your growth compounds or cancels itself out. Add 10% new ARR each month while churning 8%, and you’re running a treadmill. Add 10% while churning 2%, and you’re compounding at ~9% monthly. Same sales effort, completely different business. The math only holds if you’re consistent about whether the new ARR you’re adding is live or only booked — counting signed-but-not-yet-active contracts as “new ARR” inflates the numerator and quietly turns a treadmill into a chart that looks like compounding.
The benchmarks everyone cites (“good churn is under 5%”) miss the nuance. A 5% monthly churn rate would destroy an enterprise SaaS. A 5% annual churn rate in SMB-focused SaaS is best-in-class. This guide breaks down what counts as healthy churn in 2026 by segment, how to calculate it correctly (including the compounding trap most founders fall into), and what actually moves the number.
Key Takeaways
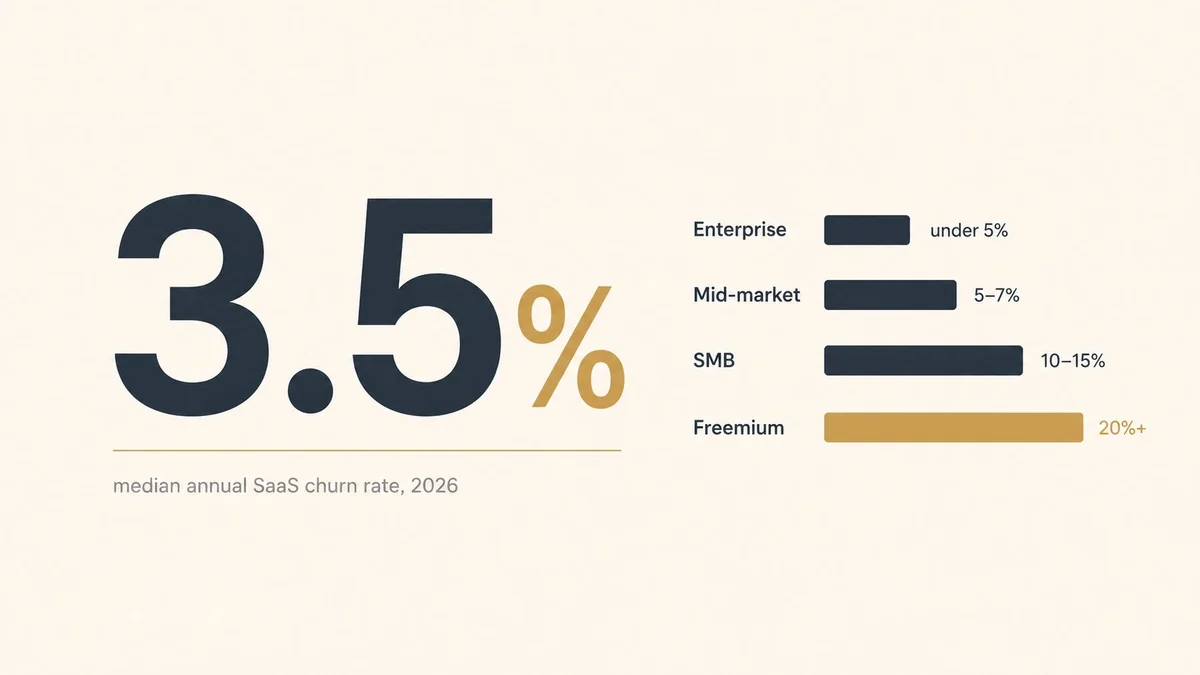
- SaaS churn rate is the percentage of customers or revenue lost over a specific period. The median B2B SaaS annual churn rate is 3.5%, but the number varies 38x across industries and segments.
- Benchmarks by segment: Enterprise SaaS under 5% annually, mid-market 5-7%, SMB-focused 10-15%, EdTech and Healthcare often 20%+.
- Calculate customer churn as (customers lost ÷ customers at start of period) × 100. Never multiply monthly by 12 — churn compounds. Use (1 − (1 − monthly rate)^12) for the correct annual figure.
- Involuntary churn (failed payments, expired cards) now accounts for up to 40% of total churn in many B2B SaaS businesses, and it’s largely preventable with better dunning.
- Net Revenue Retention (NRR) matters more than gross churn for mature SaaS. Median B2B SaaS NRR is ~101% per Benchmarkit’s 2025 SaaS Benchmarks Report (2024 data); best-in-class exceeds 120%.
- Reducing churn is some of the highest-impact work in SaaS: a 5% improvement in retention drives 25%+ increase in profits over time. It’s almost always cheaper than acquiring new customers to replace them.
What Is SaaS Churn Rate?
SaaS churn rate measures the percentage of customers or recurring revenue a subscription software business loses over a specific period. It’s calculated at either the customer level (logo churn) or the revenue level (MRR or ARR churn), and tracked monthly, quarterly, or annually depending on the sales cycle length. The model you charge with shapes the churn you should expect — our SaaS pricing strategies guide covers which structures pair cleanly with the benchmarks in this piece.
Churn is the single most important health metric for any recurring-revenue business because it compounds against growth. A company adding 10% new customers monthly while churning 8% monthly is barely moving. The math only works when acquisition dramatically outpaces churn.
Customer Churn vs Revenue Churn
The two figures often diverge, which is why good SaaS finance teams track both:
- Customer churn (logo churn): the count of accounts that cancelled. Equal weighting: a $100/month customer and a $100,000/year customer both count as “one customer lost.”
- Revenue churn (MRR or ARR churn): the dollar value lost. A single enterprise cancellation can swing revenue churn dramatically while barely moving customer churn.
In tiered pricing models, revenue churn is usually higher than customer churn because high-paying customers tend to be in the segments most aggressively evaluating alternatives. In PLG and SMB-focused businesses, customer churn is usually higher because small customers churn more often but each loss is small in dollar terms.
Voluntary vs Involuntary Churn
The cause matters more than the rate when you’re trying to reduce it:
- Voluntary churn: the customer actively cancels. Signals product value, pricing, or customer success problems.
- Involuntary churn: payment fails. Expired card, insufficient funds, billing system error. The customer didn’t choose to leave; they got kicked out.
Involuntary churn is the most underrated retention opportunity. According to Recurly’s 2025 analysis of 1,200+ subscription companies, median B2B SaaS monthly churn is 3.5%, split into 2.6% voluntary and 0.8-0.9% involuntary. But in many businesses, up to 40% of total churn comes from payment failures that proper dunning can prevent.
SaaS Churn Rate Benchmarks for 2026
Most churn benchmark articles give one number with no context. A 5% monthly rate is catastrophic for enterprise SaaS and normal for SMB-focused SaaS. The only useful benchmark is one segmented by customer size, industry, and stage.

Benchmarks by Customer Segment
- Enterprise SaaS (50,000+ employees): under 5% annual churn, with best-in-class under 3%. Customers sign multi-year contracts and integrate the product deeply. Above 7% annually signals product or customer success problems.
- Mid-market SaaS (50–500 employees): 5–7% annual churn. Customers evaluate before buying and switching is costly, but churn is more sensitive to product-market fit than enterprise.
- SMB-focused SaaS (under 50 employees): 10–15% annual churn is normal. Small businesses fail at higher rates, and switching cost is lower. The Reddit thread “our churn is 15%, we’re profitable and growing” is a real scenario for SMB SaaS; it’s context-dependent, not automatically broken.
- Freemium and usage-based SaaS: 20%+ annual churn is common, largely driven by free users who sign up to try and never activate. The more meaningful metric here is paying customer churn, not overall user churn.
Benchmarks by Industry Vertical
Industry matters almost as much as customer segment. MRRSaver’s 2026 benchmark data shows monthly churn ranging from 1.8% in infrastructure SaaS (embedded in workflows, high switching cost) to 9.6% in EdTech (budgets cut, semesters end, teachers change schools).
- Infrastructure and developer tools: 1.8% monthly (lowest, embedded in workflows)
- HR and back-office SaaS: 4.8% monthly (sticky once integrated)
- Marketing and sales tools: 4.8–8.1% monthly (intense competition, easy to switch)
- Healthcare SaaS: 7.5% monthly (revenue churn spiked 67% from 2024 to 2025)
- EdTech: 9.6% monthly (highest, doubled from 2024 levels)
Benchmarks by ARR Stage
Churn usually improves with scale as customer success, onboarding, and product maturity compound. Early-stage companies face structurally higher churn because product-market fit is still being refined:
- Under $1M ARR: 5–7% monthly churn common. Product-market fit still unproven.
- $1–10M ARR: 98% median NRR. CS processes stabilizing but not yet mature.
- $10–50M ARR: churn drops meaningfully as CS scales.
- $50M+ ARR: 115% median NRR. About 40% of SaaS in the $15–30M range achieve negative churn through expansion revenue.
PRO TIP
Benchmark against companies selling to the same customer segment with the same go-to-market motion, not against “SaaS average.” An enterprise sales team comparing itself to the 3.5% median is missing context; a SMB-focused business comparing itself to Snowflake’s 3% is setting an impossible target.
How to Calculate SaaS Churn Rate
The basic formula is straightforward, but the compounding trap catches many founders. There are four calculations that matter for SaaS churn. Each measures something different, and each has a specific use case.
Customer Churn Rate (Monthly)
Customer Churn Rate = (Customers Lost During Period ÷ Customers at Start of Period) × 100Example: you had 600 customers on May 1. By May 31, 30 had cancelled. Monthly customer churn = 30 ÷ 600 × 100 = 5%. Run that same 30 ÷ 600 in a database and the integer-division trap turns it into 0, which is why getting a churn rate in SQL always forces a decimal before it divides.
Revenue Churn Rate (MRR or ARR)
MRR Churn = (MRR Lost − Expansion MRR) ÷ MRR at Start of Period × 100Subtract expansion revenue (upsells, upgrades) from churned MRR to get net MRR churn. If you don’t subtract it, you’re measuring gross MRR churn, which is useful for understanding product retention but misleading for overall business health.
Annual Churn From Monthly (The Compounding Trap)
Here’s where most founders mess up. Seeing 5% monthly churn, they assume 5% × 12 = 60% annual churn. Wrong. Churn compounds each month against a shrinking base, so the actual math is this:
Annual Churn Rate = 1 − (1 − Monthly Churn Rate)^12At 5% monthly churn, annual churn is 46%, not 60%. At 10% monthly, annual churn is 72%. Getting this wrong leads to wildly inaccurate LTV projections and forecasts. The same compounding error hits CAC: CAC calculated without salary load and overhead allocation understates the cost side by 25 to 40 percent, which means an LTV:CAC ratio of 4:1 might actually be closer to 3:1 once both sides of the math are honest.
Net Revenue Retention (NRR)
NRR = (Starting MRR + Expansion − Churn − Downgrades) ÷ Starting MRR × 100NRR above 100% means your existing customer base generates more revenue over time, even without acquiring new customers. This is “negative churn.” Benchmarkit’s 2025 SaaS Benchmarks Report puts median B2B SaaS NRR at 101% (2024 data, N≈1,000 SaaS companies), with top performers above 120% and best-in-class above 130%. NRR above 130% is the single strongest correlate with premium SaaS valuation multiples (15-20× forward revenue vs 3-5× for NRR under 100%). For the wider acquisition-side measurement set NRR sits inside, our guide to broader SaaS metrics covers the 15 KPIs that pair with churn for a complete dashboard.
Churn belongs in the same dashboard as B2B marketing metrics, because retention changes how much acquisition spend a business can afford.
IMPORTANT
Always clarify whether you’re measuring customer churn or revenue churn when comparing to any benchmark. The two metrics frequently diverge, especially in tiered pricing models. “Our churn is 5%” is an incomplete sentence. “Our monthly revenue churn is 5% net of expansion” is actionable.
What Drives SaaS Churn
Every churn number is an aggregate of five or six distinct root causes. Reducing churn means identifying which cause dominates in your business and treating that one first. The five drivers below account for the majority of SaaS cancellations.

1. Poor Onboarding
Between 15% and 25% of annual churn happens in the first 90 days, typically because customers never reach “first value.” They signed up, got lost, never got the outcome they were promised. Fix: aggressive time-to-first-value reduction, proactive outreach at the 7/30/60-day marks, and a clear “activation” definition that customer success monitors daily.
2. Weak Product Value Over Time
Customers who activated but aren’t using the product month-over-month will churn at renewal. Product usage declines by an average of 41% in the quarter preceding cancellation, which is the 90-day warning window every customer success team should be watching. Fix: health scoring based on usage signals, not just on tickets logged.
3. Payment Failures (Involuntary Churn)
As noted above, up to 40% of churn in many businesses comes from failed payments. Expired cards are the largest single category. Fix: smart retries, pre-dunning communications, automated card updater services, and dedicated involuntary churn workflows. This is almost always the fastest churn-reduction project because the customers actually wanted to stay.
4. Missing or Reactive Customer Success
CS that only responds to escalations loses accounts silently. 60–70% of annual churn happens within 60 days of renewal, meaning the team finds out about the problem when it’s too late to fix it. Fix: proactive health reviews 90 days before renewal, executive business reviews for top accounts, and QBRs with clear success metrics defined in the first customer conversation.
5. Pricing Model Mismatch
A pricing model aligned with customer value creates natural expansion; one that doesn’t creates permanent frustration. Monthly billing churns 2-3x more than annual. Flat-rate pricing leaves expansion revenue on the table. Fix: move to annual contracts with discounts (15-20% off monthly rates), and align pricing with a usage metric that naturally grows as the customer does.
How to Reduce SaaS Churn Rate
The highest-ROI churn reduction work is rarely glamorous. It’s dunning workflows, onboarding checklists, and health scoring. The strategies below cover the full stack from immediate wins to structural changes.
Immediate Wins (30-60 days)
- Fix dunning: Implement smart payment retries, pre-dunning communications, and automated card updater services. Recovery rates of 70-80% are achievable, and the work pays for itself within a quarter.
- Shorten time-to-first-value: Audit where new signups drop off in the first session and fix the single biggest friction point. Time-to-value is the single strongest predictor of 90-day retention.
- Exit surveys at cancellation: Make exit feedback a forced step in the cancellation flow. Patterns emerge quickly — usually one or two problems drive the majority of voluntary churn.
Mid-Term Work (90-180 days)
- Build a customer health score: Combine usage frequency, feature depth, support ticket volume, and NPS into a single score. Trigger CS outreach when scores drop.
- Proactive 90-day pre-renewal reviews: Every enterprise and mid-market account gets a structured review 90 days before renewal. This catches trouble early enough to fix.
- Shift monthly billing to annual: Annual subscribers churn at roughly one-third the rate of monthly subscribers. A 15-20% annual discount pays for itself many times over in retained revenue.
Structural Changes (6+ months)
- Pricing model redesign: Move toward pricing that scales with customer value: usage-based, per-seat, or tiered. Customers whose spend grows as their usage grows churn dramatically less.
- ICP refinement: Analyze your highest-churn cohort and identify what they have in common. Often it’s a single firmographic or behavioral signal. Stop selling to that profile.
- Product-led expansion: Build expansion paths into the product itself: feature gates, seat additions, upgrade prompts. The best SaaS businesses have NRR above 120% because expansion outpaces churn.
SaaS Churn Rate Tools
The right toolset depends on ARR and complexity. Early-stage companies can run churn management with Stripe native tools and a spreadsheet. Once ARR exceeds $1M, dedicated tools start paying for themselves quickly.
Churn lives inside a bigger measurement system — acquisition velocity, expansion revenue, payback period — and the operators who keep churn under 1% monthly are usually the ones who instrument all four together, not the ones who optimize churn in isolation. The single-metric chase is what produces the customer-success theater that doesn’t move the number.
Frequently Asked Questions
A good annual churn rate depends on segment: under 5% for enterprise SaaS, 5-7% for mid-market, and 10-15% for SMB-focused SaaS. For monthly churn, aim for under 1% if you sell to enterprise and under 2% if you sell to SMB. Median B2B SaaS monthly churn in 2026 is 3.5%, but this aggregate masks 38x variance across segments.
The 3-3-2-2-2 rule is a growth framework for maturing SaaS companies: triple ARR in year one, triple in year two, then double ARR in years three, four, and five. Developed by Neeraj Agrawal at Battery Ventures, it describes the trajectory of the most successful SaaS companies on the path from $1M to $100M ARR. Churn directly affects whether this trajectory is achievable.
Monthly customer churn = (customers lost during month ÷ customers at start of month) × 100. To convert to annual, use (1 − (1 − monthly rate)^12), not monthly × 12 — churn compounds against a shrinking base. For revenue churn, use (MRR lost ÷ starting MRR) × 100, and subtract expansion MRR to get net MRR churn.
Churn rate and retention rate measure the same thing from opposite sides. If monthly churn is 3%, monthly retention is 97%. The two metrics always sum to 100%. SaaS companies typically report churn for customer-level analysis and Net Revenue Retention (NRR) for revenue-level analysis, because NRR captures expansion revenue that a simple retention rate doesn’t.
Negative churn (or NRR above 100%) happens when expansion revenue from existing customers exceeds revenue lost to cancellations. Your existing book of business grows on its own, even without new sales. Median B2B SaaS NRR is ~101% per Benchmarkit’s 2025 SaaS Benchmarks Report (2024 data); best-in-class exceeds 130%. Usage-based pricing and per-seat billing models make negative churn structurally easier to achieve.
Next Steps
Start by measuring your current churn correctly. Calculate both customer and revenue churn monthly, broken down by voluntary vs involuntary. Segment by customer size and industry so the benchmarks are apples-to-apples. If you find involuntary churn above 20% of total churn, fix dunning first — it’s almost always the highest-ROI project.
Then pick one cohort to run a 90-day retention experiment on. Pre-renewal outreach for mid-market, onboarding redesign for SMB, exit surveys for all. Measure the cohort against a control group and expand what works. Most SaaS teams try to reduce churn across every segment at once and end up moving the needle on none.
The teams that beat their churn benchmarks share three habits: they segment churn by cohort and product tier before they trust the headline number, they instrument the leading indicators (login frequency, feature adoption, support ticket sentiment) before churn shows up in the lagging revenue data, and they fire fast on the segments they should never have sold to in the first place. Pick one of the three to invest in this quarter — not all three at once.