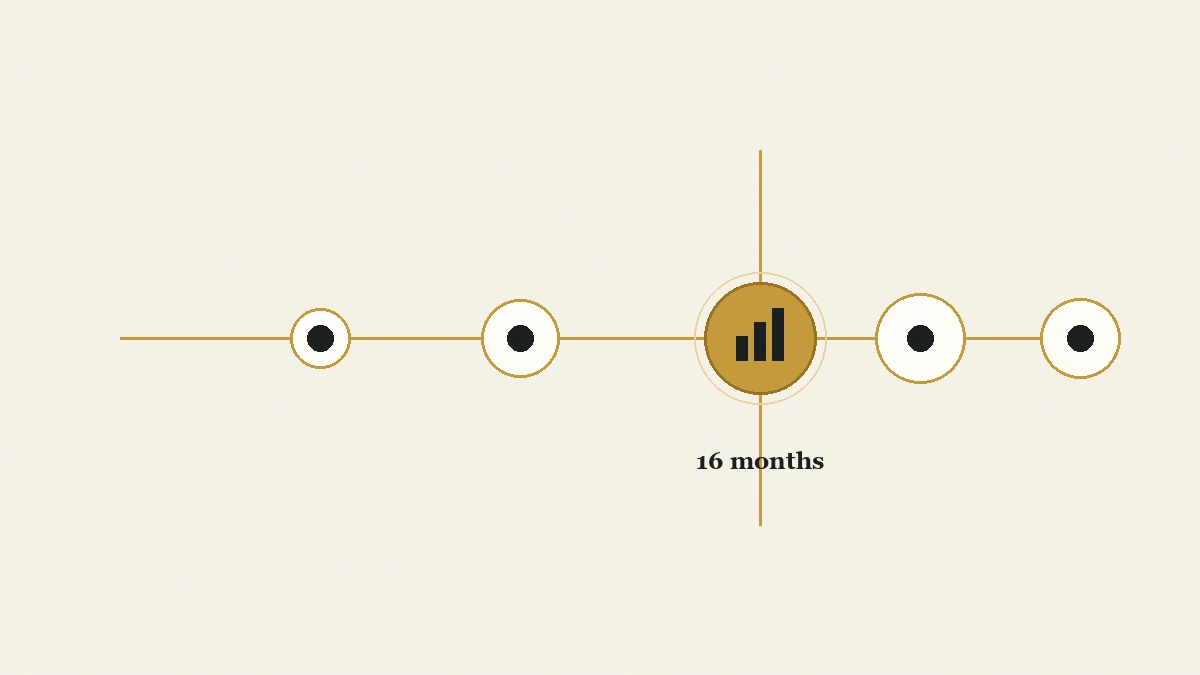
Published CAC payback period benchmarks disagree by a factor of five. Stripe says 12 months or less. Bessemer says 0 to 6 is best. Benchmarkit’s dataset puts the median at 16. One widely-shared figure claims bootstrapped companies recover their acquisition cost in 4.8 months.
Those numbers are not competing claims about the same thing. They describe different companies calculating a metric that has no single agreed formula. A company selling $800 subscriptions and a company selling $250,000 enterprise contracts should not share a payback target, and the same company can honestly report 22.5 months or 12 months depending on which inputs it puts in the denominator.
This page gives you the published CAC payback period benchmarks with the sample size attached to each one, then shows you which of them applies to your business.
Direct answer — What is a good CAC payback period benchmark?
The median B2B SaaS CAC payback period is 16 months, based on 198 companies reporting full-year 2025 actuals. Top-quartile companies recover acquisition cost in 6 months or less; bottom-quartile take 24 months or more. Segment matters more than the median: SMB businesses under $15K ACV run 8 to 12 months, mid-market 14 to 18, and enterprise above $100K ACV run 18 to 24 months.
Key Takeaways
- The 2026 Aleph and Benchmarkit report puts the median CAC payback at 16 months across 198 reporting companies, improved from 18 months in 2024.
- Annual contract value predicts payback better than any other attribute. SMB runs 8 to 12 months, mid-market 14 to 18, enterprise 18 to 24.
- Formula choice moves the same company from 22.5 months to 12 months. Including expansion ARR cuts 33%; dropping the gross-margin adjustment cuts another 20%.
- Net revenue retention sets the ceiling. Below 100% NRR, target under 12 months. Between 100% and 120%, 12 to 18 months is defensible.
- The widely-cited 4.8-month bootstrapped benchmark does not appear in the report it is attributed to. Check the source before you adopt a target.
Here is the short version of which benchmark to use, before the detail:
| If your business is | Typical payback | Source and sample |
|---|---|---|
| SMB or self-serve, under $15K ACV | 8–12 months | Optifai Sales Ops Benchmark, 939 companies |
| Mid-market, $15K–$100K ACV | 14–18 months | Optifai Sales Ops Benchmark, 939 companies |
| Enterprise, above $100K ACV | 18–24 months | Optifai Sales Ops Benchmark, 939 companies |
| Any B2B SaaS, all segments blended | 16 months median | Aleph × Benchmarkit 2026, 198 reporting |
| Growing faster than 50% a year | 10 months median | Aleph × Benchmarkit 2026, 198 reporting |
What the CAC Payback Period Measures
CAC payback period is the number of months a company needs to recover the cost of acquiring a customer from the gross profit that customer generates. It answers a cash question rather than a profit question: how long is your money tied up before a new customer pays it back?
The standard formula, as defined by the SaaS Metrics Standards Board, divides acquisition cost by the gross-margin-adjusted revenue from newly acquired customers.
CAC Payback (months) = CAC ÷ (New ARR ÷ 12 × Gross Margin %)Two details in that formula do most of the damage when people compare numbers. The first is the gross-margin adjustment, which converts revenue into the cash actually available to repay acquisition spend. The second is what counts as “new” revenue. Both are treated inconsistently across the published benchmarks, which is the subject of a later section.
Payback sits alongside LTV:CAC as the two capital-efficiency measures investors ask for, and it has quietly become the one they lead with. LTV:CAC depends on a lifetime estimate that nobody can verify for a four-year-old company. Payback depends on numbers already in the ledger.
The Published Medians and the Samples Behind Them
Every median below is real. They differ because they measure different populations, and a benchmark without its sample attached is not usable.
| Source | Median payback | Sample | Data year |
|---|---|---|---|
| Aleph × Benchmarkit 2026 | 16 months | 342 companies, 198 reporting payback | FY2025 actuals |
| Optifai Sales Ops Benchmark | 15 months | 939 B2B SaaS companies | Q2 2025–Q1 2026 |
| Benchmarkit 2025 report | 12–13 months | Not disclosed | FY2024 |
| Meritech SaaS Index | 10–50 month range | Public companies only | Rolling |
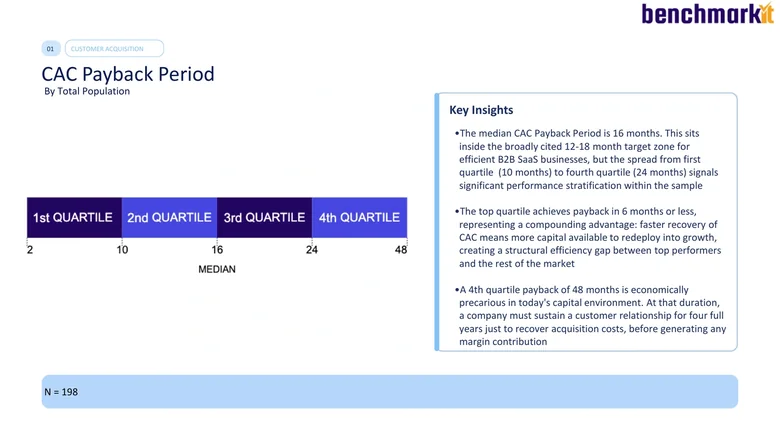
The 2026 Aleph and Benchmarkit benchmark report is the most useful of these because it discloses how many companies actually answered the payback question: 198 of 342 participants, reporting full-year 2025 actuals. Its median of 16 months came down from 18 months the year before, an 11% improvement and the largest single-year move in four years of the dataset.
The spread inside that sample is wider than the median suggests. Top-quartile companies recover acquisition cost in 6 months or less. Bottom-quartile companies take 24 months or more, and the slowest company in the sample took 48 months. A median of 16 describes almost nobody precisely.
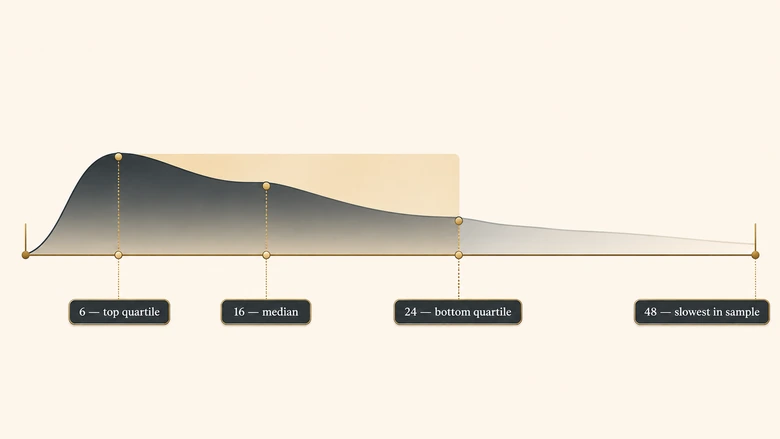
A median payback of 16 months with a quartile range of 6 to 24 is not one benchmark. It is three different businesses being averaged together.
This is the same reporting discipline we apply to retention benchmarks, where the headline 118% figure turns out to be a 90th-percentile number rather than a typical one. The pattern repeats across SaaS metrics: the number that circulates is rarely the number that describes the median company.
Benchmarks by Segment: What Contract Value Does to Payback
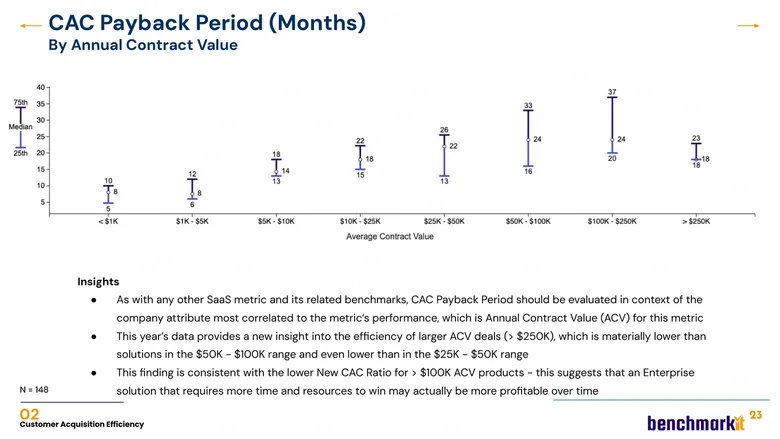
Annual contract value is the single attribute most correlated with payback period. Benchmarkit’s own analysis states the metric should be evaluated in the context of ACV rather than in isolation, and every dataset that segments this way finds the same gradient.
| Segment | ACV band | Payback benchmark |
|---|---|---|
| Self-serve / SMB | Under $15K | 8–12 months |
| Mid-market | $15K–$100K | 14–18 months |
| Enterprise | Above $100K | 18–24 months |
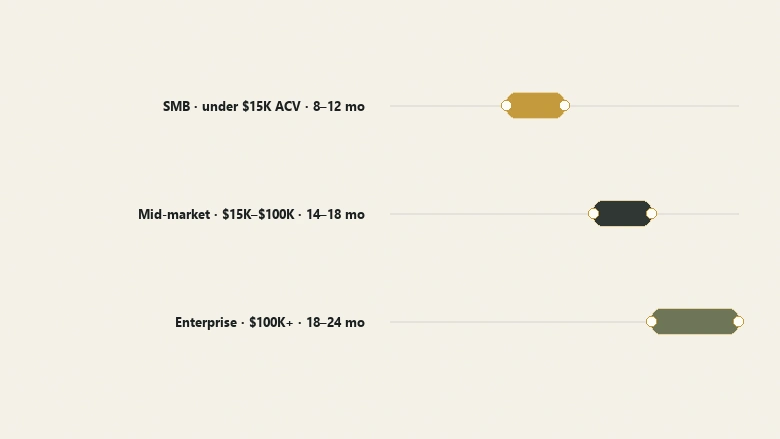
Those bands come from the Optifai Sales Ops Benchmark of 939 B2B SaaS companies collected between Q2 2025 and Q1 2026. They are self-reported vendor data rather than audited figures, which is worth knowing, but the sample is large and the gradient matches every other segmented dataset.
The mechanism is not complicated. Enterprise deals carry longer sales cycles, more people in the buying committee, solution engineers, security reviews, and procurement. All of that lands in acquisition cost before a single dollar of revenue arrives. Self-serve motions spend less per customer and collect sooner.
Ray Rike’s analysis pushes the same finding to the extremes: deals under $1,000 ACV typically show payback of 6 months or shorter, while deals above $100,000 often run past 24 months. The Aleph data agrees at the low end, putting sub-$5K ACV companies at 11 months and $50K to $100K companies at 22.
IMPORTANT
Applying an SMB benchmark to an enterprise motion is the most common misuse of this metric. A 20-month payback on $180K contracts with 95% retention is healthier than a 9-month payback on $400 contracts churning at 4% monthly.
There is a second axis worth knowing. The Aleph dataset finds horizontal SaaS at a 14-month median and vertical SaaS at 18, and it finds growth rate cuts across everything: companies growing faster than 50% a year post a 10-month median, roughly half the 22 months posted by companies growing 21% to 30%.
Benchmarks by Stage: What ARR Band Does to Payback
Payback lengthens as companies scale. This is expected rather than alarming, because companies move upmarket as they grow and inherit the enterprise cost structure described above.
| ARR band | Benchmarkit median | Bessemer portfolio (2021) |
|---|---|---|
| Under $1M | 11 months | Not reported |
| $1M–$5M | 16 months | 15 months ($1–10M) |
| $5M–$20M | 17 months | Not reported |
| $20M–$50M | 18 months | 21–24 months ($10–100M) |
| $50M–$100M | 22 months | Not reported |
| Above $100M | 25 months | 30 months |
Both series come from Christoph Janz’s analysis of CAC payback at Point Nine, which compiles the Benchmarkit and Bessemer datasets side by side. The Bessemer figures run consistently longer because they measure a venture portfolio at higher ACVs, not because either dataset is wrong.
Bessemer’s own 2023 guidance is stricter than its portfolio’s actual performance: 12 to 18 months is good, 6 to 12 is better, and 0 to 6 is best. That gap between prescribed target and observed median is worth noticing. Most published “good” thresholds are aspirations rather than descriptions.
Janz makes one adjustment most benchmark tables omit. Revenue payback ignores the sales cycle, but cash left the business before the contract was signed. Adding cycle length converts a 12.5-month revenue payback into roughly a 15-month cash payback on a 2.5-month cycle. If you are managing runway rather than reporting a metric, the cash version is the one that matters.
Why One Company Can Report 22.5 Months or 12 Months
This is where most benchmark comparisons quietly fall apart. The CAC payback period has no universally applied formula, and the variants are not rounding differences.
Ray Rike ran the same company’s numbers through four common calculations. The results:
| Calculation method | Result | Change vs standard |
|---|---|---|
| New logo ARR, gross-margin adjusted (standard) | 22.5 months | Not reported |
| New logo ARR, no gross-margin adjustment | 18 months | −20% |
| New + expansion ARR, gross-margin adjusted | 15 months | −33% |
| New + expansion ARR, no gross-margin adjustment | 12 months | −47% |
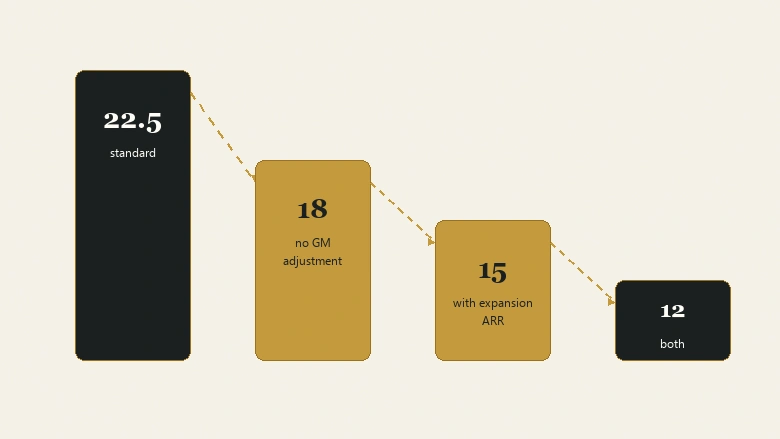
One business, one period, one set of underlying facts, and a range from 12 to 22.5 months. Rike’s full breakdown of the calculation variants is the clearest treatment of this problem published anywhere, and his conclusion is blunt: benchmark inconsistency makes cross-company comparison unreliable unless you know which method produced each number.
Including expansion ARR is the most consequential choice. It is defensible when you are measuring whether a customer cohort has repaid its acquisition cost, since expansion is real revenue from those customers. It is not defensible when you are measuring the efficiency of new-customer acquisition, because expansion revenue was not what the acquisition spend bought.
The numerator has the same problem. Payback is only as honest as the acquisition cost feeding it, and a number built on program spend alone will flatter you by several months against one that includes loaded salaries, commissions, and overhead. The fully-loaded CAC calculation determines whether your payback figure means anything at all.
PRO TIP
Report your payback period with its method attached, the way you would report a currency: “15 months, new plus expansion ARR, gross-margin adjusted.” Any board member who has seen two portfolio companies report incomparable numbers will thank you.
The Bootstrapped Benchmark That Does Not Trace Back
One figure circulates more than almost any other in this topic: bootstrapped SaaS companies recover acquisition cost in 4.8 months, against 10 to 12 months at Series A and 18 to 24 at Series C and beyond. It appears across benchmark round-ups, usually attributed to Benchmarkit’s 2025 SaaS Benchmarks report.
We went to check it. Benchmarkit’s 2025 report segments CAC payback period by annual contract value and states plainly that ACV is the attribute most correlated with the metric. It does not publish a funding-stage split. There is no bootstrapped figure in it. The 2026 Aleph and Benchmarkit dataset does not contain one either, and the pages repeating the 4.8-month number cite each other rather than a report that carries it.
We are not saying bootstrapped companies have slow payback. The logic for faster payback is sound: without external capital, a bootstrapped business funds growth from recycled acquisition cost and cannot afford a 24-month cycle. That reasoning is correct. What is missing is a published dataset behind the specific number, and 4.8 months is precise enough to sound measured rather than reasoned.
Treat it as an unsourced figure until someone publishes the sample. If you are bootstrapped, the honest benchmark available to you is the ACV band you sell into, adjusted down for the fact that your cost of capital is your own cash.
Picking the Benchmark That Applies to You
Three inputs decide your target: contract value, retention, and cost of capital. Work them in that order.
Start with your ACV band
Find your average contract value and take the matching band from the segment table above. That is your baseline, and it is a better starting point than any blended median. If you sell $9K contracts, your benchmark is 8 to 12 months and the 16-month median is irrelevant to you.
Adjust for net revenue retention
Retention changes what a long payback means. A customer who expands 20% a year repays acquisition cost on a curve that bends upward, so a longer initial payback carries less risk. Kyle Poyar’s rule of thumb, drawn from the 2025 SaaS Benchmarks Report covering 660 private SaaS companies, sets the target by retention band:
- Below 100% NRR: target payback under 12 months. Revenue shrinks after acquisition, so the recovery window has to be short.
- 100% to 120% NRR: 12 to 18 months is defensible. This is where most healthy B2B SaaS sits.
- Above 150% NRR: longer payback is survivable, depending on cash reserves. Expansion does the heavy lifting.
Poyar adds a caveat worth repeating: self-reported benchmark data skews lower than what he sees working directly with portfolio companies. Assume the published figures are slightly optimistic.
Adjust for cost of capital
A bootstrapped company at low cost of capital can carry a longer payback than the same business burning venture money at an implied 35% to 50% annual cost of equity. The metric is about cash timing, and cash has a price that differs by who supplied it.
Then fix the inputs, not the number
Payback improves through three levers, and only one of them is a marketing problem. Acquisition cost comes down through channel discipline and shorter cycles. Gross margin improves through infrastructure and support efficiency. Price is the fastest of the three, and the most neglected: the pricing model you choose sets the ARPU that sits in the payback denominator, which is why a pricing change moves payback faster than a campaign optimisation ever will.
Payback also belongs in context rather than on its own dashboard tile. Read it next to growth rate, retention, and magic number, the way a working SaaS metrics stack arranges the handful of numbers that actually drive decisions. A payback period improving while retention falls is not good news.
Workflow · 20 min
How to pick a CAC payback benchmark you can defend
Turns a published median into a target that fits your contract value, retention, and funding position.
Calculate your average contract value
Divide new ARR booked last year by new logos closed. Use the result to pick your band: under $15K, $15K to $100K, or above $100K.
Fix your formula and write it down
Decide whether expansion ARR counts and whether you adjust for gross margin. Record the choice next to the metric so future comparisons stay honest.
Rebuild CAC on fully-loaded costs
Include salaries, commissions, tooling, and overhead, not just program spend. A partial numerator understates payback by several months.
Shift the target by your NRR band
Below 100% NRR, tighten to under 12 months. Between 100% and 120%, accept 12 to 18. Above 150%, extend only if cash reserves support it.
Add your sales cycle for the cash view
Add average cycle length in months to the revenue payback figure. Report the cash number to anyone managing runway.
Frequently Asked Questions
A good CAC payback period depends on contract value. SMB and self-serve businesses under $15K ACV should target 8 to 12 months, mid-market 14 to 18, and enterprise above $100K ACV 18 to 24 months. The blended B2B SaaS median is 16 months, with top-quartile companies recovering acquisition cost in 6 months or less.
Divide customer acquisition cost by the monthly gross profit that customer generates: CAC ÷ (New ARR ÷ 12 × gross margin %). The result is the number of months needed to recover acquisition spend. Always state whether expansion ARR is included and whether you applied the gross-margin adjustment, because both change the answer materially.
Two reasons. Different datasets measure different populations, so an enterprise-weighted sample reports longer payback than an SMB one. And there is no single agreed formula: including expansion ARR cuts a company’s reported payback by 33%, and dropping the gross-margin adjustment cuts a further 20%.
Not necessarily. For enterprise businesses above $100K ACV, 18 to 24 months is the normal band. A 24-month payback with strong net revenue retention and multi-year contracts produces sound unit economics. The same figure on SMB contracts with monthly churn is a serious problem.
It depends on the question. To measure whether a customer cohort has repaid its acquisition cost, include expansion, since it is real revenue from those customers. To measure new-customer acquisition efficiency, exclude it, because acquisition spend did not buy the expansion. State which you used.