Knowing how to calculate SaaS CAC is the difference between unit economics that survive a finance review and unit economics that quietly fail one. The math looks fine, the dashboard shows a clean number, and the LTV:CAC ratio you present to the board lands somewhere flattering. Then a thorough audit reveals that 30 to 40 percent of acquisition costs were sitting outside the calculation: fractional CFO time, RevOps tooling, the account executive who closes a deal six months after the marketing spend, the agency retainer that produced no measurable lift. The CAC the company believed was $400 was closer to $600.
This guide walks through how to calculate SaaS CAC the way fund analysts and seasoned operators do: with fully-loaded costs, time-period matching that respects the sales cycle, and a clear split between new-customer acquisition and expansion. It also covers the 2026 benchmarks by ARR band, the CAC payback period that quietly became the unit-economic metric VCs care about more than LTV:CAC, and a reduce-CAC playbook built for how B2B buyers actually research and buy this year.
Key Takeaways
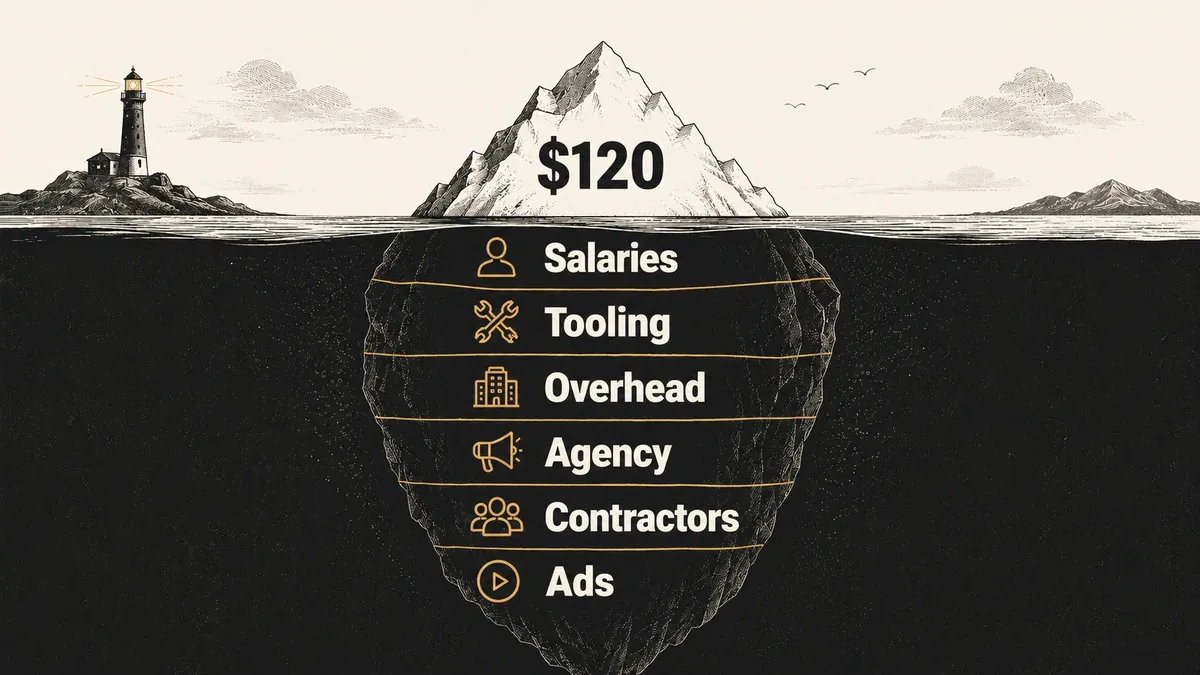
- Fully-loaded CAC includes ALL S&M costs: salaries, tools, contractor spend, and allocated overhead. The blended number most teams report typically underestimates by 25 to 40 percent.
- The 2026 B2B SaaS CAC range is $400 to $900 for most verticals. Fintech and security push above $1,200, and enterprise CAC scales roughly 10x from SMB (First Page Sage 2025 data, as of Q2 2026).
- Benchmarkit’s 2025 data shows the New Customer CAC Ratio at $2.00. The median B2B SaaS company spends $2 of S&M to bring in $1 of new ARR.
- A healthy LTV:CAC ratio sits between 3:1 (floor) and 5:1 (ceiling). Anything higher often signals under-investment in growth, not efficiency.
- The 2026 reduce-CAC playbook is structural. AI-search distribution, intent-data targeting, and product-led signals do more than channel optimization can.
The SaaS CAC Formula (and What Most Teams Leave Out)
SaaS Customer Acquisition Cost is total sales and marketing expense divided by the number of new customers acquired in the same period. The formula is simple. The accuracy problem isn’t the math — it’s what teams include and exclude on the numerator.
CAC = Total Sales & Marketing Spend ÷ New Customers AcquiredWhat to include in the CAC calculation
A fully-loaded CAC calculation captures every cost the business incurs to win a new customer. That means burdened salaries for sales reps, SDRs, marketers, and any RevOps headcount that supports the acquisition motion. It includes paid ad spend, content production, agency retainers, sales enablement tooling, the CRM seat, the analytics stack, the data enrichment platform, and any contractor invoice tied to demand generation. It also includes allocated overhead: the share of office, IT, and executive time that supports acquisition.
What most teams report is a partial number that excludes salary load, tooling, or overhead allocation. That’s where the 25-to-40-percent underestimate comes from. When you compare your CAC against industry benchmarks built on fully-loaded data, the comparison breaks. Your CAC sits inside a broader set of SaaS marketing metrics that only stay coherent when each one is measured on the same accounting basis.
For non-SaaS reporting, map CAC back into the broader B2B marketing metrics set so acquisition cost is not read alone.

Blended, new-customer, and expansion CAC
The fully-loaded formula also splits into three useful variants:
- Blended CAC divides total S&M by new customers from all sources, paid and organic. Useful as a headline metric, but it can hide channel-level inefficiency.
- New Customer CAC isolates net-new logo cost from expansion revenue (existing customers buying more). Benchmarkit’s 2025 SaaS Performance Metrics report tracks this as the New CAC Ratio: $2.00 of spend per $1 of new ARR in 2024, up from $1.76 in 2023.
- Expansion CAC measures the cost of growing existing accounts. Customer success teams, CSMs, and account-expansion programs sit here.
A worked example: suppose a mid-market B2B SaaS company spent $300,000 on fully-loaded S&M in Q1 2026 and added 100 net-new customers in the same quarter. Blended CAC is $3,000. If 25 of those 100 customers were existing accounts expanding to new product lines, the New Customer CAC is closer to $4,000 ($300K ÷ 75 net-new logos), and the Expansion CAC is the unallocated CSM cost divided by the 25 expansions. The blended number understates the true cost of winning a new logo by a third.
PRO TIP
Match the time period to your sales cycle. If your average B2B deal closes 4 months after first touch, dividing this month’s S&M by this month’s new customers makes CAC look great in low-spend months and terrible in high-spend ones. Use a 3- to 6-month rolling window, or build the calculation per cohort. Cohort-based CAC reveals the truth that monthly averages hide.
SaaS CAC Benchmarks by ARR Band (2026)
The headline B2B SaaS CAC range is $400 to $900, which covers most mid-market software companies. The dispersion around that range is where the interesting signal lives: ARR band, vertical, and channel mix each shift the number by multiples.
CAC by industry vertical
First Page Sage’s 2025 industry analysis, drawing from data on SaaS companies between January 2022 and August 2025, breaks CAC down by vertical:
- Fintech and insurance: $1,450 and $1,280 respectively. Compliance overhead and longer due diligence stretch the cost.
- Ecommerce and LegalTech SaaS: $274 and $299. Shorter decision cycles compress the spend.
- Consumer-focused SaaS: under $300. Ecommerce SaaS at $64 and retail at $76 sit at the floor.
- Fintech enterprise: $14,772. Regulatory complexity and enterprise sales cycles compound.

How CAC scales from SMB to enterprise
Across verticals, the SMB-to-enterprise CAC ratio runs roughly 10x. A SaaS company selling to SMBs at $400 will typically see enterprise CAC north of $4,000 for the same product line. That gap reflects the number of stakeholders in an enterprise deal, the procurement-cycle drag, and the higher sales-rep cost of a named-account motion.
CAC by acquisition channel
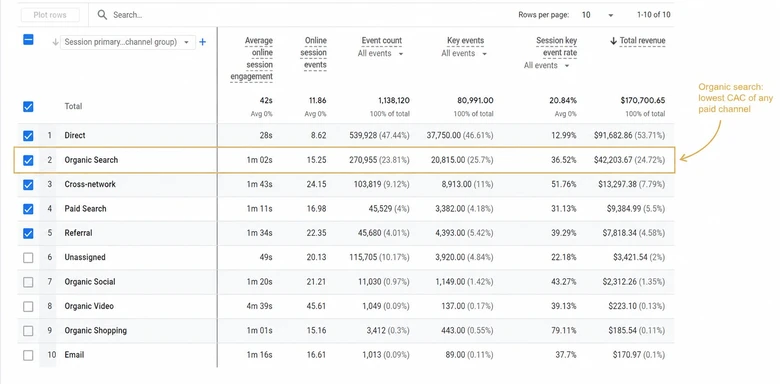
Channel mix is the other large factor. First Page Sage’s organic-channel CAC (SEO and content) lands between $480 and $942, while paid search delivers an average B2B SaaS cost-per-acquisition of $802. Organic CAC compounds: once content earns a position-1 ranking, it serves new customers at near-zero marginal cost. Paid CAC stays flat per dollar regardless of how long the channel has run. The pricing model you operate also pulls CAC up or down; flat-rate plans compress the funnel, while usage-based pricing extends the discovery-to-conversion window and pulls CAC with it.
IMPORTANT
The 2026 benchmarks reflect a pre-AI-Overview baseline. Google’s AI Overview has cut click-through from organic results on informational queries, and Generative Engine Optimization (GEO) competes for visibility in the same SERP as classic SEO. Companies relying on organic CAC should treat 2025 numbers as a ceiling, not a target. The organic discount is real but compressing.
CAC Payback Period: The Metric VCs Now Watch First
CAC Payback Period is the number of months a SaaS business needs to recover the cost of acquiring a customer through gross-margin revenue. It’s the metric most growth-stage investors lead with in 2026 because it answers “how fast does this business turn cash?” in a single number.
CAC Payback (months) = CAC ÷ (Monthly Recurring Revenue × Gross Margin %)A healthy CAC payback period sits between 2 and 9 months for B2B SaaS, with the most efficient companies clustered around 5 to 8 months. The 3-3-2-2-2 rule of SaaS, a growth framework that prescribes tripling ARR for two years and then doubling for three more from a $1M base, only holds together when CAC payback runs under 80 days for the SMB segment and under 12 months at enterprise. Anything longer and the company is funding its own growth on borrowed time.
A concrete example: if your fully-loaded CAC is $3,000 and a new customer pays $400 MRR at a 75 percent gross margin, payback equals $3,000 ÷ ($400 × 0.75) = 10 months. Tight, but workable. If gross margin drops to 65 percent on the same revenue, payback stretches to 11.5 months and the unit economics start to wobble.

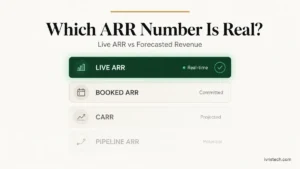
The payback period also stress-tests the basic CAC number. If your CAC looks fine but your payback period runs 18 months, the underlying problem is usually thin gross margin, high churn, or compressed ARPU. Tracking live ARR alongside CAC payback exposes the lag between when cash leaves the business and when the customer pays it back.
Enterprise companies often relax the 12-month rule because the contracts are longer and the retention is stronger. A 24-month CAC payback on a 7-year average customer lifespan still produces healthy unit economics. The trap is applying the SMB benchmark to an enterprise motion, or vice versa.
LTV:CAC: The Health Ratio Everyone Cites (and Often Misuses)
LTV:CAC divides Customer Lifetime Value by Customer Acquisition Cost. A 3:1 ratio means a customer’s lifetime gross profit covers acquisition cost three times over. OpenView Partners’ research established 3:1 as the healthy floor and 4:1 as the B2B SaaS target; the broader industry consensus pegs 1:1 as break-even and 2:1 as sustainable but tight.
The trap is treating “higher is always better.” When LTV:CAC runs above 5:1 consistently, the company is usually under-investing in acquisition: it could be deploying more capital into growth without breaking the unit economics. A 5:1 ratio that holds for 12 quarters is a signal to spend more, not a celebration of efficiency.
IMPORTANT
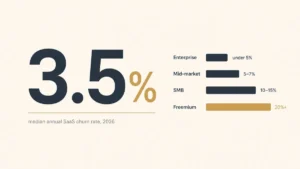
LTV:CAC math gets unreliable when churn is high or when expansion revenue isn’t separated from new acquisition. If your gross logo retention sits below 85 percent, LTV is being inflated by survivor bias and the ratio overstates economic health. Pair LTV:CAC with cohort retention and net revenue retention before drawing conclusions from the headline number.
How to Reduce SaaS CAC in 2026
Reducing SaaS CAC in 2026 hinges on structural channel shifts more than channel-level optimization. Paid acquisition has plateaued in efficiency while AI-mediated discovery (AI Overview, Perplexity, ChatGPT Search) is reshaping where B2B buyers research products. Five tactics are doing the heavy lifting now.
1. Generative Engine Optimization (GEO). Buyers increasingly start product research in AI-search interfaces that cite a small set of authoritative sources. Companies cited by name in AI Overviews drive zero-click brand awareness that converts at near-zero marginal CAC. First Page Sage’s 2026 GEO benchmarks report median GEO-driven CAC well below paid channels for the same vertical — track AI citations as a separate KPI from organic rankings.
2. Intent data and account scoring. Platforms like Bombora, 6sense, and ZoomInfo Intent surface accounts researching your category before they fill out a form. Routing paid ad budget and SDR effort to in-market accounts compresses the CAC of paid channels by 25 to 40 percent when implemented well, because the same dollar of spend reaches accounts already in the buying cycle.
3. Product-led signals. A free-trial-to-paid signal arrives months ahead of an inbound form-fill, and the prospect has already self-qualified by using the product. PLG-influenced opportunities convert at 2 to 3 times the rate of pure outbound, which collapses CAC at the conversion stage even when discovery costs the same.
4. Channel-mix shift away from email-dependent attribution. Apple Mail Privacy Protection broke open-rate as an intent signal, and email-based attribution has grown increasingly noisy. Shifting CAC measurement and channel investment toward click-and-reply signals (or first-party intent platforms) cleans the data the playbook depends on.
5. Brand search as the compounding denominator. Branded organic search traffic converts at 3 to 5 times non-branded traffic and has near-zero CAC at the search step. Sustained PR, podcasting, and category-defining content drive branded-search volume that lowers blended CAC without showing up as a line item in any channel report. AI agents inside the RevOps stack have started automating the connective tissue (lead scoring, account research, follow-up cadence) that used to consume SDR hours, freeing budget to redirect into the channels above.
The CAC compression that lasts comes from structural channel-mix shifts, not from negotiating better paid rates. Companies that try to fix CAC by optimizing existing channels usually plateau within a quarter; the durable wins come from upstream changes to where buyers first encounter the brand, not downstream tweaks to the same channels.
PRO TIP
Audit your CAC by channel each quarter and rank channels by trailing-12-month payback. Kill or shrink any channel whose payback runs 1.5x your blended rate, and reinvest in the top-2 channels by efficiency. Most companies hold dead-weight paid channels for sentimental reasons. The data usually says cut sooner.
Common SaaS CAC Calculation Mistakes
Three errors account for most of the gap between reported CAC and audited CAC:
- Excluding fully-loaded costs. Salary load, tooling, and overhead allocation get left out. The reported number flatters the team but doesn’t survive a finance review.
- Mismatching the time period to the sales cycle. Monthly snapshots distort CAC for any business with a sales cycle longer than 30 days. Use rolling windows or cohort math.
- Counting expansion revenue as new acquisition. When CSM-driven expansion gets folded into the new-customer numerator, the New Customer CAC Ratio looks better than it is. Benchmarkit’s data shows expansion now drives 40 to 50 percent of new ARR for many SaaS businesses, which means separating the two is no longer optional.
Frequently Asked Questions
SaaS Customer Acquisition Cost equals total sales and marketing expense divided by the number of new customers acquired in the same period. A fully-loaded calculation includes burdened salaries, tooling, contractor spend, and allocated overhead. Most underestimates come from excluding salary load and tooling costs from the numerator.
The healthy New Customer CAC Ratio sits at or below $1.50 of spend per $1 of new ARR. Benchmarkit’s 2025 data shows the median B2B SaaS company at $2.00, which is the realistic 2026 benchmark. Anything above $3.00 signals an inefficient acquisition motion that won’t survive a downturn.
The 3-3-2-2-2 rule says a SaaS company that hits $1M ARR should aim to triple ARR for two years (3x, 3x), then double for three years (2x, 2x, 2x). The framework only works with CAC payback under 80 days for SMB and under 12 months at enterprise, plus a 3:1 or better LTV:CAC and 110 percent or higher NRR.
CAC Payback Period equals CAC divided by Monthly Recurring Revenue times Gross Margin percentage. The result is the number of months needed to recover acquisition cost. A healthy B2B SaaS payback period sits between 2 and 9 months; under 12 months at enterprise is acceptable given longer contracts and stronger retention.
The healthy CLV:CAC ratio (also written LTV:CAC) sits between 3:1 and 5:1 for B2B SaaS. OpenView Partners’ research established 3:1 as the floor and 4:1 as the B2B target. Above 5:1, the company is typically under-investing in growth and could profitably deploy more acquisition capital.