

Three people pull the win rate on the same Monday. Sales Ops reports 34%. Marketing reports 19%. The board deck says 27%. Nobody is lying, nobody has made an arithmetic error, and all three numbers came out of the same CRM. They divided by different things. Most RevOps metrics fail exactly here, long before anyone questions the performance behind them.
This is the ordinary condition of most revenue teams, and it is measured. Highspot’s Go-to-Market Performance Gap Report 2026, a survey of 450 go-to-market leaders across six countries and five industries, found that 98% of leaders believe their execution is standardised while only 53% report highly consistent outcomes. Of the leaders explaining that inconsistency, 43% named inadequate measurement of how teams work as a primary cause.
So the problem is not that RevOps teams track too few metrics. It is that the same metric name means four things in four systems, and no single person is accountable for which meaning wins. This page is a register rather than a list: for every revenue metric that matters, the calculation, the denominator decision that actually moves the number, the role that owns the definition, and the system the number must come from.
Direct answer — What are RevOps metrics?
RevOps metrics are the revenue measures shared across sales, marketing, finance and customer success, covering pipeline health, unit economics, retention and forecasting. A RevOps metric is only usable when three things are fixed: the calculation, the denominator it divides by, and the single role accountable for that definition. Most disputes about a number are denominator disputes, not performance disputes. The system of record matters too, because a metric that needs history cannot be read from a CRM that only stores current state.
Key Takeaways
- A metric without a named owner is not a metric, it is a topic of debate. Assign one accountable role per definition, not per dashboard.
- The denominator moves most revenue numbers further than performance does. Win rate shifts from 21% to 47% on denominator choice alone.
- Retention and unit economics belong in the billing system, not the CRM. The CRM records intent to pay; billing records payment.
- Forecast accuracy cannot be calculated from a CRM, because it needs a snapshot of what you believed on a past date and the CRM overwrites that.
- Published benchmarks are portable only when the publisher discloses its denominator. Most do not.
What RevOps metrics are
RevOps metrics are the measures a revenue operations function uses to run pipeline, unit economics, retention and forecasting as one system rather than three departmental reports. They differ from departmental metrics in one respect: more than one team acts on them, so more than one team needs to accept the definition.
That acceptance is the part teams skip. A metric becomes operational when it carries four attributes, and a register is simply the place those attributes live:
- Calculation. The arithmetic, written down, with both numerator and denominator named.
- Denominator decision. The judgment call inside the calculation, made once and recorded.
- Owner. One role accountable for the definition, empowered to settle disputes about it.
- Source system. The system of record the number is read from, and nowhere else.
Miss any one and the metric degrades quietly. Miss the owner and it degrades fastest, because there is nobody with standing to say which version is correct.

Why the same metric returns three different numbers
Take win rate. IVRIS audited the published 2026 figures and found headline numbers running from 21% to 47%, all describing B2B sales, all defensible, all dividing by a different set. RAIN Group’s 47% counts only opportunities that reached a proposal. HubSpot’s 21% counts opportunities. Neither is wrong. They answer different questions, and the gap between them is larger than the gap between a good sales team and a poor one. The full provenance trail sits in our audit of B2B win rate benchmarks and their five competing denominators.
Pipeline coverage behaves the same way. The 3x target repeated across the category assumes a 33% win rate, which almost nobody has. At a 20% qualified win rate the same logic demands 5x, and slippage pushes it higher again. We traced where that convention came from and found no research underneath it, which is why the defensible coverage target is derived from your own closed-won history rather than imported.
Our own archive shows how this happens to a careful team. IVRIS published a RevOps operating guide in 2026 that lists a 3-4x coverage target and defines win rate as closed-won over total opportunities. Both entries predate the audits above, and both are now the weaker version of a number this site has since examined properly. That page is being refreshed. It is a fair illustration of the underlying point: definitions drift because nobody is accountable for keeping them current, and the drift is invisible until two versions meet in one meeting.
IMPORTANT
A benchmark is portable only if the publisher states its denominator. Weflow’s widely shared RevOps metrics cheat sheet does state one for win rate, counting only deals past a qualified stage. Most sources state none at all. Treat an undisclosed denominator as a missing number, not a conservative one.

The RevOps metric register
Every metric below is listed with the denominator decision that changes its value, one accountable role, and the system it should be read from. Where IVRIS has audited a metric in depth, the register names that page instead of restating its findings. Nothing here is a benchmark target; targets belong to the pages that traced them.
| Metric | Family | Calculation | Denominator decision | Owner | Source system | Where the depth lives |
|---|---|---|---|---|---|---|
| Pipeline coverage ratio | Pipeline health | Open qualified pipeline ÷ period quota | Quota for the closing period, not annual; qualified stage gate named | Sales Ops | BI or warehouse (needs snapshots) | Pipeline coverage ratio |
| Win rate | Pipeline health | Won ÷ opportunities that reached a decision | Whether no-decisions count, and which stage starts the clock | RevOps | CRM | B2B win rate benchmarks |
| Sales velocity | Pipeline health | (Opportunities × avg deal value × win rate) ÷ cycle days | All four inputs from one window, one segment | Sales Ops | CRM | Sales velocity formula |
| Sales cycle length | Pipeline health | Days from stage entry to close, cohort mean or median | Cohort must have fully closed; mean and median differ sharply | Sales Ops | CRM | Sales cycle length benchmarks |
| Stage conversion rate | Pipeline health | Opportunities advancing ÷ opportunities entering the stage | Per stage, never blended; skipped stages counted or excluded | Sales Ops | CRM | B2B lead conversion rate benchmarks |
| Average contract value | Pipeline health | Won contract value ÷ won deals | New business only, or including renewals and expansion | Finance | Billing system | SaaS marketing metrics |
| Customer acquisition cost | Unit economics | Total sales and marketing spend ÷ new customers | Fully loaded with headcount, or media spend only | Finance | Billing plus general ledger | B2B marketing metrics |
| CAC payback period | Unit economics | CAC ÷ monthly gross profit per customer | Gross profit, not revenue; margin assumption stated | Finance | Billing plus general ledger | B2B marketing metrics |
| LTV:CAC ratio | Unit economics | Customer lifetime value ÷ CAC | Whether LTV is margin-adjusted and how lifespan is capped | Finance | Billing system | B2B marketing metrics |
| Customer lifetime value | Unit economics | Avg revenue × avg lifespan × gross margin % | Observed lifespan or modelled from churn rate | Finance | Billing system | B2B marketing metrics |
| Cost per lead | Unit economics | Channel spend ÷ leads generated | Which lead stage counts, and whether headcount is included | Marketing Ops | Marketing automation | B2B cost per lead benchmarks |
| Marketing spend as % of revenue | Unit economics | Total marketing spend ÷ company revenue | Headcount in or out; revenue actual or projected | Finance | General ledger | B2B marketing budget benchmarks |
| Marketing-sourced pipeline | Unit economics | Pipeline value with marketing origin ÷ total pipeline created | Attribution model declared: first touch, last touch or multi-touch | Marketing Ops | CRM plus marketing automation | Content marketing metrics dashboard |
| Net revenue retention | Retention | (Start MRR + expansion − downgrade − churn) ÷ start MRR | Cohort window; new logos always excluded | Finance | Billing system | B2B marketing metrics |
| Gross revenue retention | Retention | (Start MRR − downgrade − churn) ÷ start MRR | Cannot exceed 100%; expansion never included | Finance | Billing system | SaaS marketing metrics |
| Customer churn rate | Retention | Customers lost ÷ customers at period start | Logo churn or revenue churn; these diverge badly upmarket | CS Ops | Billing system | SaaS churn rate |
| Expansion revenue | Retention | Upsell plus cross-sell MRR ÷ start MRR | Price increases counted as expansion or excluded | CS Ops | Billing system | SaaS marketing metrics |
| Forecast accuracy | Forecasting | 1 − (|forecast − actual| ÷ actual) | Snapshot date fixed in advance; per category or total only | RevOps | BI or warehouse (needs snapshots) | This page |
| SDR quota attainment | Forecasting | Output delivered ÷ quota assigned | Meetings held or meetings booked; ramping reps in or out | Sales Development lead | CRM plus sales engagement | SDR quota attainment |
| MQL to SQL conversion | Forecasting | SQLs accepted ÷ MQLs delivered | Written acceptance criteria, or the number measures nothing | Marketing Ops | Marketing automation plus CRM | MQL vs SQL |
| Lead-to-opportunity conversion | Forecasting | Opportunities created ÷ leads created | Same-cohort window, not same-month counts | Marketing Ops | CRM | B2B lead conversion rate benchmarks |
| CRM field completeness | Forecasting | Populated required fields ÷ required fields × records | Which fields are genuinely required, registered in advance | RevOps | CRM | CRM data quality benchmarks |
| Duplicate rate | Forecasting | Duplicate records ÷ total records | The match rule must be declared before the number means anything | RevOps | CRM | CRM data quality benchmarks |
| Account engagement rate | Forecasting | Engaged target accounts ÷ target account list | What counts as engaged, and who controls the target list | Marketing Ops | ABM platform plus CRM | ABM benchmarks |
| Deal slippage rate | Pipeline health | Deals slipped ÷ deals committed at period start | Whether a re-forecast deal is counted as slipped once or every period | Sales Ops | BI or warehouse (needs snapshots) | Pipeline coverage ratio |
| Magic Number | Unit economics | Net new ARR ÷ prior-quarter sales and marketing spend | Net new or gross new ARR, and which quarter’s spend | Finance | Billing plus general ledger | SaaS marketing metrics |
| Rule of 40 | Unit economics | Revenue growth % + profit margin % | Which margin: EBITDA, free cash flow or operating | Finance | General ledger | SaaS marketing metrics |
| Revenue growth rate | Unit economics | (Current revenue − prior revenue) ÷ prior revenue | Which revenue base, and whether the figure is annualised | Finance | Billing system | SaaS marketing metrics |
| Net Promoter Score | Retention | % promoters − % detractors | Survey trigger and population; relationship or transactional | CS Ops | Survey platform | Not yet covered by IVRIS |
| Customer satisfaction score | Retention | Satisfied responses ÷ total responses | Which rating values count as satisfied, and the response-rate floor | CS Ops | Survey platform | Not yet covered by IVRIS |
How to read the owner column
Owner means accountable for the definition, not the person who builds the report. Anyone can build the report. The owner is who you go to when two dashboards disagree, and who is expected to have an answer that does not begin with “well, it depends how you count it.”
Two assignments in that table usually cause an argument. Unit economics and retention sit with Finance rather than RevOps, because the billing system is where money actually changes hands and Finance already reconciles it. Win rate and forecast accuracy sit with RevOps rather than Sales, because both are used to judge sales performance, and a definition owned by the team it evaluates does not hold under pressure.
What the register deliberately leaves out
A register earns trust by stating its edges. Pure finance measures sit outside it, because Finance already governs them on its own cadence and RevOps rarely arbitrates their definitions: burn multiple, free cash flow margin and EBITDA margin belong in the board pack, not the revenue register. Channel-buying measures such as CPC and CPA belong to the campaign layer rather than the revenue model, and quote-to-close ratio is a pricing-desk metric wherever a CPQ process exists.
Four more are left out on purpose because they duplicate something already listed. Funnel leakage and pipeline hygiene are stage conversion and data quality wearing different names. Average deal size duplicates average contract value unless your contracts run multi-year, in which case keep ACV and drop the other. Revenue forecast variance is forecast accuracy inverted, so track one of the pair and never both, or two dashboards will report the same performance with opposite signs.
Three sit outside the register for now because IVRIS has not audited them: lead-routing accuracy, sales capacity utilisation and product feature adoption. Capacity utilisation in particular depends on quota-setting methodology, which nothing on this site covers yet.
DOWNLOAD THE REGISTER
Take the register into your own definition review with the IVRIS RevOps Metric Register v1.0 (XLSX), or the flat register as CSV. All 30 metrics with calculation, denominator decision, owner and source system, plus blank columns for your own owner, system and denominator ruling, and a second tab explaining each denominator decision. Free, no email required.
Suggested citation: IVRIS Tech. “RevOps Metrics: Definitions, Owners and Source Systems.” ivristech.com, 2026. https://ivristech.com/revops-metrics/
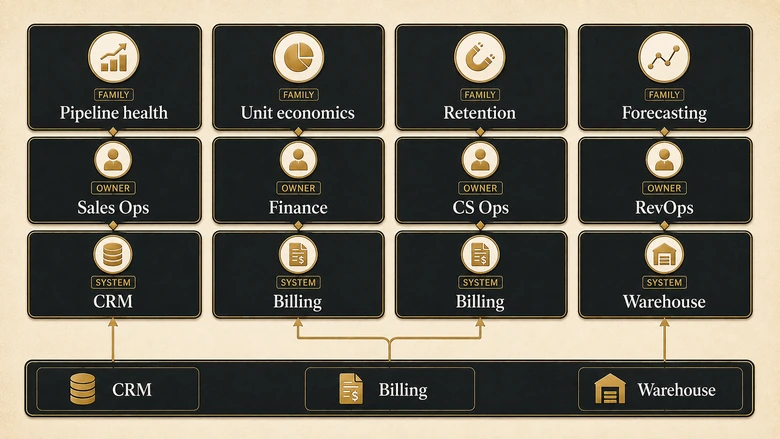
The four metric families, and which page owns each
Group revenue metrics by the decision they support, not by the team that reports them. Four families cover the ground, and each has a different failure mode.
Pipeline health
Pipeline health metrics answer whether the current quarter is winnable. They share one weakness: every one of them depends on stage definitions, so a stage rename in the CRM silently rewrites your history. Coverage, win rate and cycle length all need a stage gate named before they mean anything.
Velocity is the family’s summary statistic and the one most often misread, because a blended figure hides the segment that is actually stuck. The four inputs each need the same window and the same basis, which is why the velocity formula is really an exercise in defining its inputs. Cycle length deserves its own caution: a cohort that has not fully closed reports faster than reality, and our review of published cycle length figures shows how rarely that is disclosed. For movement between stages rather than through the whole funnel, stage-by-stage conversion benchmarks are the right reference.
Efficiency and unit economics
Unit economics metrics answer whether growth is affordable. Their failure mode is scope: CAC calculated on media spend alone and CAC calculated fully loaded with headcount can differ by a factor of three, and both get called CAC.
The formulas and the stage-based question of which ones to track at which company size are already covered in our 15-KPI B2B marketing scorecard, which is the marketing-side companion to this register. Two inputs have their own provenance problems worth knowing before you benchmark against anyone: cost per lead, where published CPL figures rarely say which lead stage they counted, and total spend, where budget benchmarks range from 7.0% to 10.1% of revenue depending entirely on the panel surveyed.
Retention and expansion
Retention metrics answer whether the base is compounding or leaking. Put every one of them in the billing system. A CRM records what someone agreed to buy; billing records what they actually paid, and after a downgrade those two disagree in the direction that flatters you.
The subscription-side definitions, including how ARR and expansion interact, sit in our SaaS metrics reference. Churn needs particular care because logo churn and revenue churn diverge sharply once account sizes vary, a distinction our churn rate breakdown works through. Where content is the retention lever rather than the acquisition one, the measurement layer is different again and lives in the content marketing dashboard.
Forecasting and process
Forecasting and process metrics answer whether the machine that produces the other three families can be trusted. This is the family RevOps owns most completely, and the one with the least reliable published data.
Attainment is the clearest example. Figures from 28% to 68% circulate as though they describe the same population, when our audit of eight published SDR attainment figures shows they measure different output units entirely. Underneath all of it sits data quality, where the widely quoted targets turn out to be vendor observations rather than measured standards, as our provenance check on CRM data quality benchmarks documents.
For account-tier programmes the engagement denominator is the target list itself, which is why ABM benchmark figures need their panel checked before use. And the MQL-to-SQL number is worthless without written acceptance criteria on both sides, which is a handoff design question covered in the MQL and SQL definitions guide.
How to assign an owner and a source system to every metric
To make the register real, run it once as a working session with the four function leads in the room. The output is not a dashboard. It is a signed list of definitions nobody can quietly change afterwards.
Workflow · 45 min
How to assign an owner and a source system to every revenue metric
Turns a contested metric list into a register with one accountable role and one system of record per number.
List only the metrics that appear in a decision
Open the last two board decks and the current QBR. Write down every metric that changed someone’s mind. Ignore anything that appears on a dashboard but has never altered a decision.
Write the denominator before the numerator
For each metric, write what you are dividing by in plain words. Where two people in the room give different answers, mark the metric as contested and move on rather than settling it now.
Name one accountable role per metric
Assign a role, not a person, and never two. If a metric is used to evaluate a team, assign it outside that team. Record the name in the register next to the definition.
Declare the system of record
Pick the one system the number is read from. Send money metrics to billing, funnel metrics to the CRM, and anything needing history to the warehouse. Retire every conflicting report that reads from somewhere else.
Settle contested metrics and set a review date
Give each contested metric to its named owner with a one-week deadline to publish a ruling. Diarise a quarterly review, because definitions drift whenever the stage model or the pricing model changes.
Forecast accuracy: the metric nobody owns yet
Forecast accuracy measures how close a commitment made on a fixed past date came to the revenue that actually closed. It is the one metric on this register that IVRIS defines here rather than routing elsewhere, because it is the metric most often quoted with no definition attached at all.
Forecast accuracy = 1 − (|Forecast − Actual| ÷ Actual)Two decisions decide whether the output is meaningful. The first is the snapshot date. An accuracy figure is only honest if the forecast was frozen on a stated day, typically day 1 or day 30 of the quarter, and compared against the close. Recomputing accuracy from a forecast that kept updating produces a number that improves as the quarter ends, which measures nothing.
The second is level. Total-company accuracy is flattering, because an overcall in one segment cancels an undercall in another. Accuracy by forecast category, or by segment, exposes the compensating errors that total accuracy hides.
Why a CRM cannot produce this number
This is also why the source system column matters. Forecast accuracy cannot be read from a CRM, because a CRM shows current state and overwrites what you believed six weeks ago. Without a warehouse snapshot or a forecasting tool that stores submissions, the metric is not merely inaccurate, it is uncomputable.
PRO TIP
Start snapshotting your pipeline nightly before you need the metric. Accuracy history cannot be reconstructed retroactively, so the cheapest version of this project is a scheduled table copy you begin today and start reporting on next quarter.
Deliberately, this page publishes no accuracy target. IVRIS has not audited the published figures for this metric, and the pattern across every other metric on this register is that undisclosed benchmarks turn out to be vendor observations. A dedicated provenance study of forecast accuracy benchmarks is the honest way to answer that, and it has not been written yet.
What breaks when nobody owns the definition
Definition drift is rarely dramatic. It shows up as meetings that spend their first fifteen minutes reconciling numbers, then make the decision on instinct because the data argument was never settled.
The scale of the gap is visible in the research. Salesloft’s Rise of RevOps study, conducted by Wakefield Research across 400 US RevOps leaders, CROs, VPs of sales and CEOs in manufacturing, telecommunications, financial services and technology, found 73% of companies now have a C-suite role dedicated to RevOps, while 89% say the function lacks clearly defined strategic goals. The seat exists. The mandate does not.
Three failure patterns, and the fix for each
Three failure patterns follow from that, and they are worth naming because each has a different fix:
- The reconciliation tax. Analysts spend their week explaining why two reports disagree instead of investigating why performance moved. The fix is a register, not a better BI tool.
- Benchmark laundering. A target with no denominator gets adopted from a vendor cheat sheet, then defended in planning as though it were measured. The fix is to require a disclosed denominator before any external figure enters a plan.
- Silent redefinition. Someone renames a stage or changes a required field and every historical trend built on it quietly shifts. The fix is naming the CRM change itself as a definition change, with the metric owner as approver.
Here is the stance, and it runs against how most teams sequence this work. Adding metrics to a dashboard is the least valuable thing a RevOps team can do this quarter. Highspot’s survey found 85% of revenue leaders already have more go-to-market activity data than they know what to do with. The constraint is not measurement coverage. It is that nothing measured has an owner, so nothing measured settles an argument. Cut the tracked list to the metrics that change decisions, then give each one a name beside it. The operating practices that sit around this, from data governance to shared incentives, are covered in our RevOps best practices guide.
Methodology and sources
Every external figure on this page is linked to the publisher that produced it, with sample size and panel stated wherever the publisher disclosed them. Highspot’s Go-to-Market Performance Gap Report 2026 surveyed 450 go-to-market leaders across six countries and five industries; it does not disclose fieldwork dates or the research firm used. Its 98% and 53% figures were read directly from the report page; the 43% and 85% figures sit inside the gated report itself and were confirmed against Highspot’s own published summaries of it rather than the PDF. The Salesloft study was conducted by Wakefield Research across 400 US respondents in four named industries; its figures were read directly from the study page, and fieldwork dates are not published.
The register’s owner and source-system assignments are IVRIS editorial judgments, not survey findings, and they are stated as recommendations rather than industry norms. No benchmark targets are published here. Where a metric has been audited on this site, the register routes to that audit rather than restating its numbers, so that each figure keeps one provenance trail. Gartner forecast accuracy data was excluded because the source pages could not be retrieved for verification.
Frequently Asked Questions
RevOps includes the process, data, systems and reporting that sales, marketing and customer success share. In practice that means owning the CRM and the wider revenue stack, defining the funnel stages and handoff criteria, governing data quality, running forecasting, and maintaining the metric definitions all three teams report against.
A workable core five is pipeline coverage, win rate, sales cycle length, net revenue retention and forecast accuracy. Together they cover whether the quarter is winnable, whether deals convert, how fast, whether the base compounds, and whether your own predictions hold. Each still needs a stated denominator to be comparable.
One role per metric, assigned outside the team the metric evaluates. Finance owns unit economics and retention because billing is the system of record for money. Sales Ops owns pipeline mechanics. RevOps owns cross-functional definitions such as win rate and forecast accuracy, plus data quality measures spanning every team.
They share a philosophy and nothing else. DevOps unifies software development and IT operations to ship code faster and more reliably. RevOps unifies sales, marketing and customer success operations around one revenue process. Both replace handoffs between siloed teams with shared systems, shared data and shared accountability.





