
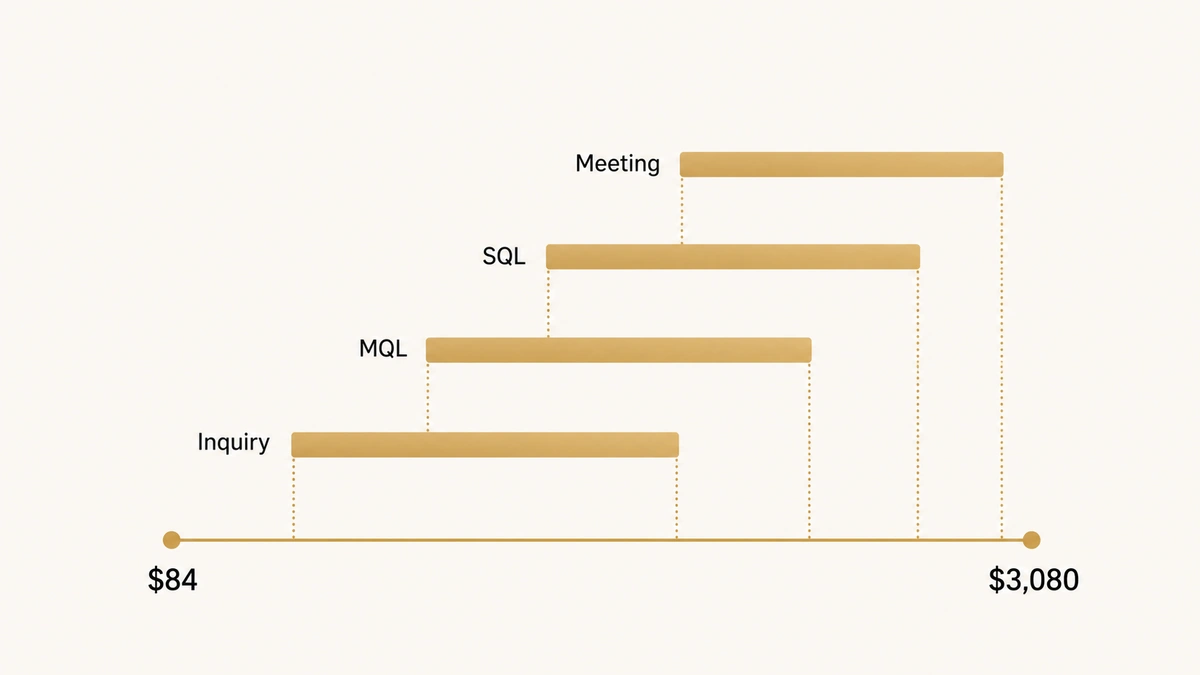
Look up what a B2B lead costs and the answer comes back as $84. Or $213. Or $237. Or somewhere between $420 and $3,080. All four are in circulation right now, all four are labelled cost per lead, and the gap between the cheapest and the dearest is roughly a hundred to one.
A hundred to one is not a market difference. No category of spending varies that much between competent and incompetent teams. It is what happens when raw form fills, marketing-qualified leads, sales-qualified leads and booked meetings are all reported under one word, by publishers who mostly do not say which one they counted.
This page does not add another set of medians to that pile. It audits the ones already there. Every figure below is published with the stage it counts, the sample it rests on, the window the data was collected in, and whether the attribution survives being checked. Two of the most-quoted numbers in this category do not survive it, and one of those is the figure most people reach for first.
Direct answer — What is the average B2B cost per lead?
There is no single reliable average B2B cost per lead for 2026. Published figures range from about $84 to $3,080 because they count different things: raw inquiries, marketing-qualified leads, sales-qualified leads or booked meetings. HubSpot reports an average of $84 across all B2B channels. Belkins reports $420 to $3,080 measured at the sales-qualified stage. Both can be right. Any CPL benchmark is comparable only if it states which stage it counts.
Key Takeaways
- Published 2026 B2B cost-per-lead figures span roughly $84 to $3,080. Almost none of that spread is a real cost difference; it is four different denominators wearing one label.
- The widely quoted “top-quartile B2B CPL of $84” is HubSpot’s average, relabelled. HubSpot’s own page states “Average B2B CPL across all channels is $84” and publishes no quartiles at all.
- The “median B2B CPL of $213” attributed to a HubSpot and Demand Gen Report study of 8,500+ companies could not be traced to any published study, and none of the pages citing it links to one.
- Belkins’ $420 to $3,080 range is honest and clearly stated, but it measures cost at the sales-qualified stage. Quoted as cost per lead, it is wrong by a factor of several.
- Four apparently independent industry tables are one dataset. First Page Sage’s table, collected January 2022 to June 2025 with no published sample size, reappears under HubSpot’s, Prospeo’s and SalesHive’s names.
- Google’s AI Overview publishes a B2B SaaS band of $50 to $110 while First Page Sage, in the same result’s own source rail, reports $237 for that segment.
- The channel with the lowest cost per inquiry is often the dearest per qualified lead, because qualification rates differ more between channels than costs do.
What B2B cost-per-lead figures actually disagree about
Cost per lead is the total spend on a channel divided by the number of leads that channel produced. The arithmetic is trivial. Everything difficult lives in the second half of that sentence, because “lead” is not a defined unit.
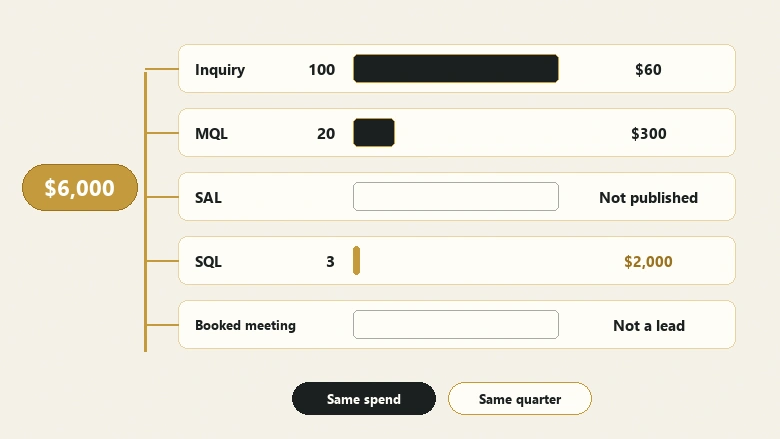
Cost per lead = Total channel spend ÷ Number of leads that channel producedTwo teams can run that calculation honestly on the same quarter of the same business and report $60 and $2,000. Neither has made an error. One divided spend by every contact record created. The other divided the same spend by the handful of those records a salesperson agreed to work. The published benchmarks do exactly this to each other, at scale, and rarely say so.
Here is what the major 2026 figures actually measure, side by side.
| Published figure | Source | What it counts | Sample | Data window |
|---|---|---|---|---|
| $84 average, all B2B channels | HubSpot | Not defined | Not disclosed | Not stated |
| $237 blended B2B SaaS ($310 paid, $164 organic) | First Page Sage | Raw lead, no stage qualification | Not disclosed | Jan 2022 to Jun 2025 |
| $30 to $200 per qualified lead | Zeliq | Stated as qualified; stage not resolved | Not disclosed | Not stated |
| $420 to $3,080 | Belkins | Sales-qualified stage, stated explicitly | 1,000+ companies, 50+ industries | Not stated |
| $50 to $110 for B2B SaaS | Google AI Overview | Not defined | Not applicable | Captured Aug 2026 |
| $213.60 all-industry average | Amra & Elma | Not defined | Study not locatable | Not stated |
Read the third column before the first. Belkins and HubSpot are not disagreeing about the price of a lead by a factor of thirty. They are answering two different questions, and only one of them said which.
The five things publishers call “a lead”
A lead is any of five distinct units, and the cost changes by an order of magnitude depending on which one a publisher counted. This is the single most useful table on this page.
| Unit | What it counts | Effect on the reported cost |
|---|---|---|
| Inquiry (raw lead) | Any contact record created: a form fill, a content download, a list upload, a badge scan at a stand. | Largest denominator, so the smallest cost. Includes contacts no salesperson will ever open. |
| MQL | An inquiry that passes a marketing scoring threshold set locally and not comparable between companies. | Cost rises by however strict the local score happens to be. That is not a knowable quantity from outside. |
| SAL | An MQL that sales has formally accepted for work. | Adds a human acceptance gate, so cost rises again and becomes sensitive to sales capacity. |
| SQL | A lead sales has qualified as a genuine opportunity candidate. | Smallest of the four, so the largest cost. Often several times the raw-inquiry figure for identical spend. |
| Booked meeting | A held appointment on a calendar. | Not a lead at all. Appointment-setting costs are the highest in circulation and are routinely requoted as CPL. |
Move a single figure across that table and it changes more than any optimisation you could run on it. A channel at $60 per inquiry with a 20% inquiry-to-MQL rate and a 15% MQL-to-SQL rate costs $2,000 per SQL. Same spend, same channel, same quarter. The only thing that changed is which row you counted.
IMPORTANT
Before comparing your cost per lead with any published figure, find out which of these five units the figure counts. If the source does not say, the comparison cannot be made, and no amount of adjustment will rescue it.
Where the $84 top-quartile figure came from
One number dominates this category. It appears across dozens of 2026 pages in the same shape: top-quartile B2B programmes run a cost per lead of $84, the median is $213, and the bottom quartile is $397, giving a 4.7x spread between disciplined and undisciplined teams. It is usually credited to HubSpot’s State of Marketing 2026, sometimes to a joint HubSpot and Demand Gen Report study covering more than 8,500 companies globally.
Checked against the sources, that account does not hold.
HubSpot does publish an $84 figure. On its CPL and CAC benchmarks page, last updated 14 July 2026, the sentence reads: “Average B2B CPL across all channels is $84.” It is an average. The word quartile does not appear on that page. Neither does median, nor $397, nor $213, nor 8,500, nor any reference to Demand Gen Report.
HubSpot’s State of Marketing 2026 report, meanwhile, publishes no cost-per-lead benchmarks at all. And the joint 8,500-company study could not be located anywhere on the public record. None of the pages carrying that attribution links to it, and several of them list twenty numbered sources without including the study they credit for their headline number.
So the only figure in that set traceable to a named publisher is $84, and on that publisher’s own page it is a central average rather than the top of a distribution. The median and the bottom quartile wrapped around it, and the sample they are attributed to, have no locatable source. A single average appears to have been re-badged as a quartile boundary, and a distribution constructed around it after the fact.
PRO TIP
Quote $84 as HubSpot’s average B2B cost per lead across all channels, with the July 2026 page date attached. Do not quote it as a top quartile, and do not pair it with the $213 median or the $397 bottom quartile, neither of which traces to a published study.
Four independent sources, one dataset
The second problem is quieter and affects more pages. Independent corroboration is the usual test for a benchmark: if four publishers report similar industry figures, the figures are probably sound. In this category that test fails, because the four are not independent.
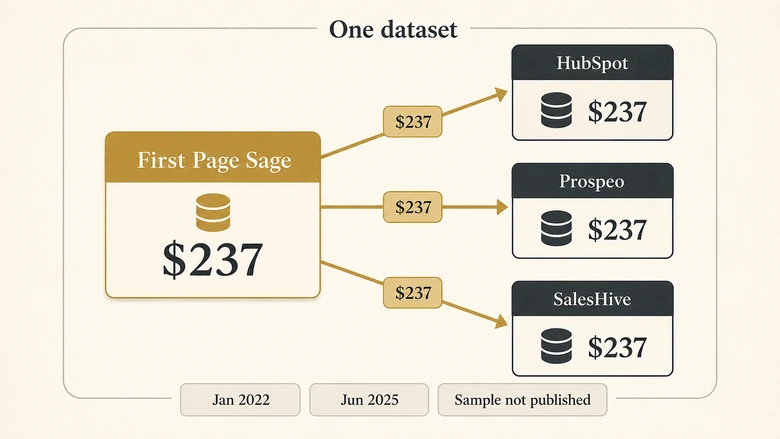
First Page Sage’s cost-per-lead-by-industry report is the origin. It gives B2B SaaS a blended CPL of $237, cybersecurity $406, financial services $653, software development $591, manufacturing $553. The data was collected between January 2022 and June 2025. The report does not disclose a sample size.
HubSpot’s industry table carries those same values and states plainly that it “combines insights from FirstPageSage’s 2026 report”, despite the page being badged as HubSpot Research. Prospeo publishes the same table and credits First Page Sage explicitly, naming the same collection window. SalesHive carries the same $237 and $198 figures without naming the origin.
Four tables, one dataset, collected in a window that closed in June 2025 and presented throughout as a 2026 benchmark. Averaging them does not strengthen the number. It counts one unsampled table four times.
B2B cost per lead by channel, with denominators attached
Channel figures are the most requested and the worst documented. Below is what the major publishers report, with the denominator each one uses and what is disclosed about its method. These are not IVRIS measurements. IVRIS has not run a CPL study, and a table presented as ours would be exactly the problem this page is about.
| Channel | Reported range (USD) | Denominator | Source and what it discloses |
|---|---|---|---|
| Content and SEO | $15 to $200 | Raw inquiry | Google AI Overview $15 to $60 after a 4 to 9 month ramp; SalesHive $80 to $200 fully loaded. Neither discloses a sample. |
| Organic social | $15 to $95 | Raw inquiry | Agency-published medians only. No method, sample or collection window disclosed. |
| Meta ads | $25 to $180 | Raw inquiry | Google AI Overview $25 to $75 for standard targets. Agency figures run higher for B2B retargeting. |
| Cold email | $30 to $120 | Raw inquiry | SalesHive $30 to $50; Zeliq $30 to $120 with a stated 25% to 40% SQL rate. Samples not disclosed. |
| Google Search ads | $50 to $350 | Raw inquiry | Google AI Overview $50 to $150+; Zeliq $70 to $350+. Driven by auction competition, so it moves quarterly. |
| Webinars | $33 to $600 | Registration, not always a lead | Widest definitional variance on this table. A registration and an attendee are not the same unit. |
| LinkedIn ads | $80 to $380 | Raw inquiry or lead-form fill | Google AI Overview $80 to $300+. Lead-gen forms lower the cost and the intent at the same time. |
| SDR cold outbound | $280 to $950 | Varies; often a booked meeting | Fully loaded figures include SDR salary. Frequently quoted per meeting, then requoted as CPL. |
| ABM 1:many | $200 to $700 | Engaged account, not a person | Account-level denominator. Not comparable with any person-level figure on this table. |
| In-person events | $280 to $1,500 | Badge scan to booked meeting, varies | The unit changes between publishers more than the cost does. |
| ABM 1:1 enterprise | $1,200 to $5,000+ | Engaged account | Small programmes, so figures rest on few observations. Treat as directional only. |
Two structural warnings about this table. Webinar and event rows mix registrations, attendees, badge scans and booked meetings, which is why their ranges look wilder than their true cost variance. And both ABM rows count accounts rather than people, so they belong to a different denominator entirely and should never be averaged with the rest.
Cost per lead by industry, and what those tables inherit
Industry figures come from two sources with incompatible denominators, and the difference between them is the clearest illustration on this page of why a single benchmark cannot exist.
| Industry | First Page Sage, blended, raw lead | Belkins, sales-qualified stage |
|---|---|---|
| B2B SaaS | $237 | $420 to $2,800 |
| Software development and IT services | $503 to $591 | $1,680 to $3,080 |
| Cybersecurity | $406 | $700 to $2,800 |
| Financial services and fintech | $653 | $700 to $1,750 |
| Manufacturing | $553 | $420 to $1,820 |
| Construction | $227 | Not reported separately |
| Healthcare | $361 | Not reported separately |
First Page Sage’s column is blended paid and organic, counts raw leads, was collected between January 2022 and June 2025, and carries no published sample size. Belkins’ column comes from agency delivery data across more than 1,000 companies in 50-plus industries, and its methodology states that CPL is “measured at the sales-qualified stage rather than initial capture”. Belkins is the more transparent of the two about what it counts and the less transparent about when.
The consistent three-to-five-fold gap between the columns is not a disagreement. It is the price of qualification, visible for once because one publisher declared its stage.
PRO TIP
Manufacturing and construction sit at the low end of both columns; cybersecurity, financial services and IT services sit at the high end. That ordering is stable across sources even where the absolute values are not, which makes relative position the safer thing to benchmark against.
This is a B2B page
Every figure above is B2B. Local and consumer services run on different economics entirely, with far lower absolute costs and a much shorter path from enquiry to job. If you are pricing leads for a home-services or local business, the channel-by-channel figures in our guide to local lead generation are the right reference, and mixing the two sets will mislead you in both directions.
Why the cheapest channel is often the most expensive
The practical consequence of all this is a ranking problem. Channels are almost always compared on cost per inquiry, because that is the number every ad platform reports without being asked. But qualification rates vary more between channels than costs do, and the two tend to move in opposite directions.
Take two channels. The first delivers inquiries at $60, converts 20% of them to MQL and 15% of those to SQL. The second costs $300 per inquiry, converts 60% to MQL and 40% of those to SQL.
| Metric | Channel A | Channel B |
|---|---|---|
| Cost per inquiry | $60 | $300 |
| Inquiry to MQL | 20% | 60% |
| MQL to SQL | 15% | 40% |
| Cost per MQL | $300 | $500 |
| Cost per SQL | $2,000 | $1,250 |
| CPL to cost-per-SQL multiplier | 33x | 4.2x |
Channel A looks five times cheaper and is 60% more expensive for the only thing either channel exists to produce. This is not a contrived example. Self-serve and broad-reach channels routinely collect large volumes of contacts with weak intent, while high-cost channels tend to be aimed at people who already qualify.
The multiplier in the last row is the number worth tracking. Channels with a low multiplier convert cost into pipeline efficiently regardless of what they charge per inquiry. Anything above about 15x is worth investigating before it is worth scaling.
To run this on your own numbers you need each channel’s own conversion rates, not a company-wide average. A blended rate cancels out precisely the difference the calculation is meant to expose. Our B2B lead conversion rate benchmarks covers what the published MQL-to-SQL rates do and do not measure, and why the widely quoted 13% is a different metric altogether. Use it for context, and your CRM for the rates themselves.
Cost per lead is also the input to the metric your finance team actually cares about. If cost per SQL is where marketing efficiency shows up, customer acquisition cost is where it lands, and the relationship between them is set by the win rate you apply after this calculation ends.
How to work out your own cost per qualified lead
Workflow · 30 min
How to calculate cost per qualified lead by channel
Produces a channel ranking by cost per SQL rather than cost per inquiry, using your own qualification rates.
Pick a closed window
Choose a quarter that ended at least one full sales cycle ago. Leads created inside an open window have not had time to qualify, which understates cost per SQL on every channel unevenly.
Pull spend per channel
Include media, agency fees and the loaded salary cost of anyone working that channel. Decide once whether you are reporting media-only or fully loaded, and apply it to every row.
Count leads created per channel
Count contact records created in that window, attributed by first touch. Note the attribution rule you used; changing it later changes every figure below.
Pull each channel’s own qualification rates
Get inquiry-to-MQL and MQL-to-SQL per channel from your CRM. Do not substitute a company average or a published benchmark; both erase the variance you are measuring.
Divide and rank
Divide spend by inquiries, then by both rates, to get cost per SQL. Rank channels on that figure and on the CPL-to-cost-per-SQL multiplier.
Compare the two rankings
Any channel that moves more than two places between the CPL ranking and the cost-per-SQL ranking is being mispriced by your current reporting. Start there.
Run it once and the ranking usually reorders. Run it quarterly and you can see qualification rates drift, which is the earliest warning that a channel is decaying while its cost per inquiry still looks healthy.
Cite this page
Both assets behind this page are free and need no email. The IVRIS B2B CPL Denominator Ledger carries all twelve audited figures with publisher, denominator, sample, window, currency and provenance verdict: XLSX or CSV. The Quality-Adjusted Cost per SQL Model (XLSX) converts any published figure onto your own denominator. Reuse permitted with attribution.
Suggested citation: IVRIS Tech, “B2B Cost Per Lead Benchmarks: Why the Published Figures Disagree by 100x”, https://ivristech.com/b2b-cost-per-lead-benchmarks/, 6 August 2026.
Where the public record runs out
An honest benchmark page should say what it could not establish. Four things.
No B2B cost-per-lead figure in circulation has both a disclosed sample size and a stated qualification stage. Belkins gives the stage and the company count but no collection window. First Page Sage gives the window but no sample. Everyone else gives neither. That combination does not currently exist in public, which is why this page publishes no IVRIS median.
Nobody has published cost per lead segmented by qualification stage from the same population. The three-to-five-fold gap between raw-lead and SQL-stage tables is inferred by comparing two different publishers’ datasets. A single organisation reporting both from one book of business would settle the question and does not appear to exist.
The quartile distribution everyone quotes has never been measured. There may well be a 4.7x spread between disciplined and undisciplined B2B programmes. It is plausible. It is simply not something any locatable study has established.
Currency is almost never stated. Every figure on this page is assumed to be US dollars because that is the convention, not because the publishers said so. For teams buying leads in other markets, that assumption is doing more work than it should.
Methodology, sources and revision history
Each figure was opened at its own URL and read for publisher, publication or update date, collection window, sample size, denominator, currency and paid-or-blended basis. Where a page attributed a figure to a study, that study was searched for separately rather than taken on trust. “Untraceable” throughout means the named study could not be located on the public record as at 6 August 2026; it is not a claim that no such study exists anywhere.
IVRIS has not conducted a cost-per-lead study and publishes no CPL benchmark of its own on this page. The worked examples use round illustrative figures, clearly labelled as such, and are not drawn from client data. Where this page reports a range, the range is the span of what other publishers report, not a measurement.
Primary sources: HubSpot CPL and CAC benchmarks (page updated 14 July 2026); First Page Sage, Average Cost Per Lead by Industry, published 8 May 2025 and updated 23 December 2025, data collected January 2022 to June 2025; Belkins, B2B Cost Per Lead Benchmarks, 20 March 2026; Zeliq, 29 December 2025; SalesHive, updated 10 July 2026; Google AI Overview for “cost per lead benchmarks”, captured 2 August 2026.
Version 1.0, 6 August 2026. Figures verified 6 August 2026. This page is on a 90-day review cycle because paid-channel costs and AI Overview output both move faster than the annual benchmark reports they are drawn from.
Frequently Asked Questions
A reasonable cost per lead is one that produces a qualified lead for less than your target acquisition cost allows. There is no universal figure. Published B2B ranges span $84 to $3,080 because they count different qualification stages, so judge your number against your own economics rather than a benchmark.
Divide total spend on a channel by the number of leads it produced in the same period. Decide first whether spend is media-only or fully loaded, and whether a lead means an inquiry, an MQL or an SQL. Apply both decisions consistently to every channel you compare.
It is a diagnostic rather than a target. Cost per lead alone rewards cheap volume, because the lowest-cost channel is frequently the dearest per qualified lead. Track cost per SQL as the KPI and keep cost per lead beside it to show where qualification is being lost.
Published figures for B2B SaaS range from $50 to $110 in Google’s AI Overview, $237 blended in First Page Sage’s report, and $420 to $2,800 in Belkins’ data. The spread is definitional: the first two count raw leads, the third counts sales-qualified leads.
On raw-lead figures, construction runs about $227 and B2B SaaS $237, rising to $553 for manufacturing, $591 for software development and $653 for financial services. Those values come from one dataset collected between January 2022 and June 2025 with no published sample size.
Because “lead” names five different units: inquiry, MQL, SAL, SQL and booked meeting. A figure measured at the sales-qualified stage can be several times one measured at form fill for identical spend. Most published benchmarks do not state which unit they counted.





