
Ask what a good MQL to SQL conversion rate is and the answer comes back as a single number. Thirteen per cent. Or 21%. Or 40%. All three are in circulation right now, all three are presented as the average MQL to SQL conversion rate, and not one of them measures what its label claims. The first is a lead-to-opportunity figure from 2014. The second was attributed to a report nobody can produce. The third is a vendor’s own client book with no published definition of what counted as qualified.
That is not a rounding disagreement. It is a category error, repeated so often that the original meanings have come loose from the numbers. Compare your funnel against the wrong one and you will either congratulate yourself for a problem or start fixing something that was never broken.
This page does the thing the benchmark pages skip. Every rate here is published with its denominator attached, its population named, and its age on the label. MQL to SQL sits inside the wider B2B conversion rate question, so the other six transitions are here too, each carrying the same declarations. Where a widely quoted figure turns out to mean something other than what it is used to mean, that is stated plainly, with the trail back to the source. And because the question people actually ask is which channels convert best and where they lose them, the channel data is broken out stage by stage rather than collapsed into one average.
Direct answer — What is a good MQL to SQL conversion rate?
MQL to SQL conversion rate is the share of marketing-qualified leads that sales accepts and works. For B2B SaaS it runs 26% to 51% by acquisition channel, with SEO-sourced leads highest and paid search lowest. The widely quoted 13% is a different metric: lead-to-opportunity, measured in 2014. Any MQL to SQL benchmark is comparable only if it states the MQL definition, the SQL definition, and whether recycled leads sit in the denominator.
Key Takeaways
- MQL to SQL runs 26% to 51% for B2B SaaS depending on acquisition channel. SEO-sourced MQLs convert at nearly twice the rate of paid search.
- The 13% quoted everywhere as MQL to SQL is lead-to-opportunity, from a 2014 study whose original page no longer exists. It is frequently attributed to Forrester. It came from Implisit.
- The publisher behind the 26% to 51% range also publishes 13% for B2B SaaS in a separate industry report and does not reconcile the two, so neither figure can be quoted without naming which report it came from.
- Google’s AI Overview reports a 13% cross-industry median for this query. The industry table it draws on publishes no median at all, and the actual median of its 30 rows is 15%.
- “B2B conversion rate” names at least seven different measurements. Most published benchmarks do not say which one they used, which makes them uncomparable rather than merely imprecise.
- “Opportunity” is defined two incompatible ways in public benchmarks, which is why opportunity-to-close appears as both 6% and 32% to 40% in credible sources.
- Measured from website visitor all the way to closed-won, the channel spread widens to about nine to one, because weak stages compound rather than average out.
What “B2B conversion rate” actually measures
B2B conversion rate is the share of one defined funnel population that reaches the next defined stage, which means the figure carries no information until both the population and the stage are named. The arithmetic is trivial. The definitions are where all the difficulty lives.
Conversion rate = Records reaching the end stage ÷ Records in the starting population × 100Two teams can run that calculation honestly on the same quarter of the same business and report 1.4% and 41%. Neither is wrong. One divided closed deals by website sessions; the other divided marketing-qualified leads by raw form fills. The gap between them is definitional, not performance.
Below are the seven measurements that circulate under the single label “B2B conversion rate.” When a benchmark does not tell you which row it belongs to, it cannot be used for comparison at all.
| Rate | Starting population | End point | Published band | What it tells you |
|---|---|---|---|---|
| Visitor to lead | Website sessions or unique visitors | Contact details submitted | 0.7% – 2.2% | Traffic quality and offer strength |
| Session to qualified lead or sale | Tracked sessions, all channels | Form fill or inbound call judged genuine | 1.9% – 7.9% | Whether acquisition spend reaches intent |
| Lead to MQL | All submitted leads | Fits target market or persona | 36% – 44% | Targeting accuracy of the channel |
| MQL to SQL | Marketing-qualified leads | Accepted and worked by sales | 26% – 51% | Marketing and sales alignment |
| Lead to opportunity | All leads entering CRM | Opportunity record created | 13% average | How much of the top of funnel is real |
| Opportunity to closed-won | Open opportunities | Deal won | 6% – 40% | Sales execution, if “opportunity” is defined |
| Lead to customer | All leads | Revenue | 1.2% – 3.7% | The only end-to-end commercial number |
The stage names themselves are contested, which is the deeper problem. A lead that one company counts as marketing-qualified another counts as an unworked enquiry, and the difference between what marketing calls qualified and what sales will actually accept moves the reported rate by tens of points without anything changing operationally. Teams that have formalised a handoff stage where sales explicitly accepts or rejects the lead get cleaner numbers, because acceptance is an event rather than an opinion.
Everything below sits inside the wider structure of stages a B2B deal passes through. This page is the measurement layer on top of it.
MQL to SQL conversion rate benchmarks, and the rest of the funnel
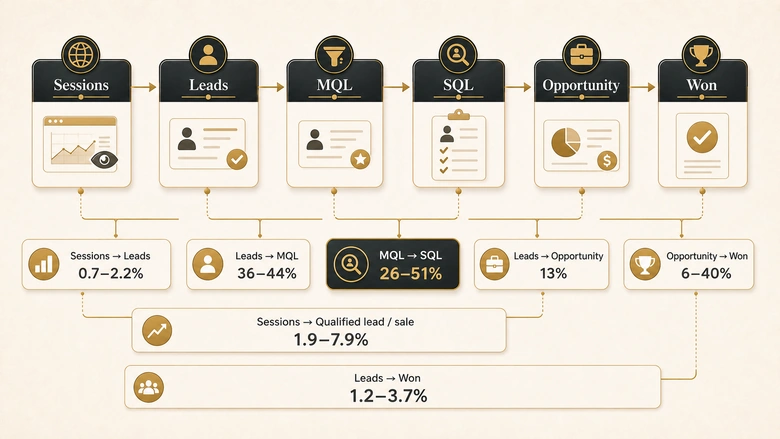
Stage-level B2B conversion benchmarks come from a small number of real datasets and a large number of pages recycling them. MQL to SQL is the transition with the widest published spread and the weakest provenance, so it is worth reading in the context of the stages either side of it. Sorted by how much of the funnel each source actually measured, the evidence looks like this.
| Stage transition | Figure | Source and date | Population and sample | Quotable? |
|---|---|---|---|---|
| Visitor to lead | 0.7% – 2.2% by channel | First Page Sage, updated June 2025 | 50+ B2B SaaS clients, $10M–$100M revenue focus, one agency’s book | Yes, for B2B SaaS |
| Visitor to lead, by industry | 1.1% B2B SaaS to 7.4% legal services | First Page Sage, updated Sept 2025 | Own client portfolio, Jan 2022 – Aug 2025, sample size undisclosed | Yes, with the caveat |
| Session to qualified lead or sale | 5.13% all industries | Ruler Analytics, May 2026 | 110M+ sessions, 5M+ conversions, 13 industries, multi-touch | Yes, but it blends B2B and B2C |
| Lead to MQL | 36% – 44% by channel | First Page Sage, June 2025 | As above | Yes, for B2B SaaS |
| MQL to SQL | 26% – 51% by channel | First Page Sage, June 2025 | As above | Yes, for B2B SaaS |
| MQL to SQL, by industry | 10% – 26%, B2B SaaS at 13% | First Page Sage, published Oct 2024, updated Dec 2025 | Client data 2019–2025, 30 industries, sample undisclosed | Yes, as a six-year cross-section |
| MQL to SQL | “13% to 21%” | Attributed to Forrester by several pages | No Forrester publication located carrying it | No, see below |
| Lead to opportunity | 13%, average 84 days | Implisit via Salesforce, Nov 2014 | Aggregated Salesforce pipeline data, “hundreds of companies” | Yes, but it is twelve years old |
| Opportunity to closed-won | 6%, average 18 days | Implisit via Salesforce, Nov 2014 | As above, standard CRM opportunity | Yes, with the definition stated |
| Opportunity to closed-won | 32% – 40% by channel | First Page Sage, June 2025 | Defines opportunity as “an MQL with contract in hand” | Yes, but not the same metric |
| Qualified lead to opportunity | “15% to 25%” | HubSpot glossary | No source cited on the page | No |
| Proposal to closed deal | “25% to 40%” | HubSpot glossary | No source cited on the page | No |
Two rows in that table are marked not quotable, and both come from the page currently ranking first for this query. HubSpot’s glossary entry states that B2B teams typically see 15% to 25% conversion from qualified leads to opportunities and 25% to 40% from proposal to closed deals, and cites nothing for either figure. The numbers may well be reasonable. Without a population or a method behind them, there is no way to check, and no way to know whether your funnel is comparable.
Where the 13% figure everyone calls MQL to SQL actually comes from
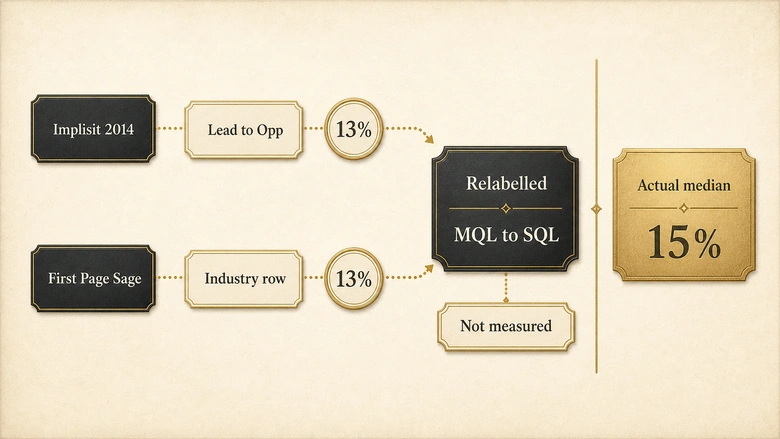
The most-quoted number in B2B funnel measurement is 13%, and almost every property it appears on labels it wrong. It is not MQL-to-SQL. It is lead-to-opportunity, and it comes from Implisit, a pipeline-analytics company later acquired by Salesforce, published on the Salesforce blog on 20 November 2014 by then-CEO Gilad Raichshtain. The study analysed anonymised pipeline data from hundreds of companies and found 13% of leads converted to opportunities in an average of 84 days.
Two things follow. First, the figure is now twelve years old, and its original URL redirects to a category index, so the only readable copy is an archive snapshot. A benchmark whose primary publication has been deleted is not a live benchmark. Second, several current pages attribute it to Forrester. LeanData’s post on declining lead-to-opportunity rates, which ranks on page one for this query, states that “according to Forrester and multiple industry benchmark reports, average MQL-to-SQL conversion rates range from 13% to 21%”. We could not locate any Forrester publication carrying that figure. The 13% traces to Implisit.
The relabelling has a traceable point of origin, and it is the page ranking first for this query. Geckoboard’s KPI reference publishes Implisit’s four lead-source rows (website 31.3%, customer or employee referral 24.7%, webinars 17.8%, email campaigns 0.9%) under an MQL to SQL heading, and asserts the equivalence in a parenthetical: “the average conversion rate from Lead to Opportunity (another way of saying MQL to SQL) was 13%”. It is not another way of saying it. Those two stages sit on either side of qualification, which is the boundary this metric exists to measure. Every lead-source figure now circulating as MQL to SQL data descends from that clause, and the Salesforce page Geckoboard cites for it is the URL that no longer resolves.
The same post reports that “only 2.9% of MQLs ever convert to revenue,” citing Ruler Analytics. Ruler’s 2.9% was a median website conversion rate, decomposing into roughly 1.7% from forms and 1.2% from calls. It counts sessions, not MQLs, and it ends at a captured lead, not at revenue. The number is real. It has been moved two stages down the funnel.
IMPORTANT
Before you quote any stage benchmark, check whether the source measured the stage it is being used for. Three of the most-circulated B2B conversion figures have been relabelled somewhere in the chain of citation.
What the newer MQL to SQL claims are actually measuring
A second set of figures has entered circulation since the Implisit correction, and they now arrive bundled. Search for this metric and the answer engine returns four claims in one sentence: a 13% cross-industry median, 18% to 22% for B2B SaaS, 35% to 40% for top performers, and 39% to 40% for companies using behavioural scoring. We traced each one. The table below records what every claim declares about its own measurement, which is the only basis on which any of them could be compared with your funnel.
| Claim | Publisher and year | MQL definition used | SQL definition used | Sample and population | Recycled leads in denominator? | Verdict |
|---|---|---|---|---|---|---|
| 26% – 51% by channel | First Page Sage funnel matrix, June 2025 | Intent signal plus ability to afford, as published | Vetted by a salesperson, meeting booked | 50+ B2B SaaS clients, $10M–$100M; no per-cell sample | Not stated | Quotable for B2B SaaS, by channel |
| 13% for B2B SaaS | First Page Sage industry report, published Oct 2024, updated Dec 2025 | Same published definitions | Same published definitions | Client data 2019–2025, 30 industries, sample undisclosed | Not stated | Quotable, but it contradicts the same publisher’s channel matrix |
| 45% for SaaS, 60%+ “best-in-class” | Optifai Sales Ops Benchmark, updated April 2026 | Not on the page; routed to a glossary entry | Not on the page; routed to a glossary entry | 939 B2B companies, Q2 2025 – Q1 2026 | Not stated | Partial. The only figure here with a declared sample and window, still with no declared denominator |
| “13% cross-industry median” | Google AI Overview, Aug 2026, drawing on the industry report | Not stated | Not stated | No median is published in the table it cites | Not stated | No. That table’s actual median is 15% |
| “18% to 22% for B2B SaaS” | Growthspree and Prooflytics, 2026 | Not stated | Not stated | None disclosed by either page | Not stated | No. A third page publishes 18% to 22% as a B2C figure |
| “35% to 40% for top performers” | Not published as a range by any source located | Not stated | Not stated | None disclosed; “top performer” undefined | Not stated | No. Spliced from a 25% to 35% claim and a separate “as high as 40%” |
| “39% to 40% with behavioural scoring” | Data-Mania, Growthspree, Prooflytics, 2026 | Not stated | Not stated | None disclosed; no control group | Not stated | No. An uplift claim with no counterfactual |
| “13% to 21%” | Attributed to Forrester by several pages | Not applicable, the metric is misnamed | Not applicable | No Forrester publication located | Not applicable | No. Wrong stage, wrong attribution |
| 13%, average 84 days | Implisit via Salesforce, Nov 2014 | Not an MQL stage; all leads entering CRM | Opportunity record created | “Hundreds of companies”; primary URL deleted | Not stated | Quotable as lead-to-opportunity only |
Only two rows survive as MQL to SQL benchmarks, and both come from the same publisher. Everything else either declares nothing about its own denominator or turns out to be a different metric wearing this one’s label. The pattern is worth naming: none of the four newer claims states what counted as an MQL, what counted as an SQL, or whether a lead recycled back to marketing and later re-qualified is counted once or twice. Those three declarations decide the number more than performance does.
One source breaks that pattern, and it is worth saying plainly because it cuts against the argument this page has been making. Optifai publishes 45% for SaaS and 60% or better for what it calls best-in-class, and unlike every other page on this query it declares where the number came from: a benchmark of 939 B2B companies covering Q2 2025 to Q1 2026. A stated sample and a stated collection window are precisely what the rest of this SERP is missing, and that earns it a hearing the others have not. What it still does not carry is a definition. The page routes MQL and SQL to separate glossary entries instead of declaring what counted inside this dataset, so the 45% is comparable with your funnel only if your qualification bar happens to match one nobody published. It is the best-sourced figure on the query and it is still not one you can benchmark against.
The cross-industry median is the clearest failure, because it is checkable. It points at First Page Sage’s MQL to SQL conversion rate by industry report, which publishes 30 industry rows from client data gathered between 2019 and 2025 and states no average or median anywhere on the page. We took the 30 published rows and ran the arithmetic: the median is 15% and the unweighted mean is 16.1%, across a range of 10% to 26%. The 13% being reported as the cross-industry median is simply the B2B SaaS row, one of five industries that happen to sit at 13%, relabelled as a summary of all thirty.
The “top performers” range shows a different failure, one that is worth watching because it happens in public. Growthspree publishes 25% to 35% for top performers, drawn from its own undisclosed client data. Data-Mania separately reports top performers reaching “as high as 40%.” Neither publishes 35% to 40%. That range exists because the upper bound of one claim and the upper bound of another were read as a single band. A statistic with no source is being assembled out of two statistics with no source, and it now appears in an answer engine as settled fact.
Why the same publisher reports both 13% and 51%
First Page Sage is the source behind both surviving rows, and the two do not agree. Its B2B SaaS funnel matrix puts MQL to SQL between 26% and 51% by channel. Its industry report puts B2B SaaS at 13%. Even the weakest channel in the matrix, paid search at 26%, is twice the industry figure, and the five-channel mean of 38.4% is close to three times it. Same publisher, same stage transition, same named industry, no reconciliation offered on either page.
The two reports are not measuring the same population. The funnel matrix is drawn from 50-plus B2B SaaS clients in the $10M to $100M revenue band, with stage definitions held constant across the channel columns so the columns can be compared with each other. The industry report spans 2019 to 2025 across thirty industries with no disclosed sample, so its B2B SaaS row is a long-run figure averaged over six years of changing definitions and a much broader client mix. A six-year average and a current channel cut will not match, and the gap between them is the size of the entire finding most pages built on either number are trying to report.
The practical consequence is that neither figure can be quoted as “the B2B SaaS MQL to SQL rate” without naming which report it came from. This page uses the channel matrix as its headline range, because a channel comparison needs stage definitions that stay constant across channels and only the matrix provides that. Anyone citing 13% for B2B SaaS is not wrong, but they are citing a six-year cross-section, and they should say so. It is also worth checking your own blend before comparing against either, because the rules that decide which touch gets credit for a lead decide which channel that MQL is counted under, and therefore what your channel mix looks like.
Why “opportunity to close” appears as both 6% and 32% to 40%
These two figures look irreconcilable and both are correct. Implisit measured a standard CRM opportunity: a record a rep opens after qualifying a lead. On that basis 6% of opportunities became deals. First Page Sage defines an opportunity as “an MQL with contract in hand,” and on that basis 32% to 40% close.
A contract in hand is very late in a deal. Almost everything that will go wrong has already happened by then, so the close rate is high. A freshly opened pipeline record is early, speculative, and often optimistic, so the close rate is low. The five- to sixfold gap is entirely definitional, and it is why an opportunity-to-close benchmark is worthless without the definition printed next to it.
This is also where the thresholds you set for qualification quietly determine your own benchmark. Raise the bar for what becomes an opportunity and your close rate climbs while your absolute deal count does not move.
Two adjacent transitions are measured in more depth elsewhere on this site rather than repeated here: the demo funnel, where requested demos and held demos turn out to be six separate measurements, and the lead-to-meeting step, where the same funnel can honestly report 20% or 70% depending on the meeting definition used.
MQL to SQL conversion rate by channel, stage by stage
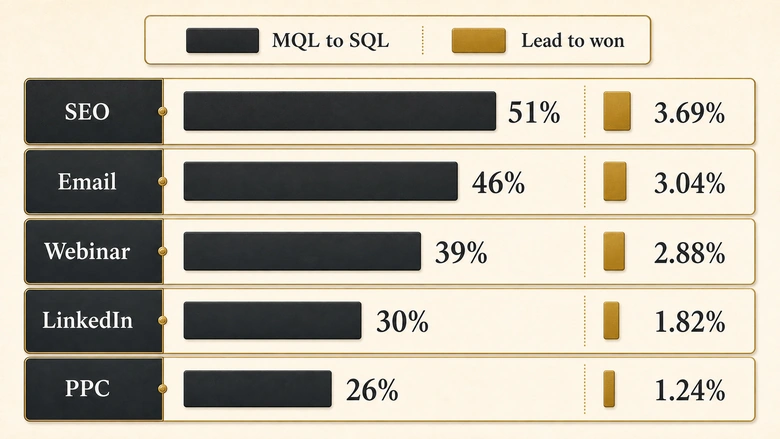
Channel conversion rates only become useful when they are broken out by stage, because channels do not underperform evenly. A channel can produce leads efficiently and then lose almost all of them at qualification, and a single blended average hides exactly that. MQL to SQL is where that hiding does the most damage, because it is the stage with the widest gap between the best and worst channel.
First Page Sage publishes the one public stage-by-channel matrix for B2B SaaS, drawn from more than 50 client accounts and last updated 11 June 2025. It is a single agency’s book of business rather than an audited industry sample, so treat it as a well-documented directional benchmark. Its value is that the stage definitions stay constant across every channel, which makes the columns genuinely comparable with each other.
| Stage transition | SEO | PPC | Webinar | ||
|---|---|---|---|---|---|
| Website visitor to lead | 2.1% | 0.7% | 2.2% | 1.3% | 0.9% |
| Lead to MQL | 41% | 36% | 38% | 43% | 44% |
| MQL to SQL | 51% | 26% | 30% | 46% | 39% |
| SQL to opportunity | 49% | 38% | 41% | 48% | 42% |
| Opportunity to closed | 36% | 35% | 39% | 32% | 40% |
Read down the PPC column and the problem is visible. PPC starts worst at visitor-to-lead, 0.7% against SEO’s 2.1%, then loses again at MQL-to-SQL, 26% against SEO’s 51%. Its closing rate is fine. By the time a deal is on the table, PPC-sourced opportunities close at 35%, statistically level with SEO’s 36%. The channel’s weakness is entirely in qualification, not in sales execution.
What the channels actually deliver end to end
Those stage rates matter most compounded, because that is the number a budget decision rests on. Multiplying the four post-lead transitions in each column gives the share of leads from that channel that reach closed-won, and multiplying by the visitor-to-lead rate as well gives the full journey from a website session. These are IVRIS calculations from the First Page Sage figures above, chained within a single source so the stage definitions stay consistent.
| Channel | Lead to closed-won | Visitor to closed-won | Weakest stage in the chain |
|---|---|---|---|
| SEO | 3.69% | 0.077% | Opportunity to closed, 36% |
| 3.04% | 0.039% | Opportunity to closed, 32% | |
| Webinar | 2.88% | 0.026% | Visitor to lead, 0.9% |
| 1.82% | 0.040% | MQL to SQL, 30% | |
| PPC | 1.24% | 0.0087% | Visitor to lead, 0.7% |
Lead-to-closed-won lands between 1.2% and 3.7%, which brushes the “2% to 5% lead-to-customer” band quoted across the web. So the folklore is roughly right as an average and close to useless per channel: the spread inside it is threefold. Measured from the first website session, the spread widens to roughly nine to one, SEO at 0.077% against PPC at 0.0087%, because weak stages multiply instead of averaging out.
That compounding is the argument for reading conversion rate as a chain rather than a score. A five-point gain at one stage is worth more or less depending entirely on what sits downstream of it, which is the same reason a single headline marketing number tends to hide the stage that is actually costing you deals. It also explains why lead source is a legitimate scoring input: the gap here is wider than most teams’ entire scoring range, and the multiplier between a warm and a cold lead is measurable rather than folkloric.
Where one publisher’s own two reports disagree
First Page Sage publishes lead-to-MQL by channel twice, in two separate reports seven weeks apart, and the two do not agree. The B2B SaaS funnel matrix above was updated 11 June 2025. A wider report covering eleven channels at the lead-to-MQL boundary was updated 1 August 2025. Where they overlap, they diverge by as much as a factor of two.
| Channel | B2B SaaS funnel report, June 2025 | Eleven-channel report, Aug 2025 | Gap |
|---|---|---|---|
| SEO | 41% | 41% | None |
| 43% | 38% | 1.1x | |
| PPC | 36% | 29% | 1.2x |
| Social | 38% (LinkedIn) | 30% (social media) | 1.3x |
| Webinar | 44% | 19% | 2.3x |
Neither report is dishonest. They describe different populations: the funnel matrix covers B2B SaaS clients in the $10M to $100M revenue band, while the eleven-channel report draws on an agency book that is roughly 70% B2B with some large B2C ecommerce accounts included. Webinar leads behave very differently in those two groups, and SEO happens to behave identically.
The lesson is not that First Page Sage is unreliable. It is that a channel benchmark is a property of a population, not of a channel. If one publisher’s own two datasets move webinar lead-to-MQL from 44% to 19%, a figure lifted from either report and presented as “the B2B webinar conversion rate” has lost the only context that made it meaningful. The same pattern shows up one stage later at MQL to SQL, where the gap between the same publisher’s two figures is wider still.
The wider report also covers six channels the SaaS matrix omits, and they matter for B2B: client referrals convert to MQL at 56% and executive events at 54%, both well above every digital channel measured, while conferences reach 28%, trade shows 24%, podcasts 21% and outdoor advertising 14%. Referrals leading the table is consistent with the 2014 Implisit finding discussed below, which is the only other dataset to rank lead sources across the whole lifecycle.
The top of the funnel, isolated to B2B
For current top-of-funnel data the largest tracked dataset is Ruler Analytics’ 2026 benchmark study, published 26 May 2026, covering more than 110 million sessions and 5 million conversions across 13 industries, attributed multi-touch rather than last-click, and counting both form fills and inbound calls as conversions. Its headline average is 5.13%.
That average is not a B2B figure. It blends software and professional services with travel, retail and beauty. Isolating the four B2B-weighted verticals in the dataset, software, professional services, finance, and construction and engineering, produces the view below. The final column is Ruler’s published all-industry average, shown so the size of the distortion is visible.
| Channel (session to qualified lead or sale) | Software | Prof. services | Finance | Construction | B2B mean (IVRIS calculation) | All 13 industries, as published |
|---|---|---|---|---|---|---|
| Paid search | 8.2% | 6.7% | 6.3% | 5.1% | 6.6% | 5.4% |
| Organic search | 7.9% | 8.1% | 5.4% | 4.8% | 6.6% | 4.9% |
| AI referral | 7.9% | 6.0% | 5.6% | 6.3% | 6.5% | 5.8% |
| 4.0% | 3.1% | 7.1% | 7.1% | 5.3% | 4.9% | |
| Direct | 6.4% | 3.1% | 5.8% | 5.9% | 5.3% | 4.7% |
| Referral | 4.6% | 5.3% | 6.5% | 3.9% | 5.1% | 4.8% |
| Social paid | 1.7% | 1.1% | 3.7% | 1.8% | 2.1% | 2.1% |
| Social organic | 2.7% | 1.7% | 1.6% | 1.6% | 1.9% | 2.2% |
De-blending moves every channel except social upward, and it moves organic search most: 4.9% published, 6.6% across the B2B verticals. Social is the one channel that looks better in the blended figure than in the B2B cut, because consumer-facing education traffic is carrying the published social average. Paid search and organic search finish level at 6.6% on this measure, which is worth holding next to the compounded table above, where PPC ends up nine times weaker than SEO. A channel can convert sessions to leads well and still lose them all at qualification.
One row deserves attention because it did not exist in last year’s report. AI referral traffic, arriving from ChatGPT, Perplexity, Gemini and Claude, converts at 6.5% of sessions across the B2B verticals, ahead of email, direct and referral. Volumes are still modest, and the pattern is consistent with people who arrive having already had a specific question answered.
Worth being precise here, because published AI-referral figures vary more than any other channel. On Ruler’s tracked sessions, AI referral and organic search finish close to level across the B2B verticals, 6.5% against 6.6%. Other analyses report a much wider gap: a multi-source synthesis we covered earlier this year put AI search traffic at roughly five times the conversion rate of Google organic. Both can hold, because they are not the same measurement. One is a single platform’s tracked sessions to a qualified lead or sale across 13 industries; the other aggregates several studies with their own denominators and definitions of conversion. Until a like-for-like study exists, treat the direction as established and the multiple as unsettled.
The forms-and-calls gap that breaks channel comparisons
Ruler counts phone calls as conversions, and the split between forms and calls varies enough by sector to invalidate cross-industry comparison outright. Software conversions are 88.6% forms and 11.4% calls. Professional services are 47.4% forms and 52.6% calls. Averaged across the four B2B verticals, roughly 72% of conversions arrive by form.
The consequence is direct: a B2B firm measuring form submissions only is capturing about 72% of its conversions, and a professional services firm is capturing under half. That is not a modest reporting gap. It is large enough that an untracked call channel will read as a failing paid campaign, which is one of the ways an attribution model quietly decides which channels look like they work. Ruler’s figures are multi-touch attributed; most last-click reports on the same funnel will credit different channels entirely.
PRO TIP
Before comparing your rate with any published channel benchmark, check three things: whether calls count as conversions, whether attribution is multi-touch or last-click, and whether the sample is B2B-only. Any one of them mismatched makes the comparison meaningless.
Why the AI Overview publishes an MQL to SQL rate no source measured
Google’s AI Overview for this query lists traffic channel as a driver of conversion rate, then cites three sources, none of which reports conversion rate by channel at the stage it implies. Its cited pages are First Page Sage’s industry table and two aggregator blogs. The stage table it presents is assembled from pages that recycle figures rather than measure them, and at least two of its rows have drifted from their origins.
The audit below covers two overviews. The first five rows are the stage table returned for the broad B2B conversion rate query. The last four are the MQL to SQL figures examined earlier, shown here in the same frame because they reach the reader the same way: as a confident, unattributed summary with no denominator on any row.
| Figure shown | Presented as | What the source actually measured | Status |
|---|---|---|---|
| 2.3% | Visitor to lead average | Consistent with published visitor-to-lead ranges | Broadly sound |
| 31% | Lead to MQL average | Implisit’s website-sourced lead-to-opportunity rate was 31.3% | Likely a restaged figure |
| 15% – 21% | MQL to SQL average | The 13% root is lead-to-opportunity, 2014, attributed to Forrester in error | Wrong stage, wrong attribution |
| 22% – 30% | Opportunity to closed-won | No traceable primary source located; the traceable figure is 6% | Unverified |
| 1.1% B2B SaaS | Industry visitor-to-lead | Matches First Page Sage’s published industry table | Sound |
| 13% | MQL to SQL cross-industry median | The cited industry table publishes no median; its 30 rows give a median of 15% | A single row relabelled as a summary |
| 18% – 22% | MQL to SQL for B2B SaaS | Unsourced on every page carrying it; one of those pages publishes the same range as a B2C figure | Unverified |
| 35% – 40% | MQL to SQL for top performers | No located source publishes this range; it matches the upper bounds of two separate claims | Assembled, not measured |
| 39% – 40% | MQL to SQL with behavioural scoring | No primary source located and no control group, so the uplift has nothing to be measured against | Unverified |
The 31% row is the instructive one. Implisit’s 2014 study found that leads originating from the company website converted to opportunities at 31.3%, the highest of any channel it measured. That is one channel, one stage transition, from a study published before most current marketing stacks existed. Presented as a general lead-to-MQL average, it describes something that was never measured.
The industry ranking the overview publishes does not exist in its source
The overview names three leading industries and two laggards for MQL to SQL. Only one dataset measures MQL to SQL by industry, First Page Sage’s, and the overview cites it on the same panel. Set the five claims against that table’s 30 rows and three of them fail.
| Claim in the AI Overview | What the cited industry table publishes |
|---|---|
| “Consumer electronics leads at 21%” | There is no consumer electronics row. The industry is absent from all 30. |
| “FinTech at 19%” | Fintech is 11%, tied for the second-lowest value in the table |
| “automotive at 18%” | Automotive is 18%. Correct. |
| “Healthcare and oil & gas average 12% to 15%” | Both sit at exactly 13%, inside the 13% to 15% band the same panel calls the cross-industry average |
| Healthcare and oil & gas presented as the bottom | Seven industries publish lower: legal services and real estate at 10%, engineering, fintech and solar at 11%, construction and staffing at 12% |
The fintech row is the one to check for yourself, because the error is not a rounding drift. Fintech moves from 11% to 19%, and from the bottom of the range to second place on a leaderboard. Consumer electronics is worse: an industry with no row in the source is handed both a number and first position. The healthcare and oil and gas claim inverts the same way, presenting a joint-median value as the floor while seven lower industries go unmentioned. A reader in any of those verticals who benchmarks against this panel is comparing against a figure the underlying dataset does not contain.
The panel does not hold still either. On 2 August 2026 it returned “B2B SaaS averages 18-22%” alongside the 13% median. On 9 August 2026, for the same query, it returned “B2C models average 18% to 22%, while B2B models average 13% to 15%.” The band changed which business model it describes inside a week, which lines up with the Data-Mania page that publishes 18% to 22% as a B2C figure and 13% to 15% as the B2B one. The correction is real and worth crediting. It also means any B2B team that pasted the earlier rendering into a target is now working from a number the engine itself has quietly withdrawn.
None of this is an argument for ignoring AI Overviews. It is an argument for reading their citations. An answer engine summarising pages that recycle a twelve-year-old figure will reproduce the drift confidently, and the confident version is the one that gets pasted into board decks.
How to work out your own MQL to SQL conversion rate
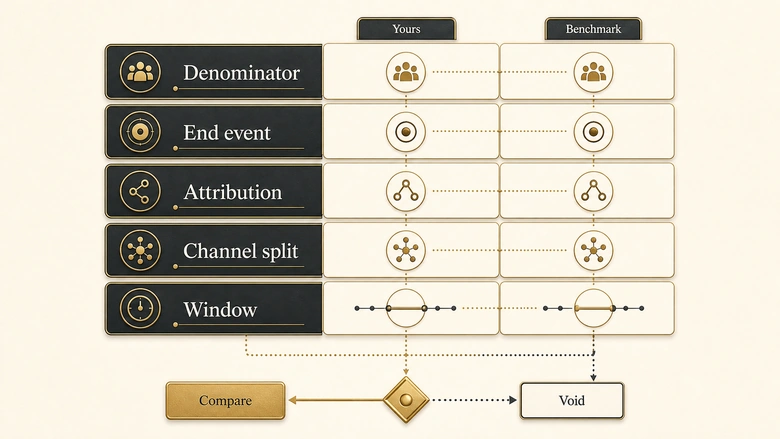
To work out your own MQL to SQL conversion rate and compare it with a published one, match five fields first: starting population, end point, attribution model, channel definition, and measurement window. If any one of them differs, the comparison tells you nothing about performance.
Workflow · 30 min
How to match an MQL to SQL benchmark to your own funnel
A five-field check that establishes whether a published conversion rate is comparable with yours before you act on the gap.
Write down your denominator as a record count
Pull the exact number of records in the starting population for one closed quarter. Sessions, unique visitors, form fills and de-duplicated leads give four different denominators from the same quarter.
Name the end-point event, not the stage label
Record the CRM event that marks conversion: opportunity created, contract sent, or closed-won. “Opportunity” alone is ambiguous enough to swing the result sixfold.
Check whether calls and offline conversions are counted
Confirm whether inbound calls are in your numerator. If they are not, and the benchmark counts them, your rate is understated by roughly 28% on B2B averages.
Match the attribution model
Establish whether the benchmark is last-click or multi-touch, then run your own number the same way. Switching models reorders channels without changing a single deal.
Align the measurement window to your sales cycle
Use a cohort window at least as long as your lead-to-close time. Lead-to-opportunity averaged 84 days in the Implisit data, so a 30-day window counts deals that have not had time to convert.
Compare stage by stage, then fix the weakest link
Set your per-stage rates against the channel table above and find the largest single gap. Because stages compound, the weakest transition is where a fix pays most.
Place your own MQL to SQL rate in the right band
The five-field check tells you whether a benchmark is comparable. This step tells you which one to compare against. Declare your own definitions first, then read across to the band whose source used the same ones. Doing it in that order is what stops a definitional difference being read as a performance gap.
| Your MQL and SQL definitions | The band that applies | Source and year | What a gap against it means |
|---|---|---|---|
| MQL is an intent signal plus an affordability check; SQL is vetted by a salesperson with a meeting booked; you can split by channel | 26% – 51%, by channel | First Page Sage funnel matrix, June 2025 | Compare against your own channel’s column, never against the range |
| The same definitions, but you cannot split by acquisition channel | 10% – 26% by industry, B2B SaaS at 13% | First Page Sage industry report, 2019–2025 | A blended rate carries your channel mix, so a gap may be a mix difference rather than a qualification one |
| MQL is any lead entering the CRM; SQL is an opportunity record created | 13%, over an average of 84 days | Implisit via Salesforce, Nov 2014 | This is lead-to-opportunity. Report it under that name, and note that it is twelve years old |
| MQL is a bottom-funnel trigger such as a demo or pricing request | No public band exists | None located | Measure your own baseline across one full sales cycle before comparing against anything |
| Your MQL definition changed inside the measurement window | No band applies | Not applicable | The rate moved for a definitional reason. Rebaseline before reading it as performance |
Once the band is settled, the worksheet below produces the number that goes next to it. The three declarations at the top decide the answer more than the two counts at the bottom do. Getting them stable over time is largely a question of which stage transitions fire automatically and which a rep sets by hand, which is the part of deciding what in a pipeline should be automated that shows up in reporting rather than in productivity.
| Declaration | Your entry | Why it changes the band |
|---|---|---|
| 1. MQL definition: the exact trigger that creates one | A score threshold and a demo request produce denominators that differ by an order of magnitude | |
| 2. SQL definition: the exact CRM event | “Accepted by sales” and “meeting held” are two different numerators | |
| 3. Recycled and re-engaged leads: counted once, counted twice, or excluded | Counting a returning lead twice inflates the denominator and depresses the rate without anything changing | |
| 4. Cohort window, in days | Must be at least as long as your MQL-to-SQL lag, or you count leads that have not had time to convert | |
| 5. Channel split available: yes or no | Without it you can only compare against a blended figure, and the blend is your own | |
| 6. Your denominator: MQL record count | De-duplicate first. The same person arriving twice is one lead under most definitions and two records in most CRMs | |
| 7. Your numerator: SQL record count | Count records that reached the SQL event inside the cohort window, not every SQL created in the period | |
| 8. Your rate: row 7 divided by row 6, times 100 | Read it against the band your first three declarations selected, not against a headline number |
IMPORTANT
If any of declarations 1 to 3 differs from the band’s source, the comparison is void. A rate built on a different denominator is not a worse or better version of the benchmark. It is a different measurement, and the difference between them tells you nothing about how well you qualify leads.
Two operational causes account for a large share of the gaps this exercise surfaces, and neither is a marketing problem. Slow follow-up is the first: response time collapses qualification rates well before lead quality becomes the explanation, which is why the minutes between form submission and first contact move conversion more than most campaign changes. Misrouting is the second, and it is close to invisible in reporting, since a lead assigned to the wrong owner still looks like a worked lead in the funnel report.
Where the public record runs out
No single public dataset reports B2B conversion rate by stage and channel jointly with an audited sample, so any full stage-by-channel matrix presented as an industry benchmark is an interpolation. Three partial datasets exist, and they cannot be chained together.
- Stage by channel, B2B SaaS only. First Page Sage covers five channels across five transitions, from one agency’s 50-plus clients. Well documented, narrow population, no disclosed sample size per cell. Its companion reports widen the coverage but disagree with the matrix where they overlap: one at the lead-to-MQL boundary across eleven channels, and one at MQL to SQL across thirty industries, where B2B SaaS is reported at 13% against the matrix’s 26% to 51%.
- Channel only, top of funnel, current. Ruler Analytics covers eight channels at session-to-lead with a very large tracked sample, but stops at the first conversion and mixes B2B with B2C.
- Stage by channel, all B2B, obsolete. Implisit covers lead to opportunity to deal across six lead sources from hundreds of companies. It is the broadest population available and it is from 2014.
Chaining across them is invalid. Ruler’s session-to-lead denominator is not First Page Sage’s visitor-to-lead denominator, and Implisit’s opportunity is not First Page Sage’s opportunity. Multiplying a 2026 top-of-funnel rate by a 2014 mid-funnel rate produces a number with no referent, which is how several of the composite “full funnel benchmark” tables in circulation were built.
Two figures in wide circulation have no record to run out of. The consumer electronics MQL to SQL rate of 21% has no row in the only table that measures this transition by industry, so there is nothing to verify it against and nothing to correct when that dataset next updates. The 13% Kixie publishes as the cross-industry average is the second case: it is credited to “data from Salesforce” and linked to the same deleted Salesforce URL, with Implisit unnamed, no year attached, and Marketing Insider Group cited for channel variation that carries no figures. The measurement still exists in an archive. The chain of citation that reaches the reader no longer points at it.
What is genuinely missing is a current, cross-industry, stage-by-channel study with a disclosed sample outside SaaS. Nobody has refreshed the Implisit work in twelve years, and its deletion from the Salesforce blog means the most-cited figures in B2B funnel measurement now rest on an archive snapshot. Until someone repeats it, non-SaaS B2B teams comparing mid-funnel rates by channel are working from an estimate, and should say so when they report it. The gap is structural rather than a tooling failure, which is why no amount of dashboard work closes it.
Methodology, sources and revision history
IVRIS did not conduct primary research for this page. Every figure is drawn from a named third-party source, and the four calculations labelled as ours are arithmetic performed on published figures, shown so they can be reproduced or disputed.
Inclusion rules
A figure was included only if the publisher named the population it measured and the transition it covered, and if the source page was readable at the time of writing. Figures presented without any source on the publishing page were recorded in the ledger as not quotable rather than repeated as fact. Where a figure’s attribution could not be verified, the failure is stated rather than resolved silently.
The IVRIS calculations
Four calculations are ours. Lead-to-closed-won and visitor-to-closed-won by channel are the product of First Page Sage’s published stage rates within each channel column, chained inside a single source so stage definitions stay constant. The B2B channel mean is the unweighted arithmetic mean of Ruler Analytics’ published rates for software, professional services, finance, and construction and engineering. Unweighted means each vertical counts equally regardless of its session volume, which Ruler does not publish per industry.
The third is the summary of First Page Sage’s MQL to SQL industry table. We transcribed all 30 published industry rows and computed the median at 15% and the unweighted arithmetic mean at 16.1%, across a range of 10% to 26%. First Page Sage publishes no summary statistic for that table, so the 13% widely reported as a cross-industry median is not a figure that report contains. Each industry counts once in our calculation regardless of how many clients sit behind it, because per-industry sample sizes are not published. Anyone can reproduce this from the source table.
The fourth is the form-versus-call share. Ruler Analytics publishes the split per vertical; we took the unweighted arithmetic mean of the four B2B verticals in that report, which gives roughly 72% of conversions arriving by form. Unweighted again means each vertical counts equally regardless of session volume.
Limitations
First Page Sage’s matrix is one agency’s client base, weighted to $10M–$100M revenue SaaS, with no per-cell sample size. Ruler’s sample is large but blends B2B and B2C and measures a session-based denominator. Implisit’s data is from 2014 and its primary publication has been removed. None of the three is a probability sample of B2B companies, so every figure here is directional.
The compounded rates carry one further caveat that applies to any chained funnel calculation. Each published stage rate is itself an average across accounts, and multiplying four averages does not give the average of the compounded journey: an account that converts above average at one stage may convert below it at the next, and that covariance is invisible in published summary rates. The compounded figures are therefore best read as a comparison between channels measured the same way, not as a forecast of what any single company will see end to end.
Revision history and citation
Version 1.2, 9 August 2026. Adds the Geckoboard clause as the traceable origin of the lead-source relabelling, the Optifai benchmark as the only figure on this query with a declared sample and collection window, an audit of the AI Overview’s industry ranking against the table it cites, and the record of that panel moving its 18% to 22% band from B2B to B2C between 2 and 9 August 2026. Version 1.1, 2 August 2026. Adds the MQL to SQL claim audit, the recomputed industry median, and the band-placement worksheet. Version 1.0 was prepared 30 July 2026 and never published; this page goes live at version 1.2. Ruler Analytics data from the 2026 report published 26 May 2026; First Page Sage funnel matrix last updated 11 June 2025, conversion-rates-by-industry table 18 September 2025, and MQL to SQL by industry report published 3 October 2024 and last updated 23 December 2025; Implisit data published 20 November 2014 and read via archive snapshot. The four newer MQL to SQL claims were traced against their publishing pages on 2 August 2026, and the Geckoboard, Optifai and Kixie pages on 9 August 2026.
Suggested citation: IVRIS, MQL to SQL Conversion Rate Benchmarks by Channel, version 1.2, 9 August 2026. Every figure on this page carries its source, date and population in the tables above, so any of them can be traced or recalculated from the original reports.
DOWNLOAD THE WORKSHEET
Place your own funnel in the right band instead of comparing against a number built on someone else’s definitions: IVRIS B2B Conversion Benchmark Worksheet v1.1 (XLSX) — and the full source ledger as CSV. Free, ungated, reuse permitted with attribution.
Suggested citation: IVRIS Tech. “B2B Lead Conversion Rate Benchmarks: Source Ledger and Band-Placement Worksheet.” ivristech.com, 2026. https://ivristech.com/b2b-lead-conversion-rate-benchmarks/
Frequently Asked Questions
It depends entirely on the stage measured. For B2B SaaS, website visitors become leads at 0.7% to 2.2% by channel, and leads reach closed-won at 1.2% to 3.7%. A rate is only good or bad relative to a benchmark using the same starting population, end point and attribution model as yours.
Email sessions convert to a qualified lead or sale at 4.9% across industries and 5.3% across B2B verticals, per Ruler Analytics’ 2026 data. Further down the funnel, email-sourced leads reach closed-won at about 3.0% for B2B SaaS, second only to SEO among the five channels measured.
Divide the MQLs that reached your SQL event by the MQLs in the starting cohort, then multiply by 100. The arithmetic is trivial; the discipline is fixing both definitions first and deciding whether a recycled lead is counted once or twice. Use a cohort window at least as long as your MQL-to-SQL lag.
One published industry table exists, First Page Sage’s, covering 30 industries from 2019 to 2025. It runs from 10% for legal services and real estate to 26% for business insurance and HVAC, with a median of 15%. Check your own vertical against it rather than a cross-industry average.
No. Two different 13% figures circulate. One is lead-to-opportunity from Implisit in 2014, often misattributed to Forrester. The other is First Page Sage’s B2B SaaS industry row. That same publisher’s channel matrix puts MQL to SQL at 26% to 51%, and does not reconcile the two.





