Ask four systems where your last big deal came from and you will get four answers. Google Analytics says paid search. The CRM’s original-source field says organic. The ads platform claims it outright. Sales says they sourced it themselves at a conference. Nobody is lying. That is what makes B2B attribution so maddening: every one of those answers is defensible, and not one of them is the whole story.
Most guides answer this by telling you your tracking is broken, then selling you a platform. We decided to test that claim rather than repeat it. In June 2026 we submitted real leads through 20 B2B demo forms and read the actual submission payloads by hand. Seventeen of the twenty carried the campaign data straight through. The tracking mostly worked. What failed was everything downstream of it.
This guide covers what B2B marketing attribution is, why it is structurally harder than the consumer version, the six models you will be asked to choose between, and what one real deal looks like under each of them. It is the methodology umbrella for our attribution work. Where a topic deserves its own page, we point you to it rather than cram it in here.
Direct answer — What is B2B marketing attribution?
B2B marketing attribution is the practice of assigning revenue credit to the marketing and sales touches that contributed to a closed deal. It differs from B2C attribution because a B2B purchase is made by a buying group of around ten people over roughly ten months, so credit is assigned at the account level rather than the lead level. Attribution measures contribution, not causation. It reports which touches were present before a deal closed, not which ones changed the outcome.
Key Takeaways
- B2B attribution spreads revenue credit across a buying group of about 10 people over a 10-month cycle, not across one person’s clicks.
- Your capture layer is probably fine. We hand-checked 20 B2B demo forms and 17 captured the campaign data. An automated scanner found only 8 of those 17.
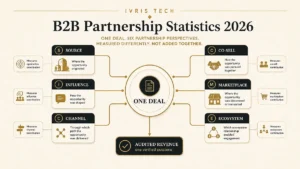
- Six models, one deal, six different answers. The same $60,000 lands on organic social, on a review site, or spread six ways, depending purely on which model you picked.
- W-shaped splits credit 30/30/30/10 across first touch, lead creation and opportunity creation. Two of the three sources we checked describe it wrongly.
- Set the lookback window to your real sales cycle. A 90-day window on a 10-month cycle silently deletes most of the journey.
- Attribution tells you what was present, not what worked. Treat it as a budgeting input, not a verdict.
What is B2B marketing attribution?
B2B marketing attribution is the practice of connecting marketing and sales touches to the revenue they helped produce. It answers a budgeting question rather than a philosophical one: given a closed deal, which activities were involved, and how much of the credit should each one carry? The output is a number against a channel, and that number decides where next quarter’s money goes.
The word “attribution” oversells what the method can do. An attribution model does not discover which touch caused a purchase. It applies a rule you chose in advance to a list of touches you managed to record. Change the rule and the answer changes, even though the deal did not. Hold onto that idea, because most attribution arguments are really disagreements about the rule, disguised as disagreements about the data.
Sourced pipeline versus influenced pipeline
Two numbers get called “attribution” and they are not the same thing. Sourced pipeline credits marketing with creating the opportunity: the deal exists because of a marketing touch. Influenced pipeline credits marketing with touching an opportunity at any point, however briefly. Sourced is a small, defensible number. Influenced is a large, elastic one.
Sales tends to quote the sourced figure and marketing tends to quote the influenced figure, which is how two teams look at one pipeline and disagree about who built it. Report both, label them, and never let one stand in for the other in a board deck. This is the same discipline that keeps the rest of your B2B marketing metrics honest: a metric without its definition attached is a rhetorical device, not a measurement.
Why attribution belongs at the account, not the lead
Lead-level attribution asks which touches preceded a form fill. Account-level attribution asks which touches preceded a purchase. In B2B those are different questions, because the person who filled the form is rarely the person who signed.
A VP reads a post. A director downloads the report. An analyst attends the webinar. A CFO joins the pricing call. Lead-level attribution sees four unrelated people and, at best, credits whichever one converted. Account-level attribution rolls all four into one account and treats the deal as what it actually was: a group decision. Getting this rollup right is most of the work, and it is the specific subject of account-based marketing attribution.
Why B2B attribution is harder than B2C
B2B attribution is harder than consumer attribution because the unit being measured is a committee rather than a person, and the timeline is measured in quarters rather than sessions. Every structural feature of a B2B purchase works against the assumptions consumer analytics was built on.
The deal has ten buyers, not one
6sense surveyed nearly 4,000 B2B buyers for its 2025 Buyer Experience Report and found the typical buying group runs to around ten members, each averaging 16 interactions with the eventual winner. Multiply that out and a single won deal can involve roughly 160 interactions with your brand, spread across ten people who each hold a different piece of the decision.
Now count the touches in your CRM for a typical closed-won deal. Six? Nine? The gap between 160 and 9 is not a tracking bug. Most of those interactions were never addressable in the first place: a forwarded PDF, a Slack thread, a hallway conversation at a conference. Attribution operates on the fraction that left a record, which is why measuring the account rather than the contact matters so much, and why account-based marketing metrics exist as a separate discipline.
The cycle outruns your tracking window
The same 6sense research puts the average B2B cycle at 10.1 months, down from 11.3 months the year before. A cycle that long breaks tracking in mundane ways. Cookies expire. People change laptops, change jobs, change email addresses. A first touch in January and a close in November are joined by nothing durable unless you deliberately built the join yourself.
This is where most attribution quietly fails, and it fails silently. Nothing errors. The report still renders. It just describes a shorter, tidier journey than the one that happened.
Most of the decision happens before you are in the room
The 6sense data puts the point of first contact at 61% of the way through the journey, meaning roughly three-fifths of the buying process is complete before a vendor is engaged at all. That figure moved from 69% to 61%, so buyers are reaching out slightly earlier than they used to, but the shape holds: the majority of the decision is made in places you cannot instrument.
This is the dark funnel, and it is not a metaphor for laziness. It is the review sites, the peer Slacks, the podcast, the LinkedIn comment thread, the former colleague who says “we use this, it’s fine.” None of it produces a UTM. Some of it can be inferred through B2B intent data, which watches for research behaviour before a prospect identifies themselves, and some of it simply cannot be recovered. An attribution model that reports 100% of credit assigned is not being thorough. It is being confident about a fraction of the evidence.
The 95:5 rule and what it does to your measurement
Professor John Dawes of the Ehrenberg-Bass Institute framed the 95:5 rule: only about 5% of your target customers are actively looking to buy at any given time, and the other 95% are not yet ready. The strategic reading is well known, which is that brand-building pays off later among the 95%.
The measurement reading gets less attention and matters more here. Attribution can only see the 5% who bought. Every model in this guide is fitted exclusively to closed deals, so it is structurally blind to the work that moved someone from “never heard of you” to “in market” eighteen months later. When a model tells you brand spend produced nothing, check whether the model was capable of seeing brand spend at all. Usually it was not. How touches map to stages across that long arc is the subject of customer journey attribution.
Why your attribution numbers are usually wrong
Your attribution numbers are usually wrong, but rarely for the reason you have been told. The industry consensus is that B2B tracking is fundamentally broken at the point of capture, and that the fix is a platform. We tested the first half of that claim and found it mostly false.
What we found when we hand-checked 20 B2B demo forms
In June 2026 we ran an automated, read-only audit of 150 public B2B demo, contact and signup forms. The scanner reported that 29% captured campaign data into a form field. That number matches the industry story neatly, and it is the kind of figure that sells software.
So we checked it by hand. We took a stratified subsample, submitted one real test lead per form from a dedicated address on our own domain, and read the actual submission POST body looking for our sentinel values. Twenty forms gave a definitive answer. Seventeen of them carried the campaign data into the submitted lead. Three genuinely lost it. The full B2B form attribution capture study publishes the protocol, the per-vendor results and the limitations.
The interesting part is the scanner’s error profile. Of the 17 forms that really captured, the scanner had flagged only 8. It never once cried wolf: every form it called a success was a genuine success, giving it perfect precision of 8 out of 8. But it caught fewer than half of the real captures, a recall of 47%. It was not noisy. It was blind, and blind in one direction only.
The reason is mechanical. Of the 17 that captured, 13 used hidden form fields, 3 injected the value with JavaScript at the moment of submit, and 1 forwarded it from a first-party cookie after the visible URL had already gone clean. A read-only scanner inspects the page. It cannot see what the page assembles at submit time, so it systematically under-reports the thing it was built to measure.
IMPORTANT
Twenty hand-checks establish direction, not a population rate, and the subsample was deliberately weighted toward suspected false negatives. We are not claiming 85% of all B2B forms capture correctly. We are claiming that automated form audits undercount real capture, and that you should verify your own payload before you accept a scanner’s verdict about it.
The failure is downstream of capture
If capture mostly works, the wrongness has to live somewhere else. It lives in four places, none of which a platform purchase fixes on its own.
- Stitching. The data arrived, then failed to join. Four people from one account land as four unrelated leads because nothing resolved them to the same company.
- Window. The touch was recorded, then aged out of a lookback window shorter than the sales cycle.
- Rollup. The model ran at contact level, so it answered a question about a form fill and you read it as an answer about a purchase.
- Absence. The decisive moment never produced a record at all, and the model quietly redistributed its credit to whatever did.
That last one deserves emphasis, because it is the failure mode with no error message. A model never reports “30% of this journey is missing.” It normalises to 100% across what it has and hands you a clean pie chart. The confidence is an artefact of the arithmetic, not evidence about the deal.
The limit no model can cross
There is a deeper problem underneath all of this, and it is worth naming plainly because the rest of the industry tends not to. Attribution cannot measure causation. It measures correlation with a rule bolted on top. That distinction matters when a 3.8× sales-velocity association for partnership-sourced opportunities is reported: it does not prove the partner caused the result.
Every model in this guide answers the question “which touches were present before this deal closed?” None of them answers “would this deal have closed anyway?” Those are different questions, and only the second one tells you whether the spend was worth it. A buyer who was always going to purchase still clicks your retargeting ad on the way to the demo, and last-touch will hand that ad the entire contract. The ad did not cause anything. It was present at the scene. That mismatch has a general form worth naming, because a check narrower than the claim it is used to support reports success either way, and a model that can only see presence keeps answering the presence question however the report is titled.
The method that does test causation is incrementality: hold a comparable group out, run the channel at the rest, and measure the difference. It is harder, slower, and it needs volume. It is also the only way to learn whether a channel creates demand or merely intercepts demand you had already earned. Brand-heavy and retargeting channels are the two where attribution and incrementality most often disagree, and when they disagree, incrementality is the one with a control group. Google’s September 10 measurement release makes that evidence split concrete: Data Strength Uplift is a recovery metric, while Meridian GeoX is built for causal geo experiments.
None of this means attribution is useless. It means attribution is a budgeting input rather than a verdict. Use it to see where your recorded journeys concentrate, then test the expensive conclusions before you act on them.
The six B2B attribution models, compared
An attribution model is a rule for dividing one deal’s revenue across the touches that preceded it. The six below cover essentially every model you will be offered. Read the last column first: every model is wrong in a specific, predictable direction, and picking one means choosing which error you can live with.
| Model | How it splits credit | Use it when | Where it misleads you |
|---|---|---|---|
| First-touch | 100% to the first recorded touch | You are measuring demand creation | Ignores everything that closed the deal |
| Last-touch | 100% to the final touch before conversion | Short cycles, one decision-maker | Credits the door, not the journey to it |
| Linear | Equal share to every recorded touch | You want a baseline with no thesis | Rates a footer click equal to a demo |
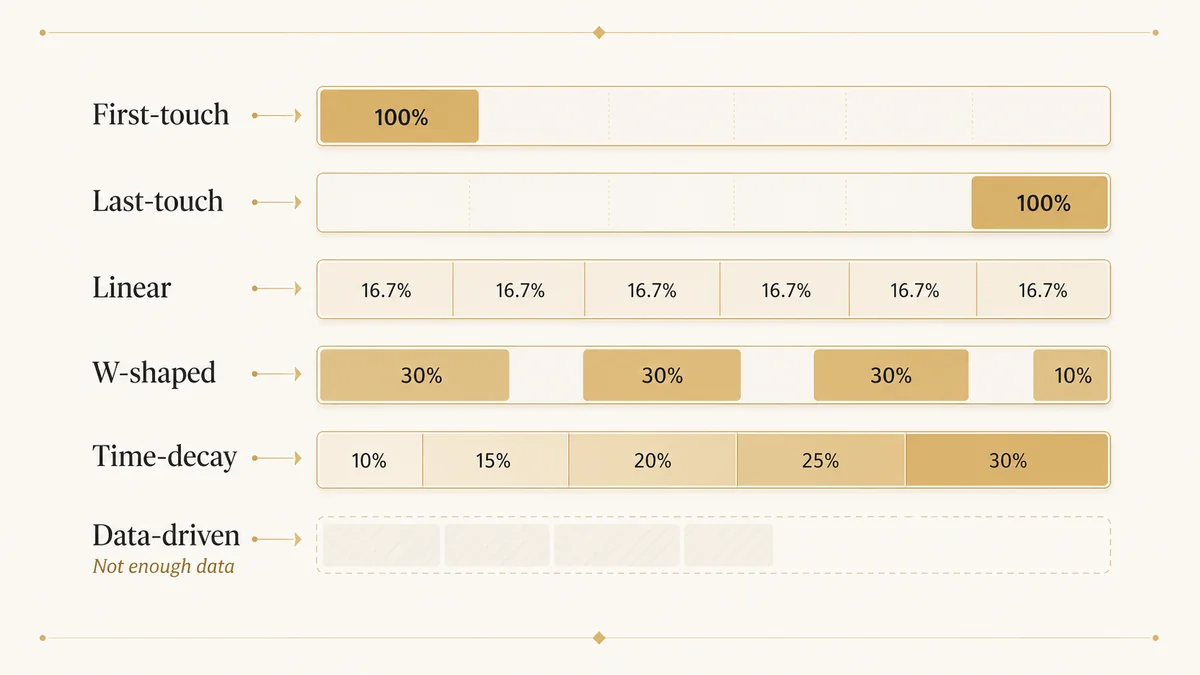
| W-shaped | 30% each to first touch, lead creation and opportunity creation; 10% spread across touches between them | You have a real funnel with defined stages | Credits nothing after opportunity creation |
| Time-decay | All touches count, weighted toward the close | Cycles where recency genuinely matters | Half-life shorter than the cycle equals last-touch in disguise |
| Data-driven | Weights learned statistically from past deals | You have hundreds of closed deals | Learns from tracked touches only, so it inherits every blind spot |
Single-touch: first-touch and last-touch
The two single-touch models give 100% of the credit to one interaction and nothing to the rest. First-touch credits the interaction that began the relationship; last-touch credits the one immediately before conversion. Their appeal is that they are unarguable: there is no weighting to debate.
Their weakness is that they are unarguable about the wrong thing. On a ten-month, ten-person deal, first-touch tells you what started a journey it then ignores, and last-touch tells you which channel was standing nearest the finish line. Both are useful as diagnostics and dangerous as budget instruments.
Multi-touch: linear, W-shaped and time-decay
Multi-touch models share one premise: every recorded touch gets some credit, and the argument is only about the weighting. That premise is closer to how B2B deals actually happen, which is why these three dominate serious B2B setups. They also introduce a new failure mode, because a weighting rule looks like a finding once it has been through a spreadsheet.
Linear
Linear divides revenue equally across every recorded touch. It has one real virtue, which is that it makes no claim it cannot support: it does not pretend to know which touch mattered, so it treats them alike. It is the right default when you have no evidence for a weighting and would rather admit that than invent one.
It also produces obvious nonsense. A buyer who bounced off your pricing footer counts exactly as much as the buyer who sat through a 45-minute demo. Linear does not overvalue minor interactions by accident. It does so by design, because the design refuses to rank them.
W-shaped, and the split most sources get wrong
W-shaped assigns 30% of the credit to each of three milestones and spreads the remaining 10% across the touches in between. The three milestones are first touch, lead creation and opportunity creation. Those three peaks are what give the model its name.
This is worth stating carefully, because the sources disagree and most of them are wrong. Google’s AI Overview for this topic describes W-shaped as first touch, last touch and lead creation. ZoomInfo’s guide describes it as first and last touch plus opportunity creation. Both are incorrect, and they are incorrect in different ways. The model originated in Bizible, now Adobe Marketo Measure, whose own documentation is unambiguous: “the FT, LC, and OC touchpoints are each attributed 30% of the attribution credit,” with the remaining 10% going proportionally to intermediary touchpoints between them.
The distinction is not pedantry, and you can see why in the worked example below. Because W-shaped stops at opportunity creation, it awards nothing at all to touches after that point. Under W-shaped, the last conversation before a deal closes is worth zero. Under last-touch, the same conversation is worth the entire deal. Same touch, same deal, two models, and a swing of the full contract value. Every one of these models leans on the opportunity being a modelled entity in its own right, so treating the opportunity as a distinct identity rather than a CRM field decides how much of this arithmetic you can defend upstream of the model choice.
Time-decay
Time-decay credits every recorded touch but weights them toward the close, usually with a half-life: a touch one half-life before the close is worth half as much as a touch at the close. The logic is that recent interactions are better evidence of intent.
The trap is the half-life setting, which most teams never touch. Many tools ship with a 7-day or 30-day default inherited from ecommerce. Run a 30-day half-life across a 10-month cycle and the first touch is worth roughly one two-hundred-and-fiftieth of the last one. You have not implemented time-decay. You have implemented last-touch with extra arithmetic, and the report will not tell you.
Data-driven
Data-driven attribution uses machine learning over your historical deals to work out which touch patterns actually correlate with closing, then assigns fractional credit accordingly. It is the only model on the list that derives its weights from your data instead of from someone’s opinion, and with enough volume it is the most defensible choice available.
It carries two conditions people skip. It needs hundreds of closed deals before its weights mean anything, which rules it out for most companies below a few hundred deals a year. And it learns exclusively from touches that were recorded, so it inherits every blind spot in your capture and then launders them through a model whose output looks objective. A confident number from a biased sample is still biased. Several platforms automate this well, and we compare them in our guide to the best B2B attribution software.
Which model should you actually use?
Pick the model that matches your deal volume and your funnel definitions, not the one with the most sophisticated name. The decision comes down to four questions, in this order.
- Do you close fewer than about 100 deals a year? Use linear, and spend the saved effort on customer interviews. Below that volume no model has enough signal to earn a stronger claim.
- Do you have defined, consistently used lead and opportunity stages? If yes, use W-shaped. It is the best fit for a real B2B funnel because it credits the two moments your CRM already treats as meaningful. If your stages are aspirational rather than enforced, W-shaped will produce precise numbers about a fiction.
- Do you close several hundred deals a year with clean, joined data? Use data-driven, and re-validate it against closed-won revenue every quarter.
- Is your cycle under 30 days with a single decision-maker? Then you are not really doing B2B attribution, and last-touch is defensible.
Two rules sit on top of all four. Run a second model alongside your primary one, because the disagreement between them is more informative than either number alone: when first-touch and last-touch name the same channel, that channel is doing real work. And whichever you pick, report it at account level with a window that covers your cycle. Those two choices move the answer more than the model does.
One deal, six models, six different answers
Here is what all of that costs you in practice. One closed-won deal, $60,000, nine months from first touch to signature, four people from the buying group leaving a trace.
Before the table, an admission that matters. Seven touches is a teaching fiction. A real deal of this size involves something closer to 160 interactions across ten people, per the 6sense figures above. Seven is what a tidy CRM records. The gap between those two numbers is the actual subject of this article.
| Month | Touch | Who | Milestone |
|---|---|---|---|
| 1 | LinkedIn post, organic social | VP Marketing | First touch |
| 2 | Blog article, organic search | VP Marketing | — |
| 3 | Benchmark report, paid search | RevOps Director | Lead creation |
| 4 | Webinar | Analyst | — |
| 5 | G2 category page | VP and Director | Never recorded |
| 6 | Demo request, direct | RevOps Director | Opportunity creation |
| 8 | Pricing call after review-site referral | CFO | Last touch |
Six touches were recorded. The month-5 visit to a comparison page, where two members of the buying group sat and read about you next to your three closest competitors, produced no record at all. Every model below divides the deal across six touches, because six is all any of them can see.
How each model splits the same $60,000
| Model | Where the $60,000 lands | The story it tells your CFO |
|---|---|---|
| First-touch | $60,000 to the LinkedIn post | “Organic social drives our pipeline” |
| Last-touch | $60,000 to the review-site referral | “Review sites drive our pipeline” |
| Linear | $10,000 to each of the six touches | “Everything contributed equally” |
| W-shaped | $18,000 each to LinkedIn, the report and the demo; $3,000 each to the blog and webinar; $0 to the pricing call | “Three moments made this deal” |
| Time-decay, 90-day half-life | $21,400 to the pricing call, $13,600 to the demo, down to $4,300 for LinkedIn | “The closing sequence did the work” |
| Data-driven | No answer from one deal | “Come back with 200 more deals” |
Read the LinkedIn post’s row down the table: $60,000, then $0, then $10,000, then $18,000, then $4,300. Nothing about the deal changed. Only the rule changed. Anyone who tells you their model reveals what really drove your revenue is describing the rule they picked, not the deal you closed.
The pricing call is the sharpest case. Last-touch says it was worth the entire $60,000. W-shaped says it was worth nothing, because it happened after opportunity creation and W-shaped stops there. Both models are working exactly as designed.
The touch no model can see
Now put the month-5 G2 visit back. Two of the four people who decided this purchase spent time on a page that compared you directly against three competitors, late enough to matter and early enough to shape the shortlist. It is entirely plausible that this was the moment the deal became winnable.
Every model above assigned that moment $0, and not one of them flagged it. They did not know it happened. They normalised to 100% across the six touches they had and produced a confident split of a deal whose decisive moment was never in the dataset. That is the honest summary of B2B attribution: it is a rule applied to a partial record, and the partial record is the part nobody puts in the report. Stitching the recorded touches into one connected path is the job of customer journey analytics, and it is necessary work, but it cannot recover what was never written down.
Lookback windows and how to set them
A lookback window is the period before a close in which a touch is still eligible for credit. Touches older than the window are discarded. This single setting distorts more B2B attribution reports than every modelling choice combined, and almost nobody revisits the default.
Match the window to your real cycle
The rule is simple: the window must cover your actual sales cycle, measured from your own closed-won data rather than from a benchmark. If your median cycle is 10 months, a 90-day window makes roughly the first seven months of every journey invisible. Your first touch, your lead creation touch and most of your brand work fall outside it. What survives is the bottom of the funnel, so the report concludes that the bottom of the funnel is what works.
That conclusion is circular, and it is self-reinforcing. Budget moves to bottom-funnel channels, top-funnel spend falls, pipeline weakens two quarters later, and the attribution report never once mentions the window that caused it.
PRO TIP
Pull the actual distribution of first-touch-to-close durations from your closed-won deals and set the window at roughly the 90th percentile, not the median. A window at the median throws away half your deals’ opening touches by construction.
What a balanced window costs
Longer windows are not free. Widen far enough and every touch qualifies for every deal, brand campaigns start collecting credit for accounts that were already buying, and the model loses its ability to discriminate. The honest position is that the window is a judgement call with a defensible range, that both ends of the range are wrong in known directions, and that the number should be written down with its reasoning rather than inherited from a vendor default.
How to operationalise B2B attribution
Operationalising attribution means fixing the layers in the order they actually break: capture, then join, then model, then interpretation. Most teams start at the model, which is the third-most-important layer and the only one a vendor can sell you.
Fix the capture layer first, then verify it yourself
Capture is cheap to fix and cheap to check, which is why it is worth doing before anything expensive. The failures are boring and mechanical. Campaign parameters get dropped by a redirect. A form posts only its visible fields. Hidden fields exist but arrive empty. Our own study found all three of those in the wild, and it also found that the automated tools built to detect them miss more than half of what is really there.
So verify the payload rather than the page. Submit a real lead through your own form with a tagged URL and read what actually arrives in the CRM. If you run HubSpot, the usual culprit is hidden fields not receiving UTM data, which fails silently and looks exactly like a form that works. And most link-level breakage is preventable before launch: QA your UTM links before launch and a large share of attribution debt never gets created.
Ask the buyer, because the model cannot
Since roughly three-fifths of the decision happens before you are contacted, and the dark funnel leaves no record, the cheapest instrument available is a question. A “how did you hear about us?” field on your demo form captures, in the buyer’s own words, the thing no model can reconstruct.
It is imperfect. People misremember, and they name the last thing they can recall rather than the first thing that mattered. Use it as a counterweight rather than a replacement: when self-reported attribution keeps naming a podcast that your multi-touch model scores at zero, the model is not necessarily right. Our form audit found that only about 15% of the 150 sites asked the question at all, and among martech sellers specifically, 78% did not ask. The tools industry is measuring itself with instruments it declines to use. How much of that imperfection is unavoidable is partly a design question, and there are five decisions that decide whether the answers are usable: whether you ask for the first touch or the most recent, whether the field is required, and whether you code the responses before or after you start collecting them.
When not to invest in attribution
Attribution has a floor below which it is theatre. If you close 20 deals a year, no model has enough signal to say anything statistically meaningful, and the effort is better spent talking to the 20 customers directly. If you run one channel, attribution can only tell you that channel did it. If nobody will change a budget on the basis of the answer, the report is decoration.
Build attribution when you have enough deals for patterns to emerge, more than one channel to compare, and a decision waiting on the answer. Before that, ask your customers. It is faster, cheaper, and the sample is the same size.
Frequently Asked Questions
The 95:5 rule, from Professor John Dawes at the Ehrenberg-Bass Institute, holds that only about 5% of your target customers are actively in the market at any given time, while 95% are not yet ready to buy. For attribution it means your models only ever see the 5% who bought.
Take a $60,000 deal with six recorded touches. First-touch gives all $60,000 to the opening LinkedIn post. Last-touch gives all of it to the final review-site referral. Linear gives $10,000 to each touch. W-shaped gives $18,000 each to three milestones. Same deal, four different answers.
B2B marketing is usually split into producers, resellers, governments and institutions, describing the four buyer types a business can sell to. It is a segmentation model, not an attribution one. Attribution cuts across all four, because each still buys through a committee over a long cycle.
The rule of 7 is an old advertising heuristic claiming a buyer needs roughly seven exposures before acting. It is folklore rather than research, and B2B data undercuts it: 6sense records about 16 interactions per person with the winning vendor, across a group of around ten people.
Long enough to cover your real sales cycle, taken from your own closed-won data. With an average B2B cycle around 10 months, a 90-day default discards most of the journey. Set the window near the 90th percentile of your first-touch-to-close durations, and write down the reasoning.