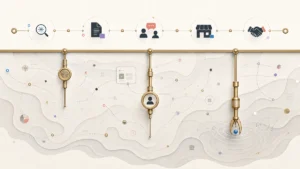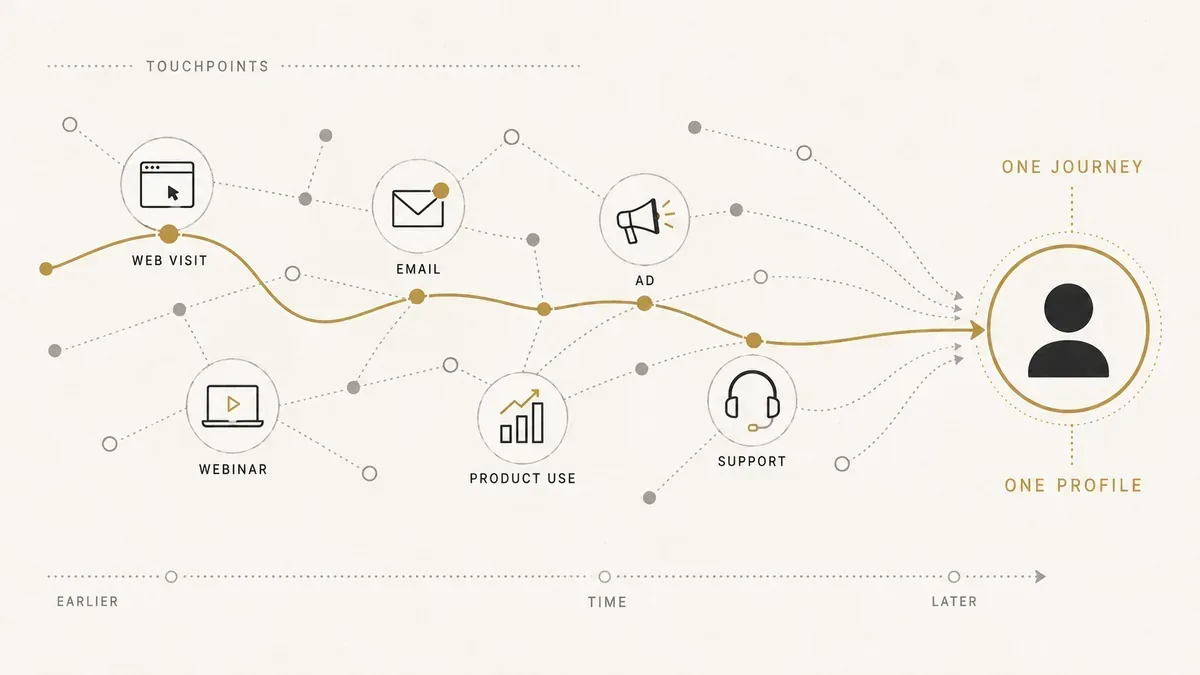
You can see every session, every form fill, and every email open in your dashboards, and still not answer the one question that decides the quarter: what actually moved this account from stranger to signed? That blind spot is what customer journey analytics closes. Instead of scoring one visit or one campaign in isolation, it measures the full sequence of interactions a customer has with your brand and shows you the real route they took to a decision.
The gap matters because isolated touchpoints lie. McKinsey found that customer journeys are 30 to 40 percent more predictive of business outcomes like satisfaction and revenue than individual touchpoints, and that a journey scoring 90 percent satisfaction at every step can still lose almost 40 percent of customers end to end. In B2B the problem is worse, because the “customer” is a buying group of six to ten people making a months-long decision, and Gartner reports they spend only 17 percent of that time meeting with suppliers. Most of the journey happens where you cannot see it, which is exactly why you have to measure it.
This guide covers what customer journey analytics is, the metrics and methods that do the work, how to run an analysis from scratch, the tool categories to choose from, and how to turn the findings into pipeline instead of a chart nobody opens.
Direct answer — What is customer journey analytics?
Customer journey analytics is the practice of measuring and analyzing the full sequence of interactions a person or account has with a brand across every channel and session, rather than one touchpoint at a time. It stitches web, product, CRM, email, and support data into a single identity, then uses path, funnel, cohort, and attribution analysis to reveal where journeys convert, stall, or break. Unlike web analytics, its unit of analysis is the whole journey, not the visit.
Key Takeaways
- Customer journey analytics measures the whole multi-touch path, not isolated sessions, which is why it predicts revenue and churn better than page or campaign metrics.
- It depends on identity resolution: stitching anonymous and known activity across web, product, CRM, and email into one profile, or in B2B, one account.
- Four methods do the analysis: path and flow analysis, funnel analysis, cohort analysis, and multi-touch attribution.
- Journey-specific KPIs like stage conversion, velocity, drop-off, and path length answer questions session metrics cannot.
- In B2B the unit is the account and the buying group, and most of the journey is self-directed, so you reconstruct it from data rather than observe it live.
- Journey mapping draws the intended path; journey analytics measures the real one. Serious teams run both.
What Is Customer Journey Analytics?
Customer journey analytics is the analysis of how customers move through every stage and touchpoint of their relationship with a brand, measured as one connected sequence rather than a set of separate events. It unifies data from marketing, sales, product, and service systems to reveal the real paths customers take, where they drop off, and which routes lead to revenue.
The difference from ordinary reporting is the unit of analysis. Traditional web and campaign analytics answer “what happened on this visit or this channel?” Journey analytics answers “what happened to this customer across all of them?” That shift depends on identity resolution, the work of connecting a first anonymous website visit, a later gated download, a product trial, and a support ticket to the same person, so their scattered activity reads as one story instead of five unrelated sessions.
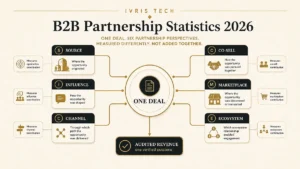
For B2B the object is bigger still. The thing you measure is rarely a single visitor; it is an account, and inside it a buying group of stakeholders in IT, finance, and the end-user team, each running their own research. The journey runs through the stages and touchpoints that make up the wider B2B customer journey, from first anonymous touch to renewal, and journey analytics is how you tell whether that intended path matches the one buyers actually walk.
Journey Analytics vs. Web Analytics vs. Journey Mapping
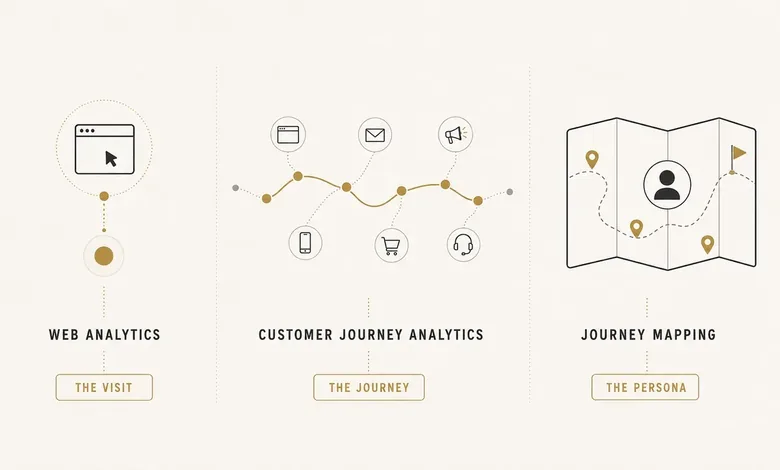
Customer journey analytics is often confused with two neighbors it should work alongside: web analytics and journey mapping. They answer different questions, and treating them as interchangeable is how teams end up with three tools and no clarity. The table below sets the boundary.
| Approach | What it measures | Unit of analysis | Best for | Main limit |
|---|---|---|---|---|
| Web analytics | Traffic, sessions, and events on a property | The session or pageview | Channel and page performance | Blind between visits, channels, and devices |
| Customer journey analytics | Connected interactions across channels over time | The person or account journey | Finding where journeys convert or break | Needs unified, identity-stitched data |
| Journey mapping | The intended stages, actions, and emotions | The persona or scenario | Aligning teams on the target experience | A hypothesis until data confirms it |
Read it this way: web analytics tells you a page converted at 3 percent; journey analytics tells you the accounts that read that page after a webinar convert at triple the rate of those who land cold. One measures the visit, the other measures the path. Journey mapping is different again. A map is the qualitative model of the journey you designed, drawn in a workshop before the data arrives. It is a hypothesis worth having, but only journey analytics tells you whether the map is true, and the two most useful outputs of any mapping exercise, the stages and the touchpoints, are the same coordinates your analytics measures against.
The Metrics and KPIs Journey Analytics Tracks
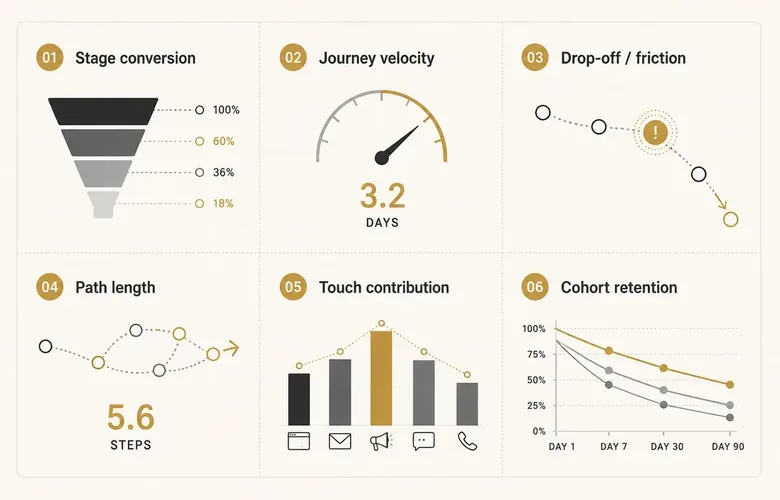
Journey analytics tracks a specific class of metric: numbers that only mean something across a sequence of touches, not on a single page. These sit on top of your core funnel and revenue reporting rather than replacing it, so pair them with the standard set covered in the guide to the B2B marketing metrics that matter. The journey-specific ones are:
- Stage conversion rate: the percentage of journeys that progress from one stage to the next, for example lead to opportunity, or trial to paid.
- Journey velocity: the time spent in each stage and the total time to convert, which surfaces where deals or signups stall.
- Drop-off and friction points: the exact steps where journeys stop, the single most actionable output journey analytics produces.
- Path length and complexity: how many touches and channels a journey involves before it converts, a reality check on any “three-touch” attribution fantasy.
- Touch contribution: which interactions actually move a journey forward, the input to attribution.
- Cohort retention: whether groups who entered the same way keep engaging, which is where journey analytics meets churn.
Two cautions keep these honest. First, a metric is only as trustworthy as the identity stitching under it; if the same buyer counts as three anonymous visitors, every journey number is inflated. Second, subscription businesses weight these differently, leaning harder on retention and velocity than a one-off purchase does, which is why the SaaS marketing metrics set treats journey health as a leading indicator of revenue rather than a rear-view report.
The Core Methods: Path, Funnel, Cohort, and Attribution Analysis
Four analytical methods turn raw journey data into decisions. Most journey and product-analytics tools ship all four, and mature teams move between them depending on the question. The table pairs each method with the question it answers and the trap it hides.
| Method | What it reveals | Use it when | Watch-out |
|---|---|---|---|
| Path and flow analysis | The real routes customers take, in order | You do not yet know the paths | High-volume paths can drown rare, high-value ones |
| Funnel analysis | Conversion and drop-off across fixed stages | The stages are known and sequential | Assumes a linear path buyers rarely walk |
| Cohort analysis | How groups behave and retain over time | You care about retention and timing | Small cohorts produce noisy trends |
| Multi-touch attribution | Which touches deserve credit for a result | You need to value channels and touches | Every model encodes a different bias |
Path and flow analysis
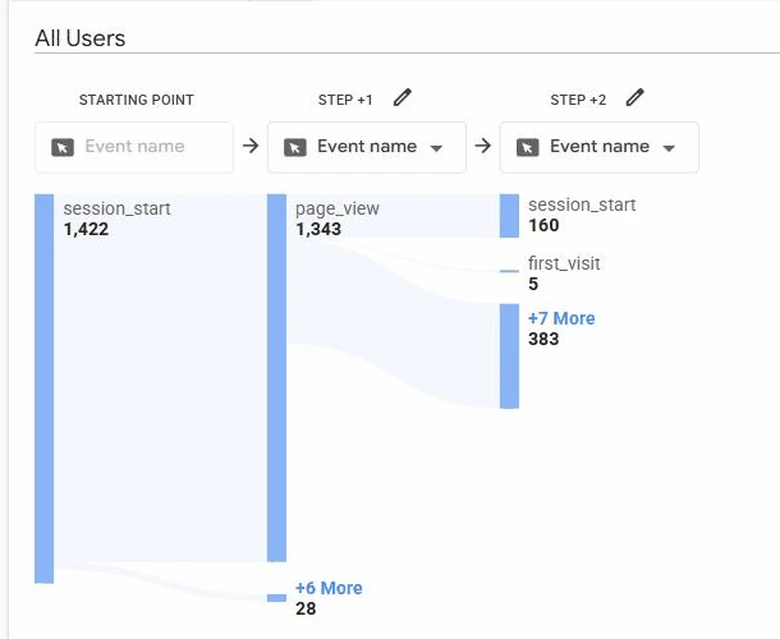
Path analysis reconstructs the actual order of steps customers take, forward from an entry point or backward from a conversion. It is the method for discovery, because it shows routes you never designed and did not expect, like the accounts that read pricing three times before ever booking a demo. Tools such as GA4’s Path exploration and the flow views in product-analytics platforms build these automatically once events are tracked.
Funnel and drop-off analysis
Funnel analysis measures conversion across a set of stages you define in advance and shows where the leaks are. It is precise when the steps are genuinely sequential, like a signup or checkout flow, and misleading when you force a non-linear B2B buying journey into a straight line it never follows. Use it to quantify friction you already suspect, then confirm the real order with path analysis.
Cohort analysis
Cohort analysis groups customers by a shared starting trait, usually their acquisition week or first action, and tracks how each group behaves over time. It answers whether the journeys you are creating this quarter retain better than last quarter’s, and it is where journey analytics becomes an early-warning system for churn rather than a post-mortem.
Multi-touch attribution
Attribution assigns credit for a conversion across the many touches that led to it, so you can value channels fairly instead of handing the win to the last click. Journey analytics supplies the connected path attribution needs, but choosing a model, first-touch, linear, time-decay, or data-driven, is a discipline of its own with real trade-offs, and the metrics guides above cover which model fits which motion. Treat attribution as the scoring layer on top of the journey, not a substitute for seeing it. The model choice itself, and how to wire that credit back to revenue, is the subject of customer journey attribution.
Which method when: reach for path analysis when you do not know the routes, funnel analysis when the stages are fixed and you want the leak points, cohort analysis when timing and retention are the question, and attribution when you need to defend a channel budget.
How to Run a Customer Journey Analysis
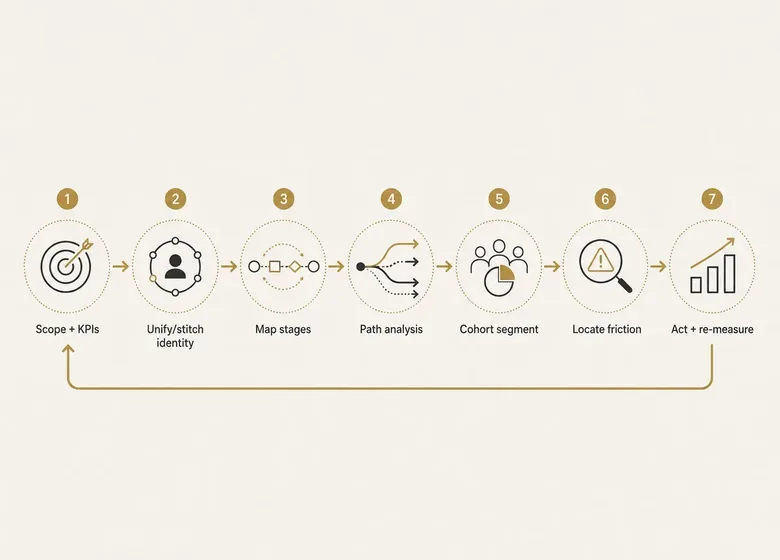
A first journey analysis is less about the tool and more about the sequence you follow. The workflow below assumes your data is already flowing into a journey or product-analytics platform; if it is not, connecting the sources is the real Step 0. Run these in order and you get a defensible answer in one focused session rather than a dashboard nobody trusts.
Workflow · one focused session
How to run a customer journey analysis: a seven-step first pass
A repeatable analysis loop that takes a scoped journey from question to acted-on fix, assuming your data already lands in a journey or product-analytics tool.
Scope the journey and pick your KPIs
Choose one journey to study (free trial to paid, or MQL to closed-won) and the two or three metrics that define success for it, such as stage conversion and time to convert. A journey analysis with no defined question produces a chart, not an answer.
Confirm the data is unified and identity-stitched
Verify that web, product, email, and CRM activity resolve to one profile or account. In B2B, most of that record is built in your marketing automation and CRM stack, so confirm it is feeding the journey tool cleanly before you trust a single number.
Map the stages and touchpoints you will measure
Define the stages and the events that mark entry into each. This is where a journey map earns its keep: it gives you the coordinates to measure against, so analysis tests a real hypothesis instead of wandering.
Run path analysis to see the real routes
Use path or flow exploration to surface the routes customers actually take, forward from entry and backward from conversion. Note where the real paths diverge from the map you drew in Step 3.
Segment by cohort and, in B2B, by account
Split the journeys into cohorts (by source, segment, or entry week) and compare. Averages hide the story; the gap between your best and worst cohorts is where the insight lives.
Locate the friction and quantify it
Find the stage with the steepest drop-off and put a number on it: how many journeys stall there, and what each stalled journey is worth. A friction point without a dollar figure rarely gets fixed.
Act on one fix, then re-measure
Change one thing at the friction point, then watch the same cohort move through again. Analysis that does not close this loop is where journey programs quietly die; the payoff is in the re-measure.
Customer Journey Analytics Tools and Platforms
A customer journey analytics platform is any tool that unifies cross-channel data into connected journeys and lets you run path, funnel, and cohort analysis on them. They fall into four categories, and the right one depends on where your journeys live, not on which vendor markets hardest.
- Product and behavioral analytics (Amplitude, Mixpanel, PostHog): event-based, strong at path, funnel, and cohort analysis. Best for product-led and digital journeys.
- Digital and web analytics (Google Analytics 4): free, session-first, with basic path exploration. Best for top-of-funnel web journeys and teams starting out.
- Experience and session analytics (FullStory, Hotjar, Contentsquare): session replay and frustration signals layered on paths. Best for diagnosing on-page friction.
- Enterprise CJA suites (Adobe Customer Journey Analytics, Salesforce): built for identity resolution at scale across online and offline data. Adobe’s Customer Journey Analytics runs on Adobe Experience Platform, its underlying data layer, which is why the two are often named together.
📊 Mixpanel
📊 PostHog
📊 Google Analytics 4
🔧 Adobe Customer Journey Analytics
📊 FullStory
PRO TIP
When you evaluate a platform, test four things, not the feature list: can it resolve identity across channels, ingest offline and CRM data, run self-serve exploration without an analyst, and answer questions at the account level, not just the user level? The last one is where most consumer-built tools quietly fail B2B teams.
Turning Journey Insight Into Revenue
Journey analytics only pays off when it changes a decision. A journey chart that nobody acts on is an expensive screensaver, so the measure of a program is not how many dashboards it produces but how many fixes it ships. Four moves turn the analysis into money.
The first is fixing the highest-cost friction stage. Because a journey can lose 40 percent of its people while every touchpoint looks healthy, the stage with the steepest drop-off is usually worth more than any new-acquisition campaign. The second is catching churn early: cohort analysis flags the groups whose engagement is fading weeks before they cancel, which is the window customer journey optimization uses to intervene while it still matters.
The third is personalization that fits the stage and the role. Twilio’s 2025 research found that 88 percent of consumers are more likely to buy when engagement is personalized in real time, yet only 44 percent of brands do it, and journey analytics is what tells you which stage a buyer is in so the next message is relevant rather than random. Acting on that signal in the moment is the job of customer journey orchestration, the layer that fires the right next action automatically. The fourth move is tying journeys to pipeline instead of vanity metrics, which in B2B means measuring at the account level, since that is the only unit revenue actually closes on.
This is also the honest limit of the discipline. Gartner reported in March 2026 that 67 percent of B2B buyers now prefer a rep-free experience, so much of the modern buying journey is self-directed and never touches your systems at all. Journey analytics reconstructs as much of that path as your data can see; it does not read minds. Knowing what it cannot show you is part of using it well.
Frequently Asked Questions
Scope one journey and its KPIs, confirm your data is unified into one identity, map the stages you will measure, then run path, funnel, and cohort analysis to find where journeys convert or stall. Quantify the biggest drop-off in dollars, fix one thing, and re-measure the same cohort to confirm the change worked.
Journey mapping is the qualitative model of the experience you intend customers to have, drawn in a workshop. Journey analytics is the quantitative measurement of the path they actually take, built from real data. The map is a hypothesis; the analytics tells you whether it is true. Teams that do both use the map to decide what to measure.
No. Web analytics measures sessions and events on a single property, so its unit of analysis is the visit. Customer journey analytics connects interactions across channels, devices, and time into one profile, so its unit is the whole journey. Web analytics tells you a page converted; journey analytics tells you which paths led people to it.
It is a tool that unifies cross-channel data into connected customer journeys and lets you run path, funnel, cohort, and attribution analysis on them. Categories range from product analytics like Amplitude and Mixpanel, to web analytics like GA4, to enterprise suites like Adobe Customer Journey Analytics that resolve identity across online and offline data at scale.
Adobe’s product, Customer Journey Analytics, is built on Adobe Experience Platform, which supplies the underlying data and identity layer it analyzes. But customer journey analytics as a discipline is vendor-neutral: you can practice it with product-analytics tools, GA4, or other suites. Adobe CJA is one implementation of the broader concept, not the definition of it.