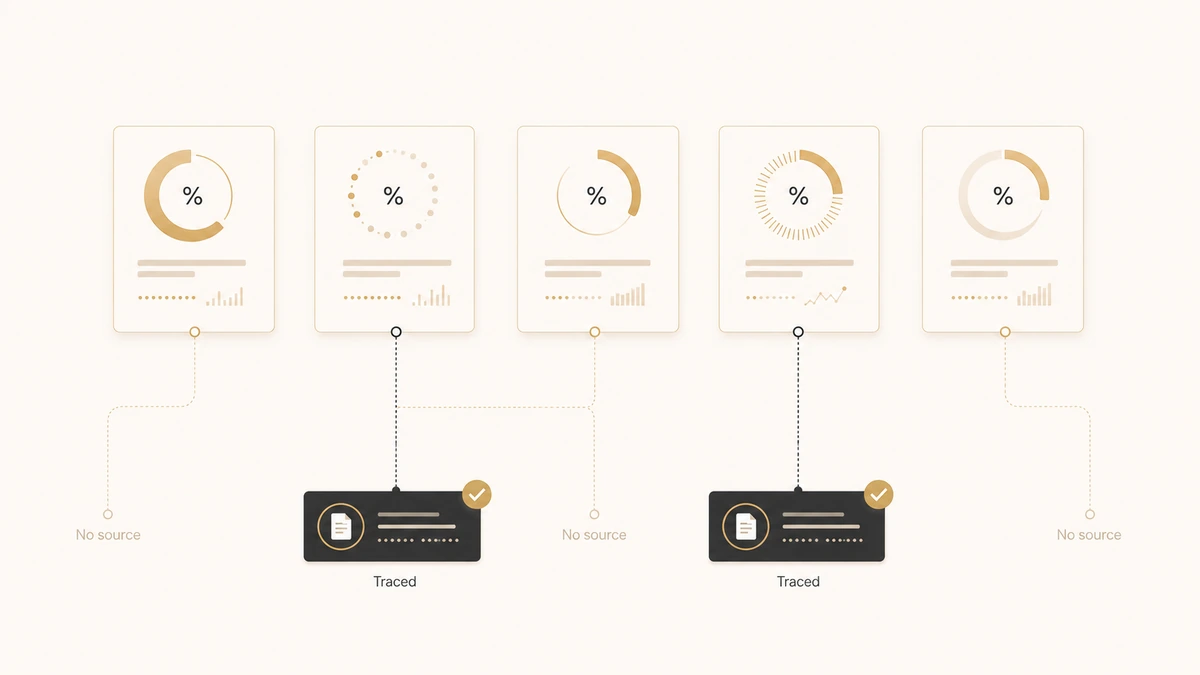
Search for ABM benchmarks and you get a number for everything. Win rates up 35%. Sales cycles 28% shorter. Companies 1.9 times more likely to beat their revenue targets. Each of those three appears across multiple ABM statistics roundups, and not one of those roundups names a study, a sample size, or a year.
Meanwhile the two organisations that actually published ABM data in 2026, Demand Gen Report and Demandbase, get quoted far less often. Their numbers are less flattering and they arrive with conditions attached.
This page is the sorted version. It gives you the 2026 figures that have a named publisher and a publication date, states exactly what population each one measured, and names three of the most repeated ABM claims in circulation that have no origin at all.
The sorting matters more now than it did five years ago. Answer engines lift statistics out of whichever page states them most cleanly, and a confident sentence with no citation reads exactly like a sourced one once it has been stripped of its surrounding context. The pages recycling untraceable ABM numbers are feeding them into systems that will then repeat them on your behalf.
Direct answer — What are the current ABM benchmarks?
ABM benchmarks are published figures for how account-based programs perform on adoption, engagement, account conversion, and win rate. Two 2026 sources carry a named publisher and date: Demand Gen Report’s Account Based Marketing Benchmark Survey, which reports that nearly 80% of surveyed organisations run ABM and 47% name personalised content as the highest-ROI tactic, and Demandbase’s State of ABM 2026, which measured a 22.33% median account conversion rate across 1,452 platform tenants. Neither is a cross-industry average.
Key Takeaways
- Only two 2026 ABM datasets have a named publisher, a date, and public findings: Demand Gen Report’s benchmark survey and Demandbase’s State of ABM 2026.
- Demand Gen Report publishes percentages without a denominator. Across its four public pages on the 2026 survey, no sample size, field period, or population definition appears anywhere.
- Demandbase’s numbers are the most measurable and the most bounded: 1,452 platform tenants, which means its own customers, not a random sample of B2B companies.
- Three of the most quoted ABM statistics have no traceable origin: the 1.9× revenue-target claim, the 35% close-rate claim, and the 28% faster-sales-cycle claim.
- No published ABM benchmark can tell you what your win rate should be. Only a trailing comparison against your own non-target accounts can do that.
What ABM benchmarks are, and what each 2026 source counted
ABM benchmarks are published performance figures for account-based programs, covering adoption rates, engagement and coverage levels, account conversion rates, win rates, and program ROI. In 2026 only a small number come from a named publisher with a stated date.
The distinction that matters is not which number is highest. It is what each source counted, and whether your own program resembles the population it counted. Here is the whole field in one view.
| 2026 source | What it measures | Population measured | Can you compare against it? |
|---|---|---|---|
| Demand Gen Report, Account Based Marketing Benchmark Survey 2026 | Adoption, satisfaction, tactic ROI ranking, AI use and barriers | Self-selected survey respondents. Count never published. | Directionally, for sentiment and priorities. Not as a performance target. |
| Demandbase, State of ABM 2026 | Account conversion rate, win rate, buying-group touch counts | 1,452 Demandbase tenants and 38 million marketing activities | Only if you run a comparable ABM platform on a comparable account list. |
| Vendor blog benchmark ranges | Engagement, penetration, coverage, win-rate ranges | Usually not stated. Often labelled directional guidance. | No. These are editorial estimates, not measurements. |
| Recycled statistics (1.9×, 35%, 28%) | Nothing traceable | None found | No. Withdraw them from your decks. |
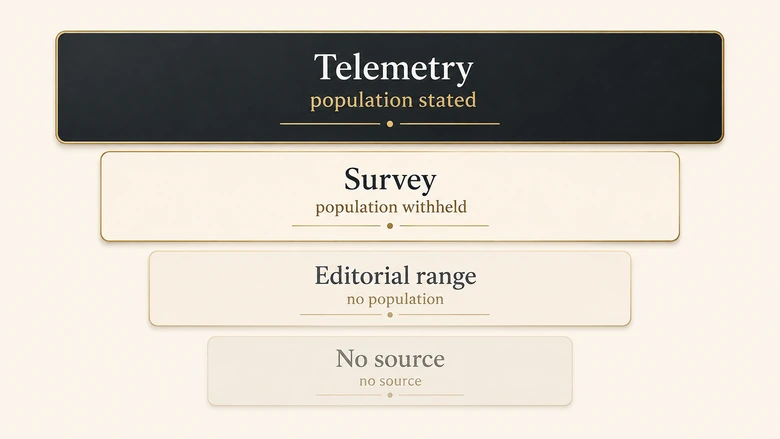
Two of those four rows are usable with conditions attached. The other two are the reason ABM benchmark pages contradict each other so freely, and the reason a board deck built from a statistics roundup falls apart the moment someone asks where the number came from.
Benchmark or statistic? Three questions that separate them
The word benchmark is doing a lot of unearned work in most of those sources. A benchmark is a figure you can position yourself against, which requires knowing the population it was drawn from and the definition it used. A statistic is any number a study produced. Most published ABM benchmarks are statistics that have been relabelled, and the relabelling is where the damage happens, because nobody compares themselves to a statistic and everybody compares themselves to a benchmark.
Three questions separate one from the other. Who was measured, and does your program resemble them? What exactly was counted, and does your CRM count it the same way? Over what period, and has anything structural changed since? A figure that survives all three is usable. A figure that fails any one of them is context, and should be quoted as context.
Adoption and satisfaction: what the 2026 ABM Benchmark Survey found
The 2026 Account Based Marketing Benchmark Survey is Demand Gen Report’s annual practitioner study, published across a series of dated posts by editor James Hickey between May and June 2026.
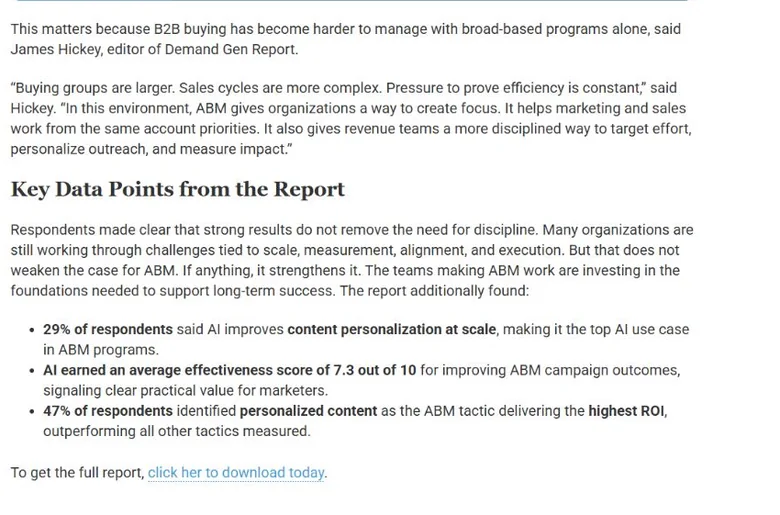
On adoption, the survey found that nearly 80% of surveyed organisations are actively executing an ABM strategy, with the rest planning to add one. Sentiment tracks with that: 52% said their ABM efforts are meeting expectations, 23% said exceeding, and 10% said greatly exceeding.
On what actually pays back, the survey ranked tactics by reported ROI. Personalised content took the top spot at 47%, well clear of executive events at 27%. Account-based advertising and direct mail were named as further strong contributors without ranking above those two. If you want to see what a personalised-content play looks like once it is running against a real account list, the tactic catalogue and the campaign structures behind each one are worth reading alongside this ranking.
On AI, 29% named content personalisation at scale as the top use case, and respondents scored AI’s effectiveness at improving ABM campaign outcomes at 7.3 out of 10. The friction is concrete: 43% said they struggle to connect AI to their existing martech stack. That integration gap is the practical constraint on moving ABM from static target lists to live scoring, and it shows up before any model quality question does.
IMPORTANT
This survey publishes percentages and no denominator. Across its four public pages, the word “respondents” never appears with a count, and no sample size, field period, or description of who was invited appears anywhere. The full report sits behind a form. Quote it for direction, never as a measured benchmark.
Reading the adoption and satisfaction numbers honestly
That gap is worth naming precisely, because it changes what the numbers can carry. “47% named personalised content” is a statement about how a group of self-selected marketers ranked their own tactics. It is not evidence that personalised content returns more than executive events. Both readings get published; only the first one is supported.
The satisfaction distribution has the same shape of problem, and it reads stronger than it is. Adding the three positive bands gives 85% of respondents at or above expectations, which sounds close to unanimous. But the sample is people who currently run ABM and chose to answer a survey about ABM. Every team that tried account-based marketing and quietly went back to broad-based demand generation is absent by construction. Self-reported satisfaction among current practitioners is the weakest outcome measure a category can produce, and it is the one most often quoted as proof that the category works.
What this survey is genuinely good for is direction. It tells you ABM is now standard practice rather than an experiment, that practitioners rank personalised content above events and advertising, that AI has landed in ABM workflows without landing cleanly, and that integration rather than model quality is the current bottleneck. Those are useful planning signals. None of them is a number you can hold a team to.
Conversion and win rates: what Demandbase measured across 1,452 tenants
Demandbase’s State of ABM 2026 is the largest ABM dataset published this year, and the only one built from platform telemetry rather than self-report.
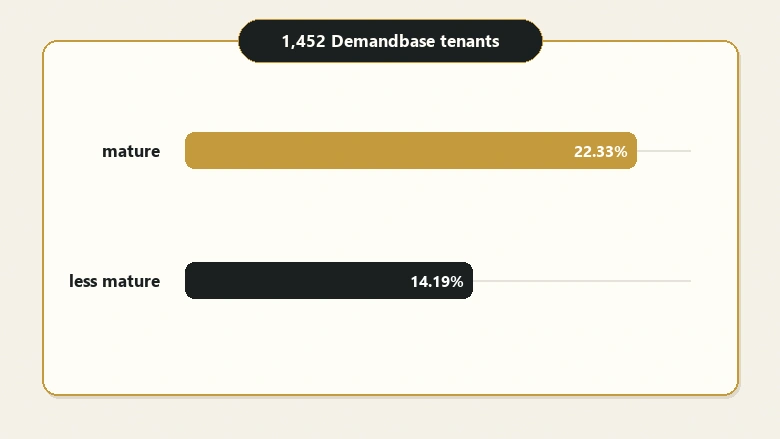
The headline conversion figure is a split by program maturity. Organisations with mature ABM frameworks recorded a 22.33% median marketing-qualified-account conversion rate against 14.19% for less mature programs, drawn from an analysis of 1,452 tenants and 38 million marketing activities.
The advertising and buying-group findings sit alongside it. Companies running four advertising products reported a 58.7% win rate, a 71% lift over companies running none. Teams that align around buying groups rather than individual leads saw up to two to three times higher win rates, with performance peaking when they focused on two to three buying groups per product. Groups receiving 180 to 190 touches reached a 94% conversion rate.
Why 1,452 tenants is not 1,452 companies
Every one of those numbers carries the same boundary. A tenant is a Demandbase platform instance, not a company drawn at random from the B2B population. The measured group is made up of organisations that already bought an ABM platform, already built target lists inside it, and already invested enough to generate telemetry worth modelling. Maturity and outcome are both downstream of that spend, which is exactly the correlation the maturity split is measuring.
Telemetry is still a real methodological advantage and it deserves credit. A platform counting 38 million activities is not asking marketers to recall how they performed; it is recording what happened. Against every self-reported ABM survey in circulation, that removes recall bias, optimism bias, and the freedom respondents have to define their own success criteria. The population is narrow, but inside that population the counting is honest, which is more than most of this category can claim.
Reading the touch-count and advertising figures
The 180 to 190 touch figure reaching a 94% conversion rate is the one most likely to be misread. Read forwards it says: apply 180 touches, convert 94% of the time. Read correctly it says: among buying groups that accumulated 180 to 190 touches, 94% converted. Groups only reach that count if they keep responding, so sustained engagement is partly what produced the touch total in the first place. Touch volume is as much a symptom of a live deal as a cause of one, and a team that responds by raising send volume against unresponsive accounts reproduces the input without the outcome.
The advertising figure needs the same handling. A 58.7% win rate described as a 71% lift over companies running none implies a base rate near 34%. The gap is real in the data, but the four-product cohort is also the highest-spending cohort, and spend travels with account quality, sales coverage, and executive sponsorship. The finding is that these things cluster together. It is not evidence that buying a fourth advertising product moves a win rate.
The two-to-three buying-group ceiling is the most operationally useful figure in the set, because it implies a limit rather than a target. Running more concurrent groups per product does not scale linearly, which is the same constraint that makes collision rules for two campaigns landing on one account a planning requirement rather than a nicety.
Settle what counts as an account win first
Before any of these figures can sit next to your own, the definitions have to match. Two teams counting an account win differently will produce two incomparable rates from identical performance: one counts the account once, the next counts every opportunity inside it, a third counts new logos only. That reconciliation is where most benchmark comparisons quietly fail, which is why the question of which account gets credit for what has to be settled inside your CRM before you read a single external number.
Three ABM benchmarks with no source at all
Before quoting any ABM statistic, check whether it names a study. These three do not, and they are among the most repeated figures in the category.
“ABM users are 1.9× more likely to exceed revenue targets”
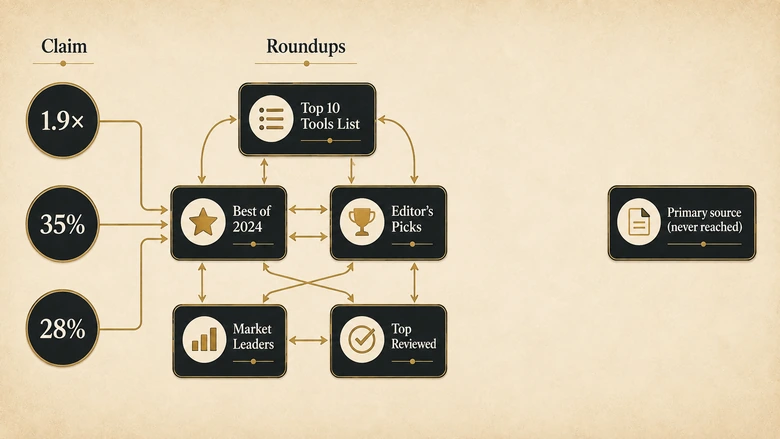
This appears on ABM statistics roundups in a form that credits nobody. Tracing it returns more roundups, each citing the previous one or citing nothing at all. No survey, vendor report, or analyst note states it. There is no sample, no year, and no definition of what “exceeding revenue targets” was measured against.
“ABM accounts close at 35% higher rates”
Same pattern, with an extra problem. “35% higher” is a relative lift, so it requires a comparator, and no page stating the figure says what the comparison group was. Higher than non-target accounts at the same company? Higher than a pre-ABM baseline? Higher than an industry average? The claim cannot be checked because it never specifies what it is 35% higher than.
“ABM shortens sales cycles by 28%”
The most instructive of the three. Some versions add detail, stating the cycle drops from 120 days to 86 days. That pair is worth doing the arithmetic on: 120 to 86 is a 28.3% reduction. The day figures look reverse-engineered from the percentage rather than measured and then converted, which is what you would expect if a writer needed concrete numbers to sit under a claim that arrived without any. The nearest genuine 28% figure in current circulation attaches to digital sales rooms, not to ABM.
Checking a benchmark before you quote it takes about two minutes. Run these five steps in order:
- Search the exact figure in quotation marks and read the three oldest results, not the newest ones.
- Follow every citation exactly one hop back. A roundup citing another roundup is not a source.
- Look for a named publisher, a publication year, and a sample size. All three, not any one of them.
- Check whether the figure is relative or absolute, and if relative, find what it is being compared against.
- If the trail ends without reaching a study, stop. Do not quote it with a hedge, because the hedge is the first thing the next writer removes.
The absence of a source is not proof that a figure was invented. A number sitting inside a paywalled PDF would be invisible to this kind of search. But a benchmark you cannot trace is a benchmark you cannot defend, and the moment a CFO asks who measured it, an untraceable number costs you more credibility than it ever bought.
How one number picks up three different attributions
A benchmark’s attribution can change as it travels, and the version you meet is often not the version that was published. The mechanism is worth seeing once, because it explains most of the disagreement between ABM benchmark pages.
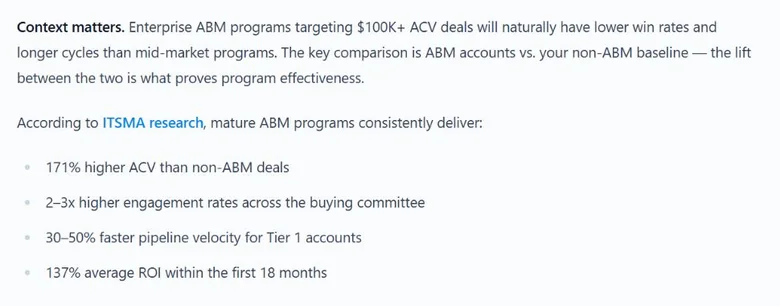
A widely ranking 2026 ABM metrics page credits four separate figures to “ITSMA research” in a single block: 171% higher annual contract value, two to three times higher buying-committee engagement, 30 to 50% faster pipeline velocity for tier-one accounts, and 137% average ROI within the first 18 months. Two of those trace to entirely different publishers. The 171% figure originates in TOPO’s ABM: State Of The Market, commissioned by the ABM Leadership Alliance and built on phone interviews with 50 executives. The 137% figure comes from a 2025 panel survey in which 771 marketers estimated their own ABM ROI. We traced both figures back to their originals and scored every ABM study on what it discloses, which is the check to run before any of these numbers reaches a slide.
A second pattern runs alongside it. Several high-ranking ABM measurement guides publish numeric ranges that read as benchmarks but are labelled, in the fine print, as directional guidance. One 2026 measurement guide states that 60 to 70% of target accounts engage within the first 90 days and that healthy early-stage penetration runs 20 to 40%, without attributing either range to a study. These are editorial estimates by experienced practitioners, which is a reasonable thing to publish. The failure happens downstream, when the next writer strips the hedge and republishes the range as a measured benchmark.
Why the misattribution happens
The mechanism is rarely dishonesty. Statistics roundups compete on volume, a page promising ninety-plus ABM statistics needs ninety-plus of them, and verifying each one back to primary source is slower than collecting them. Attribution gets attached to whichever research firm sounds most plausible for the claim, and ITSMA sounds plausible for anything ABM because ITSMA genuinely did foundational ABM research. What results is a credible-looking citation chain that leads nowhere, assembled with no intent to mislead.
The compounding is the newer problem. Answer engines synthesise across these pages, and a figure appearing on twenty sites with confident attribution looks better corroborated than a figure appearing once with a real methodology note. Volume substitutes for verification inside exactly the systems B2B buyers now use to build shortlists, which is why an untraceable number has stopped being only an internal credibility risk.
Which ABM benchmark to use for which decision
Match the source to the question you are answering, because each 2026 dataset supports a narrow set of decisions and breaks on the rest.
| The question you are answering | Best available 2026 source | What that source cannot do |
|---|---|---|
| Is ABM still a mainstream practice, or are we early? | Demand Gen Report: nearly 80% actively executing | Cannot tell you how well those programs perform. Adoption is not outcome. |
| Where should next quarter’s ABM budget go? | Demand Gen Report tactic ranking: personalised content 47%, executive events 27% | Cannot prove those tactics return more. It ranks practitioner opinion. |
| Is our account conversion rate low? | Demandbase: 22.33% mature against 14.19% less mature | Cannot apply unless your target list, stage definitions, and platform resemble a Demandbase tenant’s. |
| How many buying groups should we run per product? | Demandbase: performance peaks at two to three | Cannot set your ceiling. It reports where a modelled curve turned over. |
| What win rate should we be hitting? | None of them | No published source measures your accounts. Use your own trailing baseline. |
| Is our AI tooling underperforming? | Demand Gen Report: 7.3 out of 10 effectiveness, 43% report stack integration problems | Cannot diagnose your stack. It reports how a self-selected group rated theirs. |
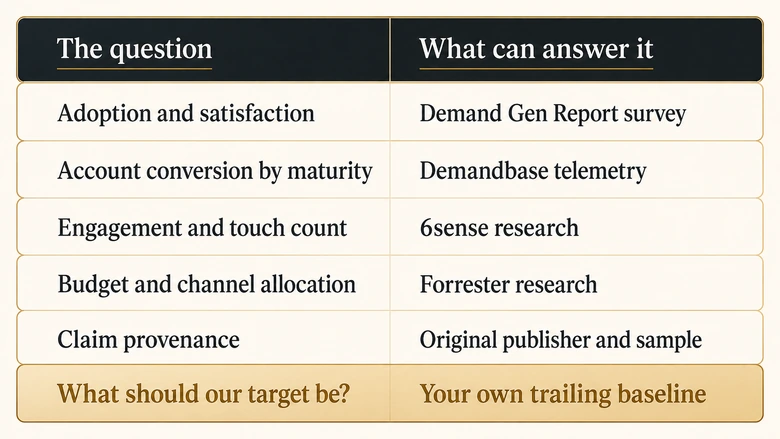
Notice what the last row does to the other five. Every published ABM benchmark describes a population that is not yours, which means none of them can set your target. They can tell you whether a practice is common, where practitioners think the return sits, and roughly how a large platform’s customer base performs. They cannot tell you what good looks like inside your pipeline.
When a stakeholder insists on a number
When a stakeholder asks for a benchmark anyway, the workable move is to give them a bounded one rather than refuse. State the closest published figure, name its population in the same breath, and put your own trailing number beside it. “Demandbase’s platform customers convert target accounts at about 22% once their program is mature; we are at 16% against our own list, measured the same way for four quarters” is a defensible sentence in any room. “The industry benchmark is 22%” is not, and it is the sentence you will have to walk back.
One more limit worth stating: every figure on this page stops at closed-won. Retention, expansion, and net revenue retention on target accounts sit outside all three 2026 datasets, which is a real gap given that the account relationship keeps running long after the deal closes and that expansion revenue is where most account-based programs eventually justify themselves.
Build your own ABM baseline instead of borrowing one
To replace a borrowed benchmark, measure the same metric on your target accounts and your non-target accounts over the same period, then compare the two. The comparison is the benchmark.
ABM lift = (Target-account win rate − Non-target win rate) ÷ Non-target win rateFive things have to be true for that number to mean anything. Freeze the target list at the start of the measurement window, so accounts added after they showed intent do not inflate the result. Use identical stage definitions for both cohorts. Use the same denominator on both sides, usually accounts entered rather than opportunities created. Measure across at least four trailing quarters if your cycle runs longer than a quarter. And keep the cohorts separate in reporting, because the moment target and non-target accounts merge into one funnel view, the comparison is gone.
When you have no control group
Two situations break the comparison, and both have workarounds. If your target list already covers nearly every account you sell to, there is no non-target cohort left to compare against; use a time-based control instead, measuring the four quarters before the program started against the four quarters after, and accept that market conditions are now sitting inside your result. If your target list is small enough that quarterly win-rate swings are mostly noise, measure account progression rate rather than win rate, because progression events happen more often and stabilise faster at low volume.
PRO TIP
Run the baseline before you launch, not after. A pre-launch trailing measurement on your non-target accounts is the only control group you will ever get for free, and it becomes unrecoverable once the ABM program starts influencing the accounts you would have compared against.
The result is a figure nobody else can publish and nobody can dispute, because it was measured on your accounts with your definitions. It also survives the question that kills borrowed benchmarks: someone asks where the number came from, and the answer is your own CRM, over a stated window, with a stated denominator.
That is the whole argument of this page. The 2026 ABM data worth quoting is thinner than the statistics roundups suggest, the most repeated figures are the least supported, and the only benchmark that can actually govern a decision is the one you measured yourself.
Frequently Asked Questions
No published source can answer this for your program. Demandbase reported a 58.7% win rate for its tenants running four advertising products, but that describes a high-spend subgroup of one platform’s customers. The usable answer is your target-account win rate compared against your own non-target accounts over the same period.
There is no measured average. The widely quoted 137% figure comes from a 2025 panel survey in which 771 marketers estimated their own returns, so it records opinion rather than measurement. Demand Gen Report’s 2026 survey ranks which tactics practitioners believe return most, but publishes no ROI figure at all.
The commonly cited 12 to 18 month range is directional guidance from vendor measurement guides, not a measured finding. A defensible answer depends on your own sales cycle length: expect engagement and coverage signals within one cycle, and revenue signals no sooner than one full cycle after the first target account entered pipeline.
Generally no. None of the 2026 ABM datasets publish industry cuts with stated sample sizes, and the largest of them measures a single platform’s customer base. Deal size, cycle length, and buying-committee size all vary enough by sector that a cross-industry ABM average would hide more than it reveals.
Nowhere traceable. The claim that ABM users are 1.9 times more likely to exceed revenue targets appears across ABM statistics roundups, but following the citations returns only more roundups. No survey, vendor report, or analyst note states it, and no sample size or year is ever attached to it.