B2B partnership statistics become unreliable at the exact moment they look most useful. For example, one page says partners drive a quarter of revenue, another says half, and a third counts every deal a partner touched. Those statements can all be arithmetically correct while measuring different events.
IVRIS reviewed a 165-claim research ledger and selected 18 benchmarks that could be traced to primary surveys, reports, transaction analysis or market forecasts. The result is not a universal partner-revenue percentage. Instead, it is a set of bounded numbers you can quote without turning partner-sourced, partner-influenced, indirect, marketplace and ecosystem metrics into one fictional average.
Direct answer — What are the most reliable B2B partnership statistics for 2026?
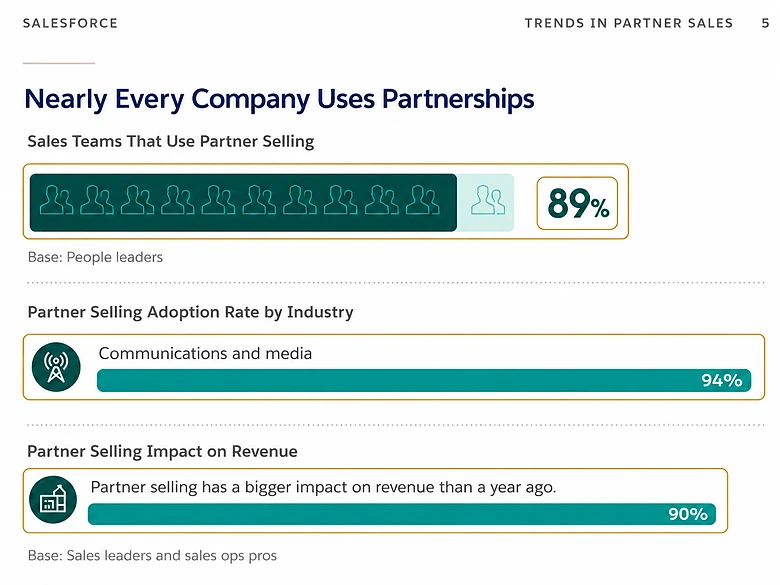
The strongest current evidence says partner selling is widespread: 94% of Salesforce’s surveyed sales teams use it. Yet operating discipline trails adoption, with only 36% of KPMG respondents consistently measuring partner performance. No credible source establishes a universal share of B2B revenue sourced by partners. The useful benchmarks instead cover adoption, investment, attributed pipeline, indirect growth expectations, budgets, deal associations and marketplace forecasts.
Key takeaways
- Partner selling is mainstream in Salesforce’s survey population: 94% use it, 89% say it is increasingly important to revenue targets, and 90% of those working with partners use dedicated tools.
- Expansion is running ahead of governance: KPMG’s 2026 global study found 90% planned to grow partnerships and technology ecosystems, while a separate KPMG ecosystem survey found only 36% consistently measured performance and 71% struggled to align partners around common goals.
- Revenue percentages are not interchangeable: PartnerStack’s 35% figure combines partner-sourced and partner-influenced pipeline; it is not a 35% sourced-pipeline benchmark.
- Forecasts need their verbs: Forrester reported expectations for growth in indirect and influenced revenue, while Omdia forecast future marketplace transaction value. Neither is an observed 2026 revenue share.
- Better deal outcomes do not prove partner causation: Ebsta’s 3.8-times sales-velocity result is a large association inside its analyzed dataset, not a controlled estimate of partner lift.
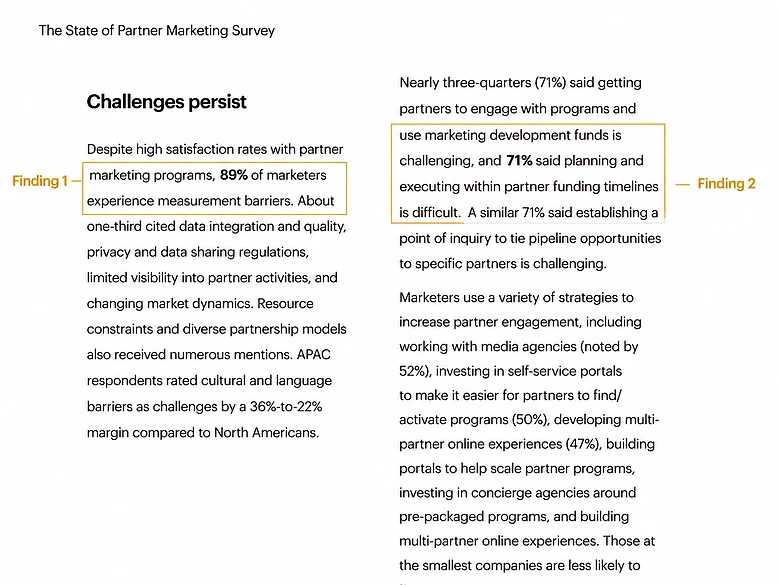
- The clearest operating gap is measurement: Foundry found 89% of surveyed partner marketers faced measurement barriers and 71% found it difficult to connect pipeline to a specific partner.
What counts as a B2B partnership statistic?
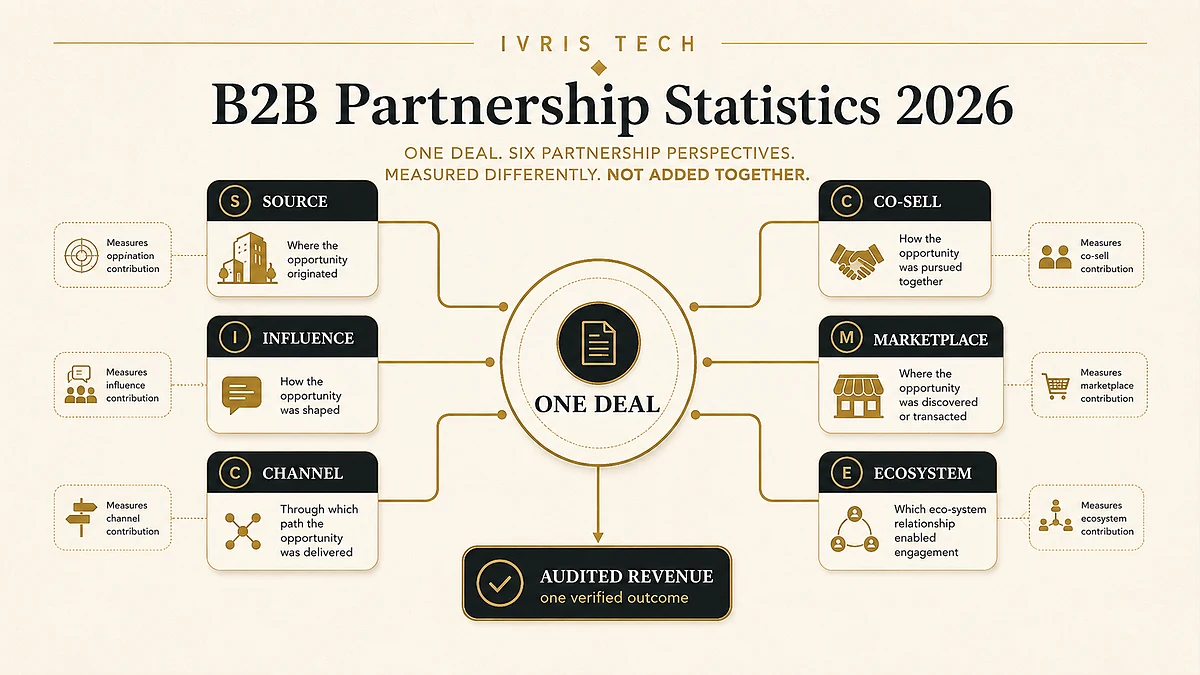
A B2B partnership statistic is a measured result about a defined partner motion, population, period and business outcome. A usable figure states whether the partner originated demand, influenced a decision, transacted the sale, joined a co-sell motion, facilitated marketplace procurement or simply existed in the wider ecosystem.
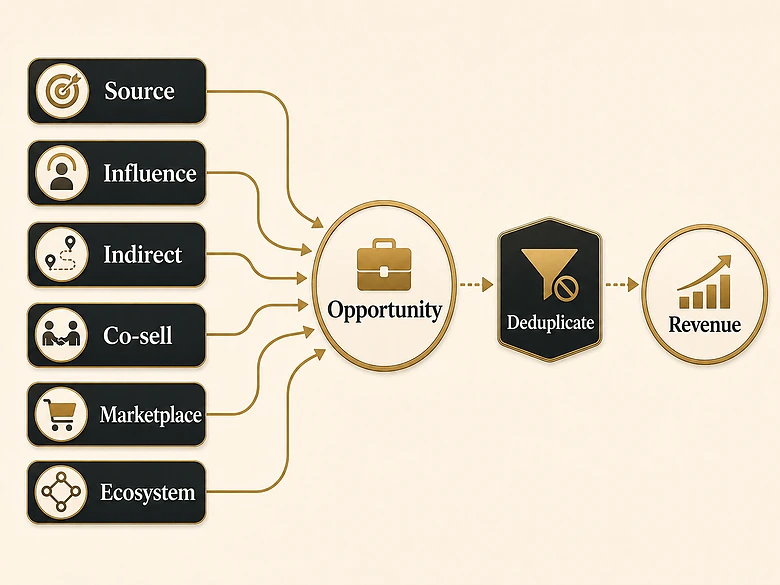
The distinction matters because one opportunity can legitimately qualify for several labels. A technology partner might introduce the account, join a co-sell call, influence technical validation and route the final purchase through a cloud marketplace. Counting every label as separate partner revenue would multiply one deal into four claims.
Separate the six metric families
| Metric | Count it when | What it does not prove |
|---|---|---|
| Partner-sourced | A documented partner action originates the lead or opportunity under a pre-agreed rule. | That the partner was the only reason the buyer entered the market or eventually purchased. |
| Partner-influenced | An eligible partner interaction occurs within the defined account, opportunity and attribution window. | That the partner created the opportunity, transacted the order or caused the result. |
| Indirect or channel revenue | The commercial transaction passes through a reseller, distributor, agent or another approved indirect route. | That the transacting partner originated demand or supplied the decisive influence. |
| Marketplace transaction value | A purchase is completed through a marketplace route, including private offers where applicable. | Vendor net revenue, partner-sourced revenue or partner influence unless those fields are separately captured. |
| Co-sell | Two or more organizations coordinate account work, opportunity planning or selling activity. | A standalone revenue denominator. Co-sell is a motion that can sit inside sourced, influenced or indirect reporting. |
| Broader ecosystem | The measure covers a network of technology, services, alliance, channel, data, innovation or other partners. | That every member is active, revenue-producing or part of the go-to-market route. |
Fix the calculation contract
Partner-sourced pipeline rate
Unique qualifying opportunities originated by an eligible partner ÷ all qualifying opportunities created in the same period × 100
Partner-influenced pipeline rate
Unique qualifying opportunities with at least one eligible partner interaction ÷ all qualifying opportunities in the same cohort × 100
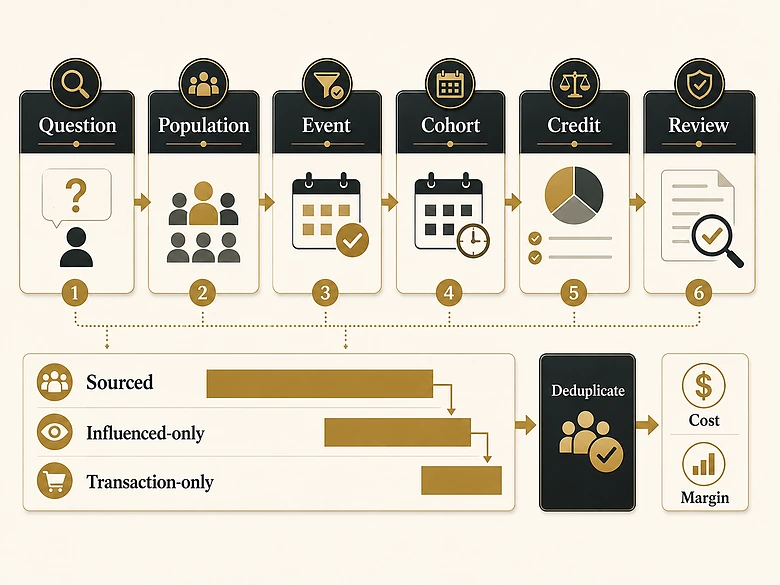
Both formulas still need a written contract. Define the eligible event, opportunity cohort, time window, deduplication rule and treatment of late partner registration before calculating the percentage. Otherwise, two teams can use the same formula and produce incompatible answers.
Important
There is no defensible universal percentage of B2B revenue that “comes from partnerships.” Any benchmark without a partner type, metric definition, sample, period and caveat is not ready for a board slide, even when the percentage itself came from a real report.
B2B partnership statistics: 18 verified benchmarks
The benchmark register below keeps each number attached to its actual question. Read the scope column before the percentage: adoption, intention, attribution, budget, association and forecast describe different stages of evidence.
Adoption, investment and operating maturity
| # | Source and finding | Scope | Safe reading |
|---|---|---|---|
| 1 | Salesforce State of Sales 2026: 94% of surveyed sales teams reported using partner selling. | 4,050 sales professionals in 22 countries; fieldwork August to September 2025. | Partner selling is common in this global survey population. It is not a revenue-share or productivity result. |
| 2 | Salesforce: 89% said partner selling was increasingly important to reaching revenue targets. | Same 2026 report and survey population. | Perceived strategic importance is high. The figure does not show how much revenue partners produced. |
| 3 | Salesforce: 90% of sales professionals working with partners reported using dedicated tools. | Same 2026 report; subset working with partners. | Tool adoption is high in this survey subset. It does not establish data quality, partner activation or return. |
| 4 | KPMG Global Tech Report 2026: 90% planned to grow partnerships and technology ecosystems over the next year. | 2,500 executives across 27 countries and territories and eight industries. | A large global intention signal in a technology-transformation context, not observed partner GTM growth. |
| 5 | KPMG: only 36% consistently measured partner performance. | Same 258-leader survey; self-reported measurement consistency. | Governance is a minority practice in this population. The report does not disclose a shared metric standard. |
| 6 | KPMG: 71% had trouble getting partners to align with strategic goals. | Same large-organization survey. | Shared objectives are a common operating problem. It does not quantify the cost of misalignment. |
| 7 | PartnerStack and Wynter: 69% planned to increase partnership investment. | 100 senior leaders at B2B SaaS companies with at least $50 million in revenue; 2025 fieldwork. | A current intention signal for mature SaaS companies, not a cross-industry spend benchmark or realized budget increase. |
Pipeline attribution and revenue forecasts
| # | Source and finding | Scope | Safe reading |
|---|---|---|---|
| 8 | PartnerStack and Wynter: respondents attributed 35% of new pipeline to partner-influenced or partner-sourced activity. | Mid-market and enterprise respondents in the 100-company B2B SaaS study; prior quarter. | The source combines two non-equivalent categories. Quote the combined wording, not “35% partner-sourced pipeline.” |
| 9 | PartnerStack and Wynter: attribution models were 42% multi-touch, 31% first-touch, 19% last-touch and 8% other or none. | Same 100 senior leaders; model labels are self-reported. | Reported partner contribution will change with the credit rule, even when the underlying opportunities are identical. |
| 10 | Forrester’s 2025 partner ecosystem research: 67% expected indirect revenue transacted by partners to grow by more than 30% year over year. | B2B partner ecosystem and channel marketing decision-makers; public blog does not state sample size. | This is a forecast about the growth rate of indirectly transacted revenue, not a claim that partners transact 67% of revenue. |
| 11 | Forrester: roughly two-thirds expected partner-influenced revenue to grow by more than 30% year over year. | Same research; influence is explicitly separate from indirect transaction. | A future growth expectation for an attributed metric. The public page does not disclose influence rules or sample size. |
Partner marketing budgets and deal performance
| # | Source and finding | Scope | Safe reading |
|---|---|---|---|
| 12 | Foundry Partner Marketing Study 2024: respondents spent an average 37% of marketing budgets on partner marketing, up from 28% in 2014. | 353 technology marketing leaders who give or receive partner-marketing funds; global sample. | A substantial budget share inside a highly involved technology-marketing population, not an average for all B2B companies. |
| 13 | Foundry: 89% experienced at least one partner-marketing measurement barrier. | Same 353 respondents. | Measurement difficulty is nearly universal in this selected population, but the broad barrier question does not rank one universal cause. |
| 14 | Foundry: 71% found it difficult to connect pipeline opportunities to a specific partner. | Same partner-marketing survey. | Partner-level attribution remains difficult even among experienced programs. The result does not specify the attribution model used. |
| 15 | Ebsta and Pavilion: the partnership lead-source category showed 3.8 times the sales velocity of the overall benchmark. | 4.2 million opportunities, 530 companies, more than $54 billion in revenue; data primarily from 2023. | A large transactional association. Public methodology does not establish that partner involvement caused the difference. |
Technology, AI and marketplace routes
| # | Source and finding | Scope | Safe reading |
|---|---|---|---|
| 16 | KPMG stated that “technology dominates 80 percent of respondents’ partner ecosystems.” | Same 258-leader ecosystem survey. | Preserve the wording. It describes ecosystem composition or presence, not 80% of partners, activity or revenue. |
| 17 | KPMG: “Using partnerships to expand AI use cases will be a priority during the next one to three years,” cited by 69% of respondents. | Same large-organization survey; future-priority wording. | This is not current AI-partnership adoption, deployment or financial return. |
| 18 | Omdia: hyperscaler marketplace software sales were $30 billion in 2024 and forecast to reach $163 billion in 2030; partners were forecast to facilitate nearly 60% of 2030 transactions. | Analyst market model; 2024 actual base and 2025 to 2030 forecast. | Transaction value is not vendor net revenue, and facilitation is not the same as sourcing or influence. |
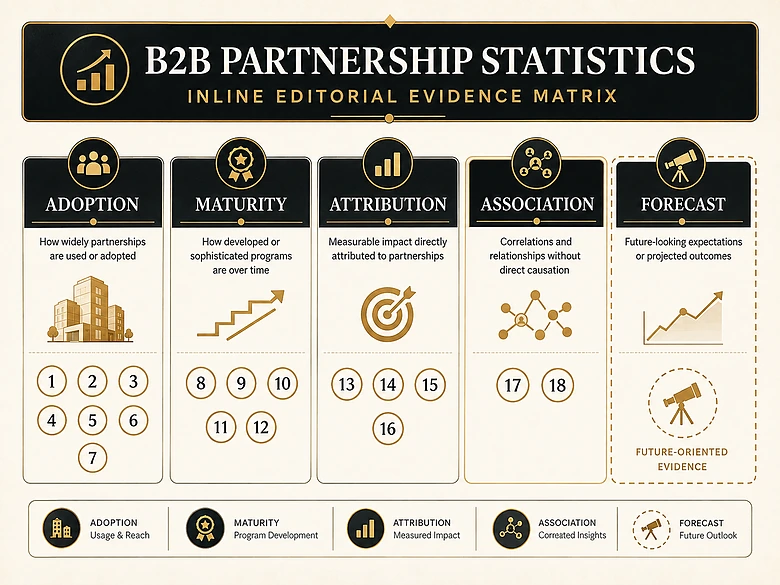
The table is intentionally uneven. Some findings have large global samples and clear field dates; others publish only a top-line result. That unevenness is part of the answer: a number with a missing sample or credit rule belongs in directional planning, not in a precise cross-company benchmark.
Partner adoption is mainstream; operating maturity is not
Partner adoption measures whether teams use a motion, not whether the motion produces incremental profit. Salesforce’s 94% figure makes partner selling hard to dismiss, while KPMG’s 36% measurement result makes it equally hard to claim most programs can prove their contribution.
Adoption is not contribution
Salesforce also reported that 89% viewed partner selling as increasingly important to revenue targets and that 90% of sales professionals working with partners used dedicated tools. However, those three figures describe use, perceived importance and software adoption. None supplies a sourced-revenue percentage, partner activation rate or contribution margin.
The practical response is to stop using tool ownership as the maturity threshold. A program becomes measurable when partner identity survives from the first eligible event through account matching, opportunity creation, transaction and renewal. Software can hold those fields, but it cannot decide the definitions.
Intent is not realized investment
KPMG’s 90% global expansion plan and PartnerStack’s 69% investment plan point in the same direction. Yet each is an intention measured in a different population and over a different horizon. A plan can be delayed, reduced or redirected without making the survey inaccurate.
Use intention statistics to test strategic consensus, not to set your budget. Your spend case still needs the number of active partners, expected opportunities per active partner, gross margin, incentive cost, enablement cost and the time required to reach first qualified pipeline.
Measure the operating gap before adding partners
Meanwhile, a growing network can hide falling productivity when the denominator is total enrolled partners. Report at least four layers separately: recruited, enabled, active and revenue-producing partners. Then add concentration, because a program where three partners produce 80% of pipeline behaves differently from one with broad contribution.
- Activation rate: partners completing a defined commercial action ÷ enabled partners.
- Pipeline productivity: qualified sourced pipeline ÷ active partners.
- Influence coverage: unique influenced opportunities ÷ eligible opportunity cohort.
- Contribution margin: partner-attributed gross profit minus incentives and program costs.
- Concentration: share of sourced pipeline produced by the top five partners.
KPMG’s 71% goal-alignment result suggests why these layers matter. A larger ecosystem without shared goals, data ownership and review cadence can create more records while making accountability weaker.
Revenue benchmarks change with the numerator
Partner revenue changes when the numerator changes from originated opportunities to touched opportunities or transacted orders. That is why a single company can report a modest sourced share, a much larger influenced share and a large indirect share without any contradiction.
Sourced is the narrowest defensible claim
A sourced claim should require an origin event that existed before the opportunity or at its creation. Examples include an accepted referral, a partner-created lead, registered demand or a marketplace private offer that introduced a previously unknown opportunity. Late registration after sales has already opened the deal should not rewrite origin.
PartnerStack’s 35% figure fails as a sourced benchmark because the published wording combines sourced and influenced pipeline. The correct sentence is that respondents attributed 35% of new pipeline to either category. Removing the word influenced would materially change the finding.
Influenced revenue needs overlap rules
Influence expands the eligible event set, so it usually produces a larger percentage. The model might credit technical validation, an implementation partner, an account-map signal, a joint event, a co-sell call or marketplace support. Unless the window and qualifying events are fixed, teams can increase influence by changing policy rather than changing performance.
PartnerStack’s attribution split shows how much policy varies: 42% used multi-touch, 31% first-touch, 19% last-touch and 8% another method or none. The same deal can therefore produce different credit under different rules, which is the central problem addressed in IVRIS’s guide to B2B marketing attribution.
Indirect revenue describes the transaction route
Forrester carefully separates revenue transacted by partners from partner-influenced revenue. Its 67% finding is the share of surveyed leaders expecting indirect revenue growth above 30% year over year, while roughly two-thirds expected the same growth threshold for influenced revenue. These are two forecasts about two metrics, not one universal revenue percentage.
Co-sell should remain a motion field beside those measures. A co-sold opportunity may be direct, indirect or marketplace-transacted; it may also be sourced by the vendor and influenced by the partner. Treating “co-sell revenue” as mutually exclusive without a clear hierarchy creates another overlap problem.
| Unsafe headline | Defensible replacement |
|---|---|
| Partners source 35% of B2B SaaS pipeline. | In a 100-leader B2B SaaS study, respondents attributed 35% of prior-quarter new pipeline to partner-sourced or partner-influenced activity. |
| 67% of B2B revenue is indirect. | Forrester reported that 67% of surveyed leaders expected indirectly transacted revenue to grow by more than 30% year over year. |
| Two-thirds of revenue is partner-influenced. | Roughly two-thirds of surveyed leaders expected partner-influenced revenue to grow by more than 30% year over year. |
| Co-sell revenue is a separate revenue channel. | Co-sell is an operating motion that needs a second field for origin, influence and transaction route. |
Decision rule
Never add sourced, influenced and indirect percentages together. Report unique opportunities and revenue at each layer, show the overlap, and make one person responsible for the hierarchy. The total partner-connected amount should be a deduplicated union, not a sum of labels.
Partner deal performance is an association, not a lift
Partner deal-performance statistics compare observed cohorts; they do not automatically estimate what would have happened to the same opportunity without a partner. Ebsta’s 3.8-times sales-velocity result is valuable evidence, but the public method does not isolate a causal effect.
Why a large difference can be real and non-causal
Ebsta analyzed 4.2 million opportunities from 530 companies, more than one million hours of conversations and over $54 billion in revenue. The partnership lead-source category moved at 3.8 times the overall sales-velocity benchmark. That scale makes the association worth investigating.
Still, partner opportunities may enter with warm introductions, stronger account fit, larger deal values, later registration, established services relationships or better executive access. Any of those factors can improve velocity while also making partner involvement more likely. The report does not publish a randomized comparison or a matched counterfactual.
Run a matched cohort before changing budget
- Freeze the source rule. Exclude opportunities whose partner source was added after opportunity creation unless late registration is the stated policy.
- Match the commercial context. Compare the same segment, region, product, acquisition period and approximate contract-value band.
- Separate the velocity components. Report win rate, average deal value and cycle length beside the combined velocity metric.
- Keep direct and partner-assisted direct deals distinct. A partner overlay on a vendor-sourced deal answers a different question from a partner-originated opportunity.
- Repeat across cohorts. A single quarter can be dominated by one partner, launch or enterprise deal.
If the matched difference persists, you have a stronger budget signal. You still have an observational result, but you will know whether the headline survives basic controls rather than assuming the channel caused everything attached to it.
Partner marketing budgets outpace measurement
Partner marketing budgets can be large even when attribution remains weak. Foundry’s 2024 study puts that tension in one population: an average 37% of marketing budget went to partner marketing, while 89% reported measurement barriers.
The 37% figure is not an all-B2B average
Foundry surveyed 353 technology marketing leaders who give or receive partner-marketing funds. This is exactly the population you would expect to have established programs and material spend. Quoting 37% as the normal budget share for every B2B company would erase the selection rule.
Still, the historical comparison is useful within the series: 37% in the 2024 study against 28% in 2014. It shows greater budget weight among surveyed partner marketers, not a ten-year market-share estimate for the whole B2B economy.
The 89% and 71% figures explain the control gap
Foundry found 89% experienced at least one measurement barrier and 71% found it difficult to establish a point of inquiry tying pipeline to a specific partner. Those results explain why budget and attribution can move in opposite directions: funds can be allocated by strategic priority while proof still depends on incomplete partner and opportunity data.
Build the identifiers before the campaign
Every partner campaign needs a partner ID, program ID and campaign ID before traffic or leads arrive. Carry those identifiers into account matching, opportunity contact roles, deal registration and cost records. Free-text partner names are not a reporting system.
Then specify the point of inquiry. Is the partner credited when a lead enters, an account is matched, a meeting happens, an opportunity opens or revenue closes? One event should trigger sourced status; a different set may trigger influence. Without that separation, the pipeline report answers whichever question the analyst happens to encode.
Technology, AI and marketplaces widen the ecosystem
Technology, AI and cloud marketplaces expand the number of roles a partner can play inside one buying journey. They also increase the risk that presence, priority, facilitation and revenue are reported as though they were the same outcome.
Preserve KPMG’s wording on technology partners
“Technology dominates 80 percent of respondents’ partner ecosystems.”
That sentence is stronger and safer than rewriting the result as “80% of partners are technology companies” or “technology partners drive 80% of ecosystem revenue.” KPMG’s wording describes what dominates the ecosystems represented in its survey. It does not publish partner counts, activity shares or revenue contribution for that 80%.
KPMG’s 69% AI figure is a future priority
KPMG states that using partnerships to expand AI use cases will be a priority during the next one to three years, cited by 69% of respondents. The time horizon is part of the statistic. It cannot be shortened into “69% currently use AI partnerships” without changing intention into adoption.
For operating plans, split the AI question into three states: exploring a partner, running a controlled use case and deploying into production. Then attach a business outcome and risk owner. A priority list can guide portfolio design, but it cannot substitute for adoption or return data.
Marketplace sales are transaction value, not vendor revenue
Omdia estimated $30 billion in enterprise software sales through hyperscaler marketplaces in 2024 and forecast $163 billion by 2030. It also forecast that partners would facilitate nearly 60% of marketplace transactions by 2030. The 2024 number is an actual modeled base; the 2030 numbers are forecasts.
Therefore, a marketplace record should carry four separate fields: who originated the opportunity, who influenced it, who facilitated the private offer or procurement and where the transaction occurred. A distributor or services partner can facilitate the order without sourcing the buyer, while a technology partner can influence the decision without appearing in the transaction path.
Build a partnership benchmark finance can audit
A finance-ready partnership benchmark is a metric contract followed consistently, not a percentage borrowed from a roundup. Build the contract before setting the target, then compare your result only with sources that ask the same question of a similar population.
Write the metric contract
- Name the business question. Decide whether you are evaluating demand origin, decision influence, transaction route, program productivity or contribution margin.
- Define the partner population. State the partner types included and whether inactive, newly recruited or marketplace-only partners remain in the denominator.
- Define the eligible event. Record what qualifies as source or influence and which system owns the timestamp.
- Fix the cohort and window. Use the same creation period, close period or renewal cohort for numerator and denominator.
- Deduplicate the account and opportunity. One deal can have several partners and events, but it should not become several dollars of unique revenue.
- Choose the credit rule. State whether the report is binary, fractional, first-touch, last-touch or multi-touch.
- Publish the caveat beside the result. Include sample size, exclusions, missing fields and forecast status in the same table as the percentage.
Report a contribution waterfall
Start with unique partner-sourced revenue. Add influenced-only revenue that was not sourced by a partner. Then show transaction-only revenue that was neither sourced nor influenced under your rules. Keep co-sell and marketplace facilitation as descriptive overlays unless they form mutually exclusive categories.
This waterfall lets finance see the narrowest attributable contribution and the broader connected footprint without pretending every layer is incremental. It also prevents the common mistake of summing overlapping labels into a number larger than total company revenue.
Turn definitions into a decision-grade metric set
Your final dashboard should pair contribution with cost and quality: active-partner productivity, sourced pipeline, influence coverage, win rate, cycle length, average contract value, retention, incentives and contribution margin. IVRIS’s framework for B2B marketing metrics explains how to assign each measure a decision, owner, source and review cadence.
Do not force every partner type into one average. A referral partner, global systems integrator, distributor, cloud marketplace and technology alliance have different jobs. Compare each motion with its own cohort first; aggregate only after the definitions are stable.
Methodology and revision note
IVRIS reviewed 165 candidate statistics across primary surveys, analyst research, public-company disclosures and vendor studies. We selected the 18 above for relevance, traceability and distinct decision value, then rechecked prominent and recent findings against the primary publisher. Claims that lacked a recoverable origin, mixed incompatible metrics or converted association into causation were excluded.
Samples and methods vary, so this page does not calculate a pooled average. Forecasts are labeled as forecasts, intentions remain intentions, and transaction value remains separate from net revenue. A supplementary claim list was reviewed, but no headline figure from it was used without an independently opened primary source; none was needed for the final register.
Evidence checked 25 August 2026. This page should be reviewed when a source changes its public report, when a new large-sample benchmark is released or when a claim can no longer be traced to its original publisher. The URL and metric taxonomy should remain stable so corrections do not break citations.
Frequently Asked Questions
No credible source establishes one universal percentage. Partner-sourced, partner-influenced, indirectly transacted and marketplace revenue use different numerators and can overlap on the same deal. A usable benchmark must name the partner type, attribution rule, population and period before the percentage can be compared.
Partner-sourced revenue begins with a qualifying partner origin event, such as an accepted referral or registered opportunity. Partner-influenced revenue includes deals where an eligible partner interaction affected the buying journey. Influenced is usually broader, so the two percentages should be reported separately and deduplicated.
Ebsta found the partnership lead-source category had 3.8 times the overall sales velocity in its large 2024 analysis. That is an association, not proof of causal lift. Partner deals may differ in account fit, deal size, introduction quality or registration timing, so matched cohorts are needed.
No. KPMG says using partnerships to expand AI use cases will be a priority during the next one to three years for 69% of respondents. The statistic measures future priority, not current adoption, production deployment or financial return from an AI partnership.
Start with a written metric contract for source, influence, transaction route, cohort and credit rule. Report unique sourced revenue, influenced-only revenue and transaction-only revenue separately, then pair them with incentives, program costs, gross margin, cycle length and retention to calculate contribution rather than headline volume.