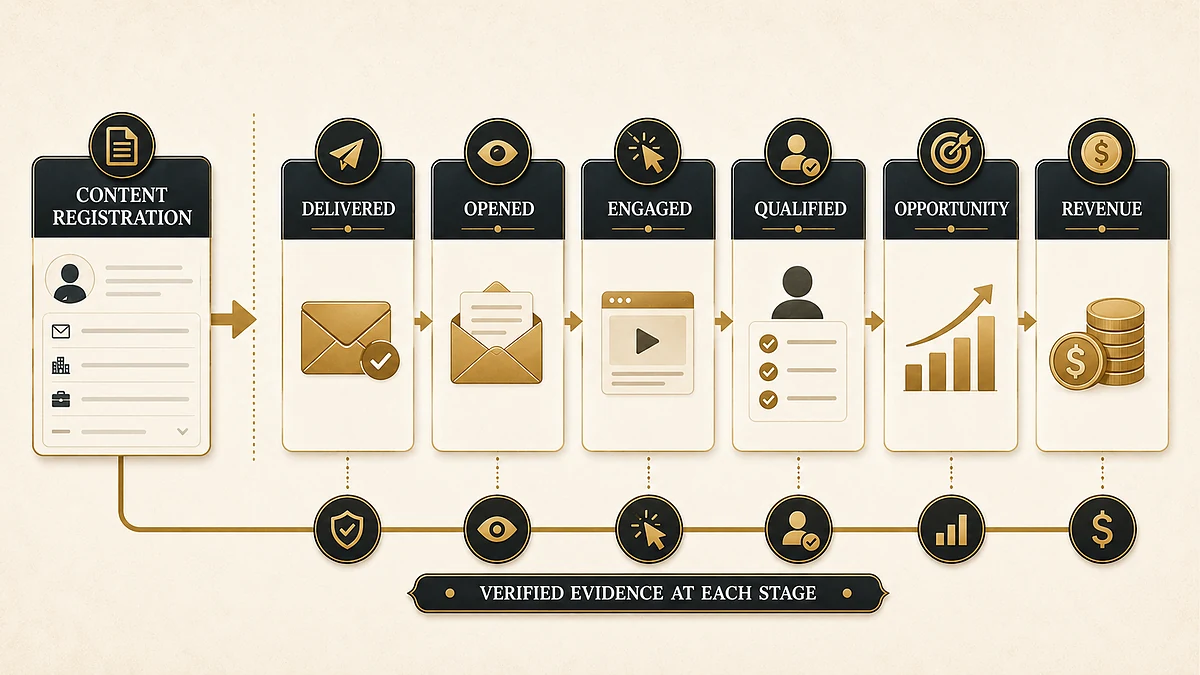
Search results for B2B content syndication statistics often promise a neat cost per lead, conversion rate, or return on investment. The problem is that many of those numbers skip the denominator, the population, the stage definition, or the original dataset. A registration then gets treated as a qualified lead, and a calculator scenario gets repeated as observed revenue.
IVRIS reviewed 198 candidate evidence entries, removed duplicates, traced the strongest claims back to primary sources, and separated channel-specific data from broader buyer, webinar, and lead-data research. The result is smaller than most statistics roundups, but each retained number has a defined event, population, and limit.
Direct answer — what B2B content syndication benchmarks hold up in 2026?
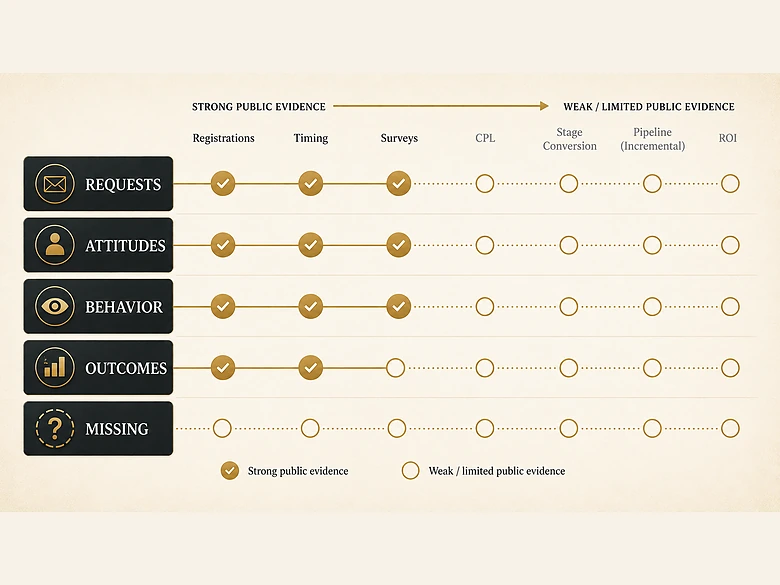
Reliable public benchmarks exist for registrations, request-to-first-open time, format mix, stated purchase horizon, and some buyer and marketer attitudes. There is no defensible universal benchmark for CPL, MQL-to-SQL conversion, pipeline multiple, or ROI. Those outcomes depend on targeting, stage definitions, validation, follow-up, attribution, and sales-cycle length.
Key Takeaways
- NetLine recorded 7.2 million B2B content registrations in 2025, but a registration proves a data exchange, not an open, a qualified lead, or revenue.
- The average interval from request to first open was 47.7 hours in one large commercial network, up 23.9% year over year.
- Among NetLine respondents who supplied a purchase horizon, 45.9% selected a window within 12 months and 7.0% selected under three months. These were declarations, not observed purchases.
- Marketer and buyer surveys show both appetite and friction: 34% of one U.S./U.K. marketer sample used syndication, while Foundry IT buyers said 51% of work-related content downloaded in the prior 6–12 months ultimately provided actionable information.
- No universal public 2026 CPL, conversion, opportunity, pipeline, or ROI benchmark survived a source-and-denominator audit.
B2B Content Syndication Statistics at a Glance
The strongest 2026 content syndication evidence describes observable requests, timing, formats, stated horizons, and surveyed attitudes. The table below keeps each result attached to the population that produced it and states what the number cannot establish.
Thirteen findings worth using
| Finding | Population and source | What it measures | What it does not prove |
|---|---|---|---|
| 34% used content syndication for lead generation | 424 B2B marketers in the U.S. and U.K.; Pipeline360 H2 2024 survey | Reported channel adoption in that sample | Market-wide adoption, usage depth, or causal performance |
| 78% of users were satisfied or very satisfied with lead quality; 35% of non-users cited poor quality | The same 424-person Pipeline360 sample | User and non-user perceptions | Record validity, sales acceptance, conversion, or revenue |
| 7.2 million registrations in 2025 | NetLine’s commercial B2B network; 2026 consumption report | Registration events across one network | Unique buyers, first opens, completed reads, opportunities, or purchases |
| 47.7 hours from request to first open, up 23.9% year over year | NetLine 2025 network telemetry | Mean request-to-first-open interval | Reading depth, positive intent, or the right sales-call delay |
| 45.9% selected a purchase horizon within 12 months; 7.0% selected under three months | NetLine respondents who answered a purchase-horizon question | Self-declared timing | An observed buying event or a conversion probability |
| The six-to-twelve-month share rose 78.6% year over year | NetLine purchase-horizon respondents | Relative change in one declared-horizon band | A 78.6-point increase or a matching lift in revenue |
| eBooks produced 48.8% of registrations | NetLine 2025 network telemetry | Share of registration volume by format | That eBooks created the best leads or highest commercial return |
| Average registrations per offer were 859.1 for eBooks versus 63.5 for white papers | NetLine offer-level averages | Requests per available offer inside that network | A controlled format test; inventory, placement, topic, and promotion differed |
| Trend-report registrants were 177% more likely than baseline to select six to twelve months; live-webinar registrants were 20% more likely to select under three months | NetLine format-to-declared-horizon associations | Association with a stated time band | That the format caused readiness or produced an opportunity |
| 83% said they were somewhat or very likely to complete a form for valuable content | Demand Gen Report 2024 Content Preferences Survey; public sample details not disclosed | Stated willingness to register | Actual form completion, content use, or consent quality |
| 51% of downloaded work-related content ultimately provided actionable information over the past 6–12 months; 75% were more likely to consider an IT vendor that educated them through each stage of the decision process | 676 IT decision-makers across North America, EMEA, and APAC; Foundry’s 12th annual Customer Engagement Study, pages 5 and 7 | Reported content actionability and education-led vendor consideration | Content-syndication consumption, a channel conversion rate, or a result for every B2B market |
| 60% average webinar registration-to-attendee conversion | Adjacent evidence: ON24’s 2026 Webinar Benchmarks summary, based on 2025 platform data | Attendance among webinar registrations in ON24’s platform population | A content-syndication first-open or consumption rate, or a universal webinar benchmark |
| 73% of marketers said their lead data was inaccurate or outdated | Adjacent evidence: Integrate’s State of Marketing Data report; research from 200+ B2B marketing leaders | Broad self-reported marketing-data quality concern across lead sources | That 73% of content-syndication registrations are invalid, or any downstream conversion rate |
How to read this table
These findings do not form one pooled benchmark. NetLine reports network events, Pipeline360 reports marketer opinions, Demand Gen Report reports stated registration willingness, Foundry reports technology-buyer assessments, ON24 reports webinar behavior, and Integrate reports broad marketing-data problems. Combining them into a synthetic “average syndication funnel” would erase the very distinctions that make the data usable.
IMPORTANT
A source can be credible and still answer the wrong question. A large registration dataset is strong evidence about requests. It is not automatically evidence about reading, qualification, opportunity creation, or revenue.
What B2B Content Syndication Statistics Actually Measure
B2B content syndication is the paid or partner-led distribution of educational assets through third-party publishers or networks to generate named registrations, engagement signals, declared timing, or leads from a defined business audience. This article does not cover duplicate article republishing for SEO, press-release distribution, paid search, paid social, or generic organic content promotion.
Evidence classes are not interchangeable
Network telemetry records what happened inside a platform. Surveys record what respondents remember, believe, or say they intend to do. Platform benchmarks describe a vendor’s customer base. Case studies describe selected campaigns. Each can be useful when the claim stays inside its evidence class.
| Evidence class | Good use | Unsafe extension |
|---|---|---|
| Network telemetry | Registration volume, first-open timing, format request mix | Calling every registration a buyer, MQL, or opportunity |
| Marketer survey | Adoption, satisfaction, concerns, operating practices | Presenting satisfaction as measured lead quality or ROI |
| Buyer survey | Content preferences, perceived value, declared willingness | Claiming observed channel conversion or purchase causality |
| Platform benchmark | Behavior inside one vendor’s customer base | Treating the result as a cross-platform industry average |
| Customer case study | Showing that an outcome is possible under stated conditions | Calling a selected result typical without a denominator or control |
| Unsourced compilation | Finding claims that need investigation | Using the compilation itself as statistical evidence |
This is also why broad B2B buyer-behavior evidence should inform the content offer and buying context without being relabeled as a syndication conversion benchmark.
The measurement ladder has eight separate states
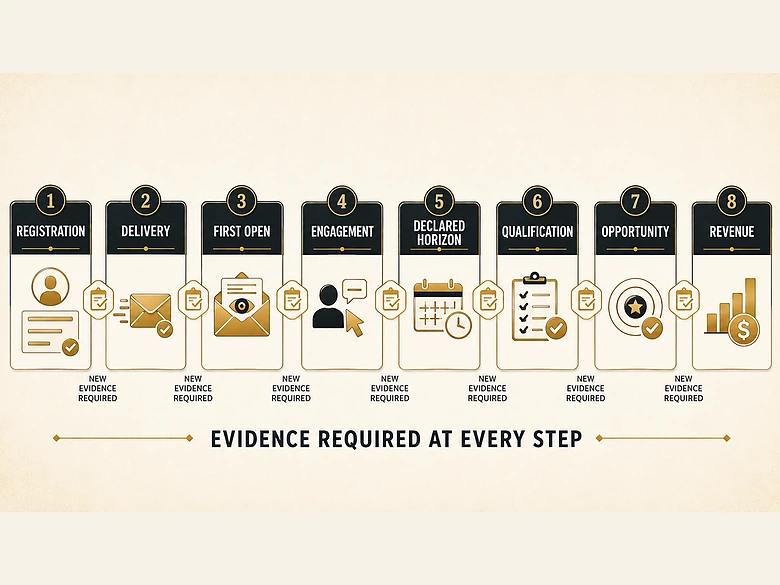
The minimum defensible ladder is registration → delivery → first open → engagement/consumption → declared purchase horizon → qualification → opportunity → revenue. Every arrow requires a new observation. No stage can be inferred merely because the preceding stage occurred.
| Stage | Observable event | What it establishes | What remains unknown |
|---|---|---|---|
| Registration | A person submits or supplies required details for an asset | A data exchange occurred | Whether the record is valid, the asset arrived, or the person engaged |
| Delivery | The lead record and asset are successfully delivered | The promised item and data reached their destinations | Whether either was opened or trusted |
| First open | The asset or delivery message is first opened | Initial access | Reading depth, usefulness, positive intent, or buying authority |
| Engagement/consumption | Meaningful time, completion, interaction, repeat use, or another defined threshold | Some level of content use | Commercial readiness or fit |
| Declared purchase horizon | The person selects a stated decision window | A self-reported time preference | Whether the answer is accurate or becomes a purchase |
| Qualification | Published fit and behavior rules are met, then marketing and sales accept the record under named definitions | Eligibility for the next commercial step | Whether an opportunity will be created |
| Opportunity | Sales creates a qualified deal under a CRM rule | A commercial process exists | Whether it will close, how much will be credited, or whether syndication was incremental |
| Revenue | A deal closes and revenue or gross profit is recorded | A business outcome occurred | Causal credit, incrementality, and the channel’s share of value |
A content registration is evidence of a data exchange. It is not automatic evidence of content consumption, buyer intent, an MQL, pipeline, or revenue.
Qualification needs its own internal steps
The qualification row can contain several company-defined states: MQL, sales-accepted lead, SQL, and sometimes a meeting or discovery stage. Those labels are not portable unless the entry and exit rules match. A team that marks every content download as an MQL will report a different MQL-to-SQL rate from a team that requires account fit, multiple engagements, and a stated project.
That denominator problem is the core distinction in the MQL-versus-SQL handoff. A syndication report should publish the exact stage contract before it publishes the rate.
Adoption, Content Value and Lead Quality Statistics
Adoption and quality statistics mostly describe marketer perceptions and buyer attitudes, not audited funnel results. They show why teams use the channel, why others distrust it, and where operating controls matter.
One disclosed adoption survey found 34% usage
According to Pipeline360’s H2 2024 survey, 424 B2B marketers in the United States and United Kingdom were surveyed between May and July 2024. Thirty-four percent said they used content syndication for lead generation. Among users, 78% said they were satisfied or very satisfied with lead quality. Among non-users, 35% cited poor lead quality as a reason they did not use it.
What it measures: Reported adoption and perception inside one disclosed sample. What it does not prove: The survey does not audit email validity, ICP fit, sales acceptance, stage conversion, or revenue. Users and non-users also answer from different experience bases.
What it means for demand-gen teams: Lead quality is both a reason to buy and a reason to abstain, so vendor evaluation cannot stop at audience reach or quoted CPL. Operational change: Put validity, duplicate handling, fit fields, consent evidence, delivery time, and replacement rules into the campaign contract before launch.
Registration willingness is higher than delivered content value
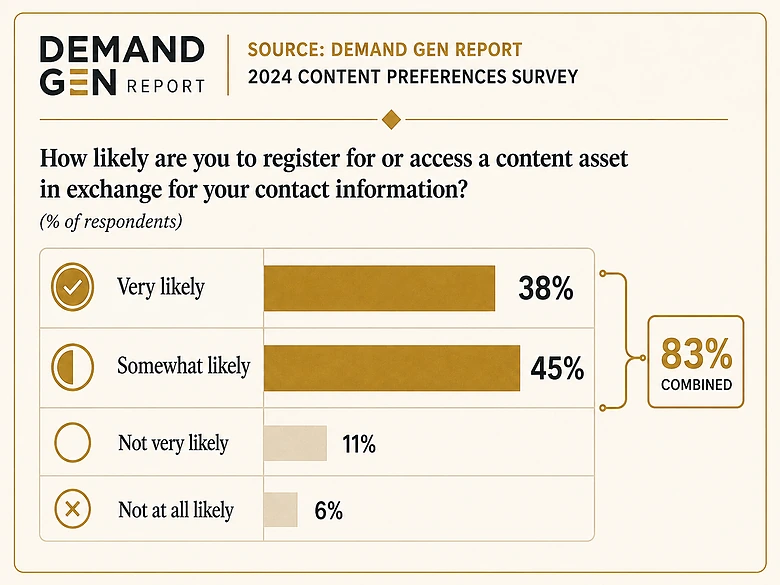
Demand Gen Report’s 2024 survey found that 45% were “somewhat likely” and 38% were “very likely” to complete a form for content they considered valuable, a combined 83%. The public report does not disclose sample size, geography, or full fieldwork details, so the figure is useful as an attitude signal, not a population estimate.
Foundry’s 12th annual Customer Engagement Study adds the harder part. The full report identifies an online survey of 676 IT decision-makers in North America, EMEA, and APAC, all involved in major technology or security purchases. On page 5, respondents reported that 51% of work-related content downloaded in the past 6–12 months had ultimately provided actionable information. On page 7, 75% said they were more likely to consider an IT vendor that educated them through each stage of the decision process.
What it measures: Demand Gen Report measures stated willingness to register; Foundry measures IT buyers’ reported content actionability and education-led vendor consideration. What it does not prove: Neither survey shows that a registration was opened, consumed, accepted by sales, or converted because it was syndicated.
What it means for demand-gen teams: Gating can produce records even when the asset later disappoints. Operational change: Judge the asset on usefulness after the form, not only on form completion. Capture downstream signals such as first open, repeat request, account breadth, and a short usefulness question where consent and user experience permit.
Webinar attendance shows why registration cannot equal consumption
ON24’s 2026 benchmark summary reported a 60% webinar registration-to-attendee rate across digital experiences on its platform. This is not a content syndication benchmark, but it demonstrates the missing stage with a format where attendance is observable: four out of ten registrations did not become attendance under that platform-level average.
What it measures: Attendance among registrations in one webinar platform’s customer base. What it does not prove: It does not supply an eBook open rate or a cross-network content-consumption rate. Operational change: Keep registration and attendance separate in webinar reporting, as detailed in the B2B webinar lead-generation workflow.
Broad lead-data problems make cheap registrations expensive
Integrate’s State of Marketing Data report says 73% of surveyed marketing leaders described lead data as inaccurate or outdated, and more than 60% said bad data disrupted handoffs. The sample covered more than 200 senior marketing operations and demand-generation leaders. The survey spans lead sources, so it cannot be used as a syndication invalid-rate benchmark.
What it measures: Broad operational concern about marketing data and handoffs. What it does not prove: It does not show that 73% of syndication records are bad. Operational change: Validate business email, person, company, role, geography, duplicate status, consent fields, and source timestamp before routing a record. The same distinction sits at the center of B2B lead-validation criteria.
Registration, Timing and Format Statistics
Network telemetry is the strongest public evidence in this category because it records requests and first opens at scale. Its strength still stops at the edge of the network event unless later commercial stages are joined under declared definitions.
NetLine recorded 7.2 million registrations in 2025
NetLine’s 2026 report covers 7.2 million first-party B2B content registrations across its commercial network during calendar 2025. Volume fell 8.6% from roughly 7.9 million in 2024 but remained 57.6% above 2021. Those figures show activity inside one large network, not the size of the entire syndication market.
What it measures: Registration events processed by NetLine. What it does not prove: The report does not say that 7.2 million unique people read content or became leads under one company’s CRM definition. Multiple requests by the same person can also create multiple events.
What it means for demand-gen teams: Registration scale is real, but raw volume is the earliest denominator. Operational change: Store person and account identifiers, vendor, asset, request timestamp, delivery timestamp, and duplicate history so later rates can use deduplicated cohorts.
The average request-to-first-open interval was 47.7 hours
NetLine calls this interval the “Consumption Gap,” but the report defines it as time between request and first open. The 2025 mean was 47.7 hours, nine hours longer than 2024 and 23.9% higher year over year. First open is a cleaner label because opening an asset does not reveal completion or depth.
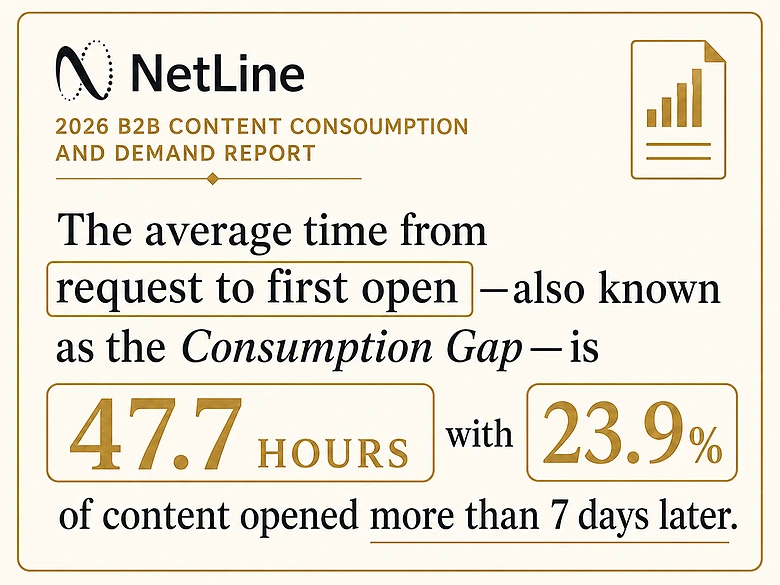
What it measures: Mean delay from request to first recorded open in the NetLine network. What it does not prove: It is not a recommendation to wait 47.7 hours before delivering the asset, validating the record, or responding to an explicit request for sales contact.
What it means for demand-gen teams: Educational requests often mature more slowly than demo or contact requests. Operational change: Deliver the asset immediately, verify the record promptly, and separate service follow-up from sales escalation. Route high-fit, explicit short-horizon or direct-contact requests differently from a registration with no further signal.
Declared purchase horizon is useful, but it is still declared
Among NetLine respondents who answered a purchase-timeline question, 45.9% selected a window within 12 months and 7.0% selected under three months. The six-to-twelve-month share rose 78.6% year over year, a large relative change from a smaller base.
What it measures: A voluntarily supplied time band at the point of registration. What it does not prove: The response is not an observed opportunity, buying committee, budget, or closed deal. The denominator is timeline respondents, not automatically all 7.2 million registrations.
What it means for demand-gen teams: Declared horizon can help order follow-up without pretending it is a forecast. Operational change: Store the original question, answer options, timestamp, and “not sure” response. Test how each band later relates to sales acceptance and opportunities in your own cohorts.
Format request volume and commercial timing move differently
eBooks accounted for 48.8% of NetLine registrations in 2025. NetLine also reported an average of 859.1 registrations per eBook offer versus 63.5 per white-paper offer, more than a thirteen-fold difference. That is an offer-level network result, not a randomized test: the number of available offers, subject matter, placement, creative, audience, and promotion can all differ.
The same report found that trend-report registrants were 177% more likely than baseline to select a six-to-twelve-month horizon, while live-webinar registrants were 20% more likely to select a horizon under three months. These are associations with declared timing, not proof that one format caused readiness.
A useful sequence finding comes from NetLine’s 2024 report: among eBook requesters who made another request, 96.4% selected a different format next. The condition matters. It does not mean 96.4% of all eBook registrants returned; it describes the next choice among people who did return.
What it measures: Request share, requests per offer, format-to-horizon association, and conditional next-format behavior. What it does not prove: A high-volume format is not automatically the best source of accepted leads or revenue.
Operational change: Report each format on at least four axes: registrations, substantive engagement, accepted leads, and opportunities. Use a format sequence rather than sending every registrant another asset of the same type.
Why CPL, Conversion and ROI Benchmarks Fail
A universal content syndication benchmark fails when the numerator, denominator, population, and attribution rule change from one campaign to the next. The public pages offering the most precise commercial numbers often disclose the least information needed to compare them.
A quoted CPL is meaningless until the lead unit is named
A $40 registration can mean a delivered form fill, a validated business contact, an ICP-matched person, a phone-confirmed lead, a marketing-qualified lead, or a sales-accepted lead. Geography, seniority, industry, named-account targeting, content type, intent questions, replacement terms, minimum volume, and delivery speed also change price.
Even the denominator “leads” can hide rejected records. A campaign spending $20,000 for 500 delivered registrations has a delivered CPL of $40. If only 350 pass validation and 175 are accepted by sales, the same spend produces a validated CPL of $57.14 and a cost per accepted lead of $114.29 before follow-up labor.
Campaign spend ÷ delivered registrations(Campaign spend + validation cost + attributable follow-up cost) ÷ sales-accepted leadsConversion rates fail when the stage contract changes
A “lead-to-SQL” rate cannot be compared when one team starts with every registration and another starts after validation, scoring, and marketing acceptance. It also changes when SQL means a booked meeting, an attended meeting, a sales-qualified conversation, or an opportunity.
The safe reporting pattern is a chain of named rates: delivered-to-valid, valid-to-fit, fit-to-marketing-qualified, marketing-qualified-to-sales-accepted, sales-accepted-to-SQL, SQL-to-opportunity, and opportunity-to-win. Publish counts beside rates so a small denominator cannot masquerade as a stable benchmark.
Pipeline and ROI need attribution and time
Pipeline can mean sourced pipeline, influenced pipeline, open opportunity value, weighted pipeline, or a model’s projected value. Revenue can be booked, recognized, annual contract value, total contract value, or gross profit. An ROI calculation also needs the observation window and all attributable costs.
Fully loaded channel cost ÷ sourced opportunities created within the stated window(Attributable gross profit - fully loaded channel cost) ÷ fully loaded channel cost × 100These formulas belong beside the broader distinctions in B2B marketing metrics. They are operating definitions, not external market averages.
IMPORTANT
Two campaigns can report the same $40 CPL and have opposite economics. One may deliver valid, accepted contacts that create opportunities; the other may deliver duplicates and off-target records. Raw CPL hides the difference.
Popular commercial claims that did not survive the audit
The following claims remain visible on 2026 pages. They are not necessarily fabricated. They were excluded as universal benchmarks because the original dataset, stage definition, denominator, sample, or attribution method was absent or insufficient for market-wide use.
| Published claim | Where it appears | Why IVRIS excluded it as a universal benchmark |
|---|---|---|
| $25-$60 typical CPL, 77% MQL-to-SQL, up to 12x ROI, and a $10,000 budget producing up to $200,000 pipeline | ContentSyndication.org statistics page | The page says figures include its campaigns but does not disclose campaign count, lead-stage contract, distribution, validation rules, opportunity definition, or attribution method. The budget-to-pipeline table is an assumption model. |
| $25-$80 CPL, 3%-8% lead-to-SQL, and multiple channel comparisons | Sotros 2026 benchmark article | The page attributes figures to managed campaigns but gives no client count, campaign count, spend distribution, geography mix, validation rules, or fixed SQL definition. It is portfolio evidence, not a representative market sample. |
| $43 average CPL and 5.31% conversion rate | Repeated across Marketricka and other vendor or agency pages, including secondary claim chains reviewed in the research package | The claimed Demand Metric and MarketingSherpa originals could not be located in the supplied audit or live primary-source refresh. A precise number without a retrievable original and metric definition is not publication-ready evidence. |
| 300%-500% ROI, 35% revenue lift, 62% conversion uplift, and similar ranges | Vendor summaries, selected cases, and roundup pages | Most lacked a representative population, counterfactual, full cost base, time window, or causal attribution. A case can show possibility; it cannot establish a universal expectation. |
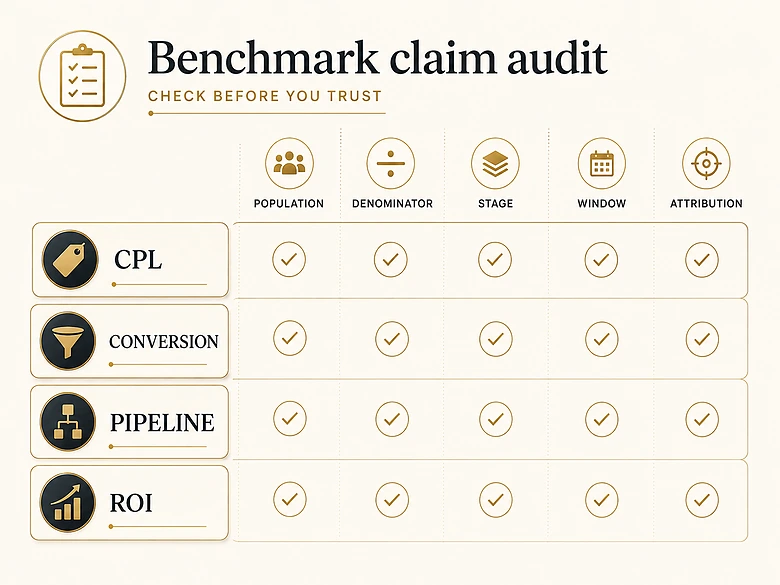
The practical answer is not to replace one weak range with another. Build an internal benchmark with fixed definitions, report distributions rather than one average, and preserve vendor, asset, geography, targeting depth, and cohort date.
What Demand-Gen Teams Should Change
A sound syndication program treats each stage as an operating handoff with an owner, timestamp, acceptance rule, and next action. The goal is not to make registration look more valuable. It is to discover where value is created or lost.
Write the measurement contract before buying media
The campaign brief should define the target account and contact profile, excluded records, source timestamp, asset and landing context, consent fields, delivery schedule, duplicate window, business-email rules, phone requirements, replacement policy, suppression process, and every question used to infer fit or timing.
It should also define the commercial stages in plain language. “MQL” is not enough. State whether it requires a valid business identity, ICP match, target role, engagement threshold, declared project, account activity, or manual review. State who can reject it and why.
Separate service delivery from sales escalation in the first 48 hours
Send the requested asset and source context immediately. Validate and deduplicate the record as soon as it arrives. Confirm that the follow-up identifies the asset, publisher or network, and date so the recipient can recognize the interaction.
A registration with no additional signal should enter an educational follow-up sequence. A high-fit record with an explicit near-term horizon, direct-contact request, or repeated account engagement can receive a different route. The 47.7-hour first-open mean does not justify delaying fulfillment, and it does not justify an instant sales call to every registrant.
Track cohorts by vendor, asset, audience and quarter
Aggregate channel averages conceal the variables teams can control. Build cohorts by vendor, asset, format, topic, geography, seniority, account tier, declared horizon, delivery month, and follow-up path. Keep both person-level and account-level views because multiple contacts consuming related assets can matter more than one isolated form fill.
Report medians and percentiles for time-to-stage metrics. Report counts beside rates. Keep sourced pipeline separate from influenced pipeline. Retain rejected and replaced records so effective cost is not calculated only on the vendor’s delivered count.
Use one operating table across marketing, operations and sales
| Stage | Primary owner | Minimum evidence | Required action |
|---|---|---|---|
| Registration | Publisher/network + demand gen | Form event, asset, source, timestamp, consent fields | Deliver asset; retain source context |
| Delivery | Marketing operations | Successful record and asset delivery | Log delivery; reject technical failures |
| First open | Marketing operations | Defined open event | Record timing; do not infer depth |
| Engagement/consumption | Demand gen | Published threshold such as meaningful time, completion, interaction, repeat request, or account breadth | Advance education or scoring only under the threshold |
| Declared purchase horizon | Demand gen + operations | Original question and response | Use for routing; test later accuracy |
| Qualification | Marketing + sales | Valid identity, fit, behavior, and named acceptance rules | Accept, reject, recycle, or replace with a coded reason |
| Opportunity | Sales | CRM opportunity rule met | Record source, influence, value, and creation date |
| Revenue | Finance/revenue operations | Closed outcome and value definition | Calculate return with stated attribution and full cost |
This operating model extends the gated-asset mechanics in content marketing for lead generation by making the stages after registration measurable rather than assumed.
Methodology and Statistics Still Missing
This evidence audit used source quality and measurement clarity as inclusion criteria. A smaller set of well-defined statistics is more useful than a longer list that mixes registrations, leads, opportunities, and revenue.
How the evidence set was built
IVRIS reviewed 198 candidate entries from a primary research package and a supplementary workbook. Duplicate claims were consolidated. Headline figures were re-fetched from original reports or official source pages on August 25, 2026. Each retained claim was coded for source class, data period, sample or population, geography, metric, methodology, evidence strength, and caveat.
Primary network telemetry received the most weight for request and timing questions. Disclosed surveys received weight for attitudes and adoption. Platform data was kept inside its platform population. Customer cases were treated as possibility evidence. Secondary claims without a retrievable original, stable denominator, or clear stage definition were excluded from the benchmark set.
No proprietary IVRIS campaign dataset was used. The article does not claim that weak public evidence means private vendor or company data does not exist. It means a universal public benchmark could not be stated safely from the evidence reviewed.
The most important public statistics are still missing
- A cross-network registration-to-first-open rate with one open definition.
- Substantive engagement or completion rates by format under fixed thresholds.
- Invalid, duplicate, off-target, consent-failure, and replacement rates by vendor and campaign type.
- MQL-to-sales-accepted-to-SQL-to-opportunity rates under one published stage contract.
- Cost per valid lead, accepted lead, and opportunity by targeting depth, geography, seniority, and account constraint.
- Observed links between declared purchase horizon and later opportunity or purchase.
- Incremental pipeline and revenue from holdout or matched-market designs.
- Full distributions and confidence intervals, not only averages or selected wins.
What a stronger industry study would publish
A useful multi-vendor benchmark would pre-register stage definitions, use the same audience and asset rules, disclose spend and delivery terms, deduplicate people and accounts, apply one validation protocol, track sales acceptance and opportunities for a fixed window, and publish anonymized campaign-level rows. A holdout or matched comparison would be needed for incremental revenue claims.
Until that exists, demand-gen teams should use the public figures in this article for context and use their own fixed cohorts for economic decisions.
Revision policy
This page should be reviewed when a major network report, representative survey, or transparent multi-vendor dataset is released. IVRIS will preserve source editions and population notes rather than silently replacing an old number with a new one that measures a different event. Corrections should state what changed, why, and which conclusion is affected.
Frequently Asked Questions
The questions below separate common operating decisions from unsupported market-wide averages.
There is no defensible universal CPL. Compare like-for-like units: delivered registration, valid contact, ICP-fit lead, sales-accepted lead, or opportunity. Include validation, replacement losses, and follow-up cost. Build internal ranges by vendor, geography, targeting depth, asset, and quarter rather than borrowing one market average.
Not automatically. A registration proves that required information was exchanged for an asset. An MQL should require your published fit and behavior rules, such as valid identity, target account or segment, relevant role, and defined engagement. Calling every registration an MQL changes the denominator and weakens downstream comparison.
Name the start and end stages first. Delivered-to-valid, valid-to-accepted, accepted-to-SQL, SQL-to-opportunity, and opportunity-to-win answer different questions. A single “conversion rate” cannot be compared across teams unless both stage definitions, observation window, population, and duplicate rules are identical. Report the full chain rather than one blended percentage.
Deliver the requested asset and validate the record immediately. Then route by evidence. A registration alone should receive source-aware educational follow-up, while explicit sales requests, strong fit, repeated account activity, or a stated near-term horizon may justify faster human contact. The 47.7-hour first-open average is not a universal call delay.
No format wins on every outcome. eBooks produced the largest registration share in NetLine’s 2025 network, while trend reports and live webinars were associated with different declared purchase horizons. Compare formats on registrations, substantive engagement, accepted leads, opportunities, and cost, not request volume alone.