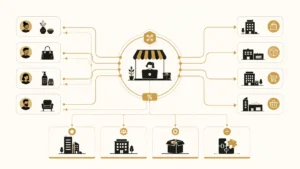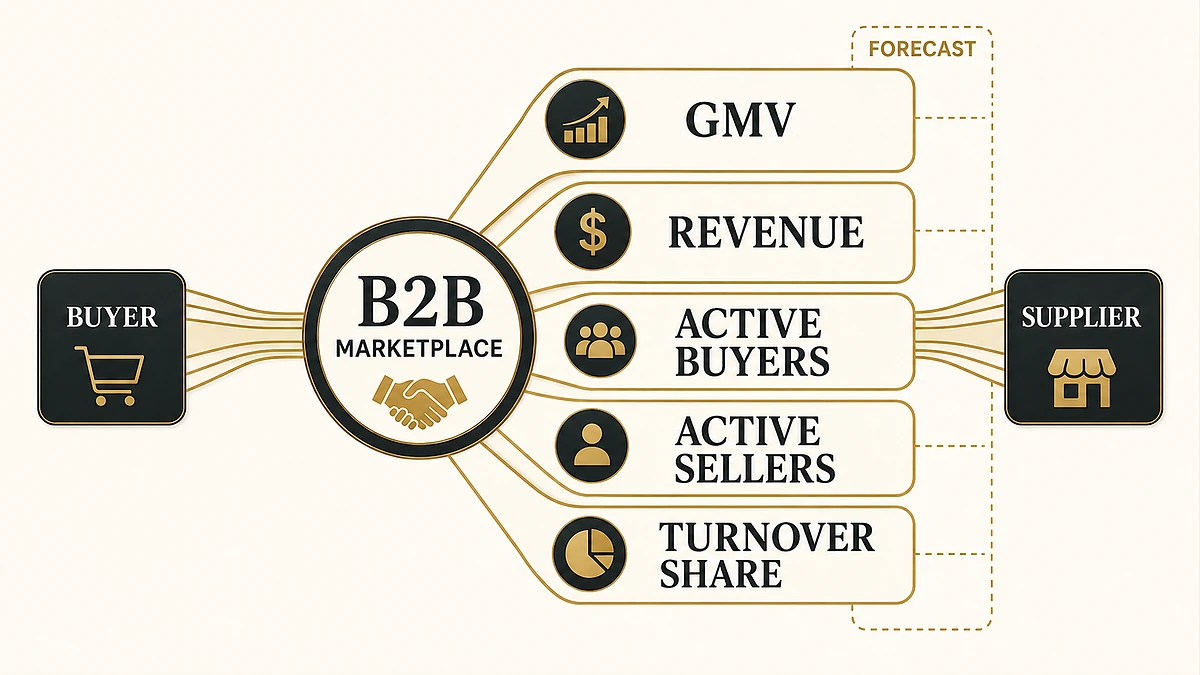
The problem with B2B marketplace statistics is not a shortage of numbers. It is category drift. A forecast for all B2B ecommerce becomes a marketplace market size, gross merchandise value becomes revenue, registered users become active buyers, and an expected outcome gets repeated as if it already happened.
This 2026 reference keeps the period, geography, population, denominator, methodology and evidence status attached to every figure. We checked each published number against the strongest publicly inspectable original source we could find. Recovered claims that did not survive that check were corrected or excluded.
Direct answer — What are the most useful B2B marketplace statistics for 2026?
B2B marketplace statistics show a growing but definition-sensitive channel. Digital Commerce 360 estimated US B2B marketplace sales at $224 billion in 2023. Eurostat found that 45% of EU enterprises making web sales used marketplaces in 2024. DHL found that 56% of surveyed B2B retailers used at least one marketplace in 2025. Amazon Business later reported $60 billion in annualized gross sales in Q2 2026. These figures measure sales, participation, survey responses and run-rate transaction value, not one comparable market-size metric.
Key Takeaways
- Digital Commerce 360 estimated US B2B marketplace sales at $224 billion in 2023, equal to an estimated 1.3% of all US B2B sales.
- Its separate 2024 forecast put marketplace sales above $350 billion and at 14.4% of US B2B ecommerce. That is a projection with a narrower denominator, not a measured update to the 1.3% figure.
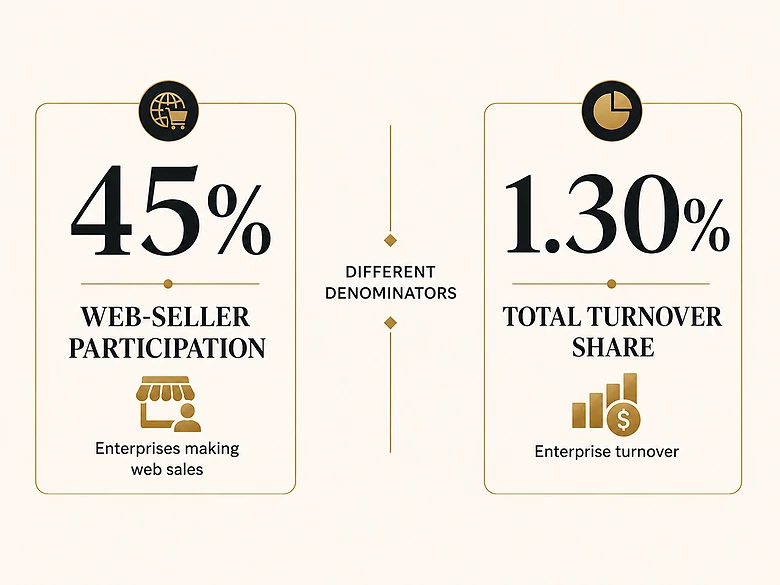
- Eurostat found that 45% of EU enterprises making web sales used marketplaces in 2024, yet marketplace web sales represented 1.30% of total enterprise turnover.
- DHL’s 2025 B2B retailer findings show broad adoption: 56% used at least one marketplace and 75% expected third-party marketplace sales to grow over the next three to five years.
- Operator figures are not a league table. Amazon Business reports annualized gross sales, Xometry reports marketplace revenue and gross margin, IndiaMART separates registered and active buyers, and GigaCloud reports GMV and spend per active buyer.
B2B marketplace statistics worth quoting in 2026
The most defensible B2B marketplace statistics preserve the source’s metric, period, geography and denominator.
The table below is a publication-safe shortlist. “Observed” means the source reports a completed period. “Estimated” means the source modeled a completed period. “Forecast” means the source projected a future result. “Survey response” records what respondents said, not transaction data.
| Statistic | Period and population | Evidence status | What it actually measures | Source |
|---|---|---|---|---|
| $224 billion | United States, 2023 | Estimated completed-period result | B2B sales transacted through marketplaces, not operator revenue | Digital Commerce 360 |
| 1.3% | United States, 2023 | Estimated share | B2B marketplace sales as a share of all US B2B sales | Digital Commerce 360 |
| More than $350 billion | United States, 2024 | Forecast | Projected B2B marketplace sales, not a verified 2024 outcome | Digital Commerce 360 |
| 14.4% | United States, 2024 | Forecast share | Projected marketplace share of US B2B ecommerce, not all B2B sales | Digital Commerce 360 |
| 59% | 103 B2B buyers, purchasing during 2023 | Survey response | Respondents placing more than 25% of their B2B purchasing through marketplaces | Digital Commerce 360 |
| 28% | 103 B2B buyers, purchasing during 2023 | Survey response | Respondents placing at least half of their B2B purchasing through marketplaces | Digital Commerce 360 |
| 45.00% | EU enterprises making web sales, reference year 2024 | Official survey statistic | Web-selling enterprises using ecommerce marketplaces; the population includes mixed B2B and B2C activity | Eurostat |
| 1.30% | EU enterprise turnover, reference year 2024 | Official survey statistic | Marketplace web sales as a share of total enterprise turnover | Eurostat |
| 56% | B2B retailer subgroup across 19 markets, surveyed February to April 2025 | Survey response | Respondents trading on at least one online marketplace; subgroup sample size was not publicly disclosed | DHL |
| 75% | Same DHL B2B retailer subgroup, 2025 | Survey expectation | Respondents expecting third-party marketplace sales to rise over the next three to five years | DHL |
| $60 billion | Amazon Business, Q2 2026 run rate announced July 21, 2026 | Company-reported run rate | Annualized gross sales, not revenue or a completed calendar-year total | Amazon |
| 89,557 | Xometry, quarter ended June 30, 2026 | Company-reported operating metric | Marketplace active buyers, defined through a trailing-12-month purchase window | Xometry |
| 41 million | IndiaMART, trailing 12 months to June 30, 2026 | Company-reported operating metric | Active buyers, kept separate from 234 million registered buyers | IndiaMART |
| $1.7448 billion | GigaCloud, trailing 12 months to June 30, 2026 | Company-reported operating metric | Marketplace GMV before the source’s stated exclusions and adjustments, not revenue | GigaCloud |
| $136,069 | GigaCloud, trailing 12 months to June 30, 2026 | Company-reported derived metric | GMV per active buyer over 12 months, not average order value | GigaCloud SEC filing |
| 35% more sales | 10,000+ Faire brands using ads for at least 30 days, January 1 to February 28, 2026 | First-party observed association | Average difference between Faire advertisers and non-advertisers in the analyzed cohort, not a causal universal lift | Faire |
IMPORTANT
A large percentage can describe a small denominator, while a small percentage can describe a much larger one. Never quote a marketplace share without naming whether the denominator is marketplace GMV, B2B ecommerce, total B2B sales or total enterprise turnover.
What counts as a B2B marketplace statistic?
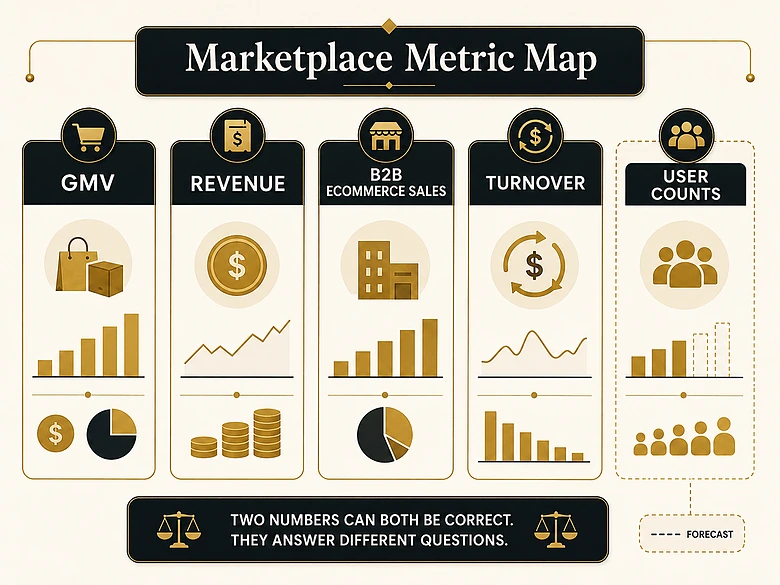
A B2B marketplace statistic is comparable only when the transaction model, metric definition and denominator match.
A multi-vendor marketplace connects business buyers with multiple suppliers and usually coordinates discovery, ordering or transaction infrastructure. That is different from a single-seller B2B ecommerce store, a procurement network, a classified directory or a software vendor that helps someone else build a marketplace. The distinction matters because each model reports different measures.
| Metric | What it usually represents | Common misread | Best use |
|---|---|---|---|
| Gross merchandise value (GMV) | Transaction value flowing through a marketplace under the operator’s stated rules | Calling GMV revenue | Transaction scale and buyer activity |
| Gross sales or annualized gross sales | Gross transaction value, sometimes expressed as a current run rate | Treating a run rate as completed annual revenue | Directional scale when the time basis is explicit |
| Marketplace revenue | Revenue recognized by the operator under its accounting model | Comparing it directly with another operator’s GMV | Company financial performance |
| B2B ecommerce sales | Online B2B sales across marketplaces and direct ecommerce channels | Calling the whole amount marketplace GMV | Digital channel size |
| Total B2B sales or enterprise turnover | Online and offline commercial activity within the stated population | Comparing its percentage with an ecommerce-only percentage | Channel penetration in the wider economy |
| Registered buyers | Accounts created over the operator’s stated history or period | Assuming every account is active | Top-of-funnel reach |
| Active buyers | Buyers meeting an activity rule, often at least one purchase in the previous 12 months | Comparing counts with different activity windows | Current transacting base |
| Paying suppliers | Suppliers paying subscription or service fees | Equating them with all listed suppliers or storefronts | Supplier monetization |
| Gross margin | Revenue remaining after the costs included in the operator’s gross-profit calculation | Calling it take rate | Unit economics under the company’s accounting model |
Why 14.4% and 1.3% are not contradictory
The two most repeated US share figures describe different periods and denominators. Digital Commerce 360’s 1.3% estimate refers to marketplace sales as a share of all US B2B sales in 2023. Its 14.4% figure is a 2024 forecast using US B2B ecommerce as the denominator.
Those percentages should not be placed side by side as though one replaced the other. B2B ecommerce is only part of total B2B commerce, and the later number was projected rather than observed.
Why software adoption is a separate question
Market sales do not tell you which technology can support multi-seller onboarding, split payments, negotiated pricing, RFQs or supplier payouts. That buying decision belongs in the B2B marketplace software comparison, not inside a statistics page. Keeping the intents separate protects readers from turning market growth into a platform recommendation.
Marketplace adoption is broad, but value share is smaller
Marketplace adoption is broader than marketplace value share, especially when the population is limited to firms already selling online.
EU participation and turnover measure different layers
Eurostat’s 2025 ICT survey covered about 157,000 enterprises and represented roughly 1.53 million EU enterprises with at least 10 people in the included economic activities. The reference period for the ecommerce figures was 2024.
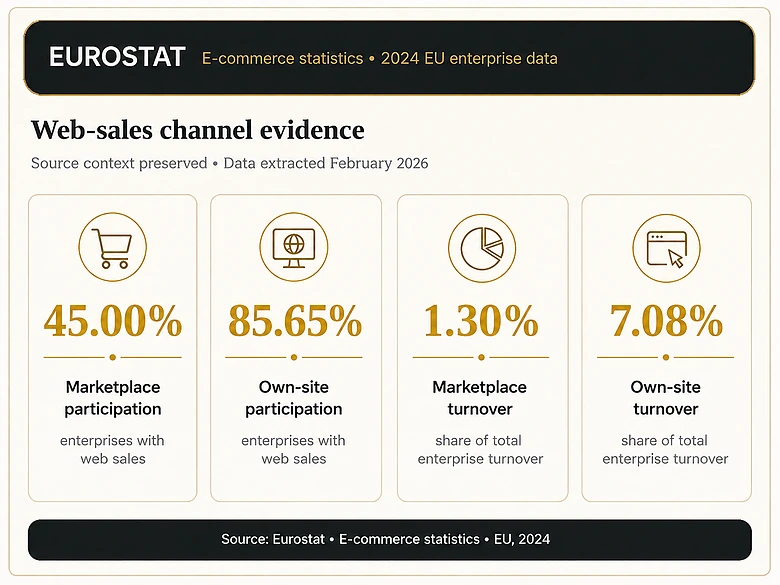
Among enterprises making web sales, 45.00% used ecommerce marketplaces and 85.65% used their own websites or apps. At the economy level, marketplace web sales represented 1.30% of total enterprise turnover, while sales through companies’ own websites or apps represented 7.08%.
This is not evidence that “45% of EU B2B firms use marketplaces.” The population is enterprises that made web sales, not all enterprises, and the activity can include B2B and B2C transactions. It is still valuable because it shows a pattern that marketplace planning often misses: participation can be widespread while value share remains modest.
B2B sellers expect marketplaces to matter more
DHL’s 2025 Business Edition drew from a global survey of 4,050 ecommerce businesses in 19 markets, conducted from February to April 2025. The public report does not disclose the exact size of its B2B retailer subgroup, so the percentages should stay attached to “surveyed B2B retailers,” not all B2B sellers.
Within that subgroup, 56% said they traded on at least one online marketplace and 75% expected sales through third-party marketplaces to rise during the next three to five years. DHL also reported that 58% sold on three or more ecommerce platforms and 72% sold internationally to B2B buyers.
The wording matters. Three ecommerce platforms could include direct stores as well as marketplaces, and an expectation of growth is not measured growth. For sellers, the practical message is multichannel: marketplace reach can expand discovery, while an owned B2B store still controls account pricing, data, merchandising and repeat ordering. The operating requirements behind that balance are covered in our B2B ecommerce best-practices guide.
Buyer surveys show concentration, not universal preference
Digital Commerce 360 reported that 59% of 103 surveyed B2B buyers placed more than a quarter of their 2023 purchasing through marketplaces, while 28% placed at least half there. The sample is small and its public summary does not provide a full sampling frame, but it still indicates that marketplace purchasing can become a material procurement channel for some buyers.
It does not prove that marketplaces are the preferred channel for every business category. Contract complexity, replenishment frequency, supplier qualification, payment terms and integration requirements can move the same buyer between a marketplace, a distributor portal and direct procurement.
A channel can be widely used and still capture a modest share of enterprise turnover. Adoption and economic share should be separate KPIs.
Operator data reveals four different kinds of scale
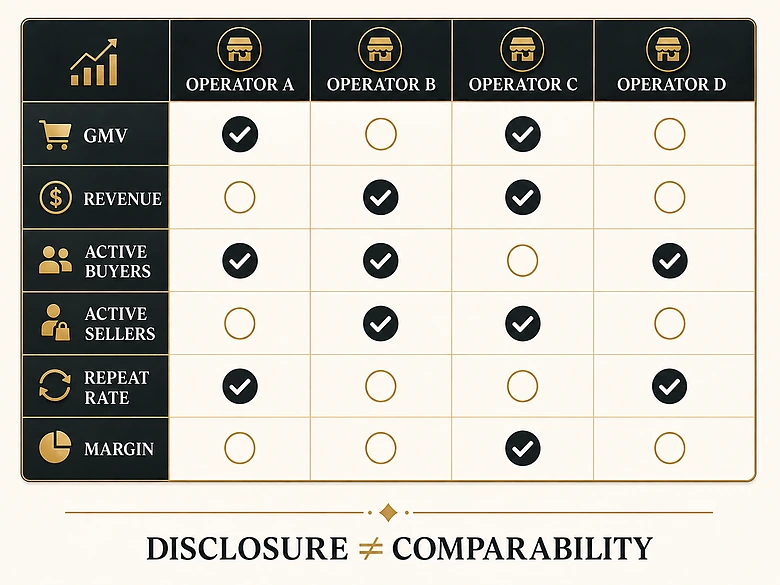
Marketplace operators report scale through gross sales, GMV, revenue, active buyers, supplier counts and repeat behavior, none of which ranks the same thing.
The examples below are not a “largest marketplace” table. They show how four operators define activity differently, and why those definitions must remain visible.
| Operator and period | Reported scale metrics | Definition or denominator | What not to infer |
|---|---|---|---|
| Amazon Business, Q2 2026 run rate announced July 21, 2026 | $60 billion in annualized gross sales; over 11 million organizations worldwide; more than half a billion deliveries during 2025 | Company-reported run-rate gross sales, organizations served and delivery activity | $60 billion is not Amazon Business revenue or a completed 2026 sales result; organizations are not necessarily active buyers in a fixed window; deliveries are not orders |
| Xometry, Q2 ended June 30, 2026 | $215 million marketplace revenue; 89,557 active buyers; 2,039 accounts with at least $50,000 in trailing-12-month spend; 98% of marketplace revenue from existing accounts; 34.7% marketplace gross margin | Revenue is quarterly; buyer and high-spend-account metrics use trailing-12-month activity; existing-account share is revenue mix | 98% is not a customer-retention rate; 34.7% is not take rate; active-buyer count is not lifetime registrations |
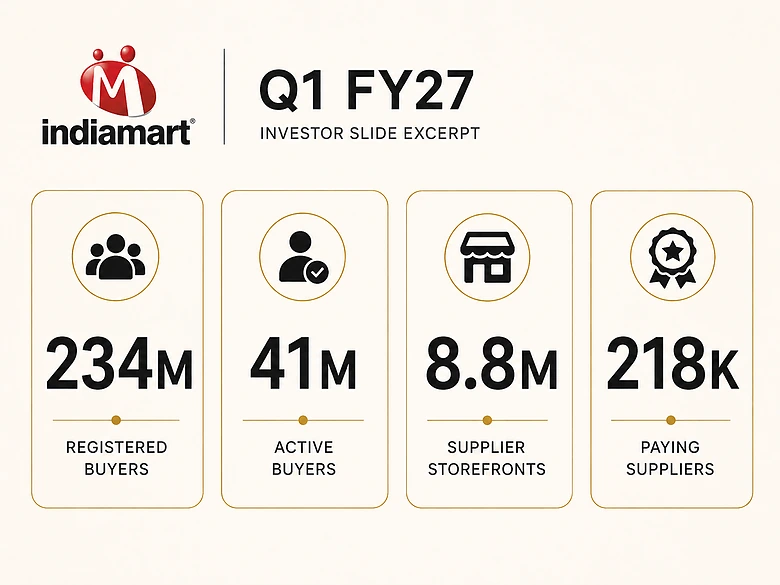
| IndiaMART, as of June 30, 2026 | 234 million registered buyers; 41 million active buyers; 58% 90-day repeat-buyer rate; 8.8 million supplier storefronts; 218,000 paying subscription suppliers | Active buyers use a trailing-12-month window; repeat behavior uses a 90-day window; storefronts and paying suppliers are separate populations | Registered buyers are not active buyers; supplier storefronts are not paying suppliers; the repeat rate cannot be compared with annual retention |
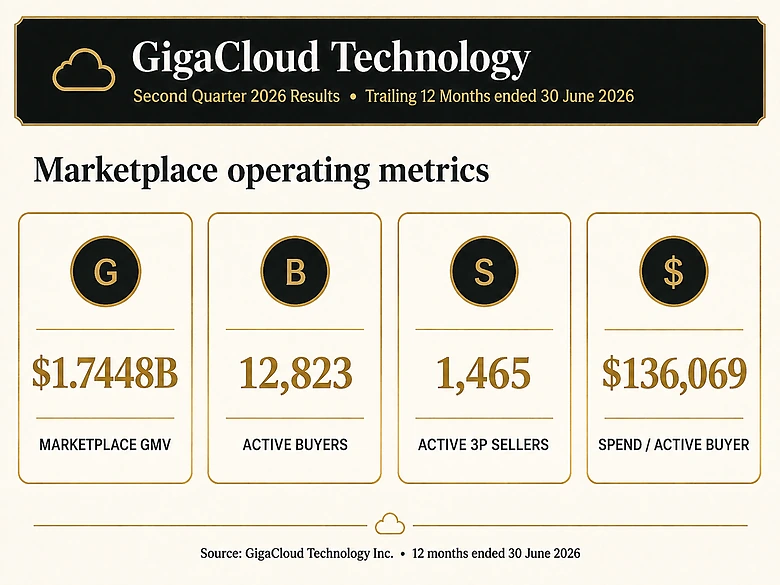
| GigaCloud, trailing 12 months to June 30, 2026 | $1.7448 billion marketplace GMV; 12,823 active buyers; $136,069 spend per active buyer; 1,465 active 3P sellers; $962.3 million third-party-seller GMV | GMV includes first-party and third-party activity under the company’s definition; active buyers purchased and active 3P sellers sold at least once during the trailing 12 months, irrespective of cancellations or returns | GMV is not revenue; spend per active buyer is not average order value; third-party GMV share is not revenue share |
Registered, active and paying users answer different questions
IndiaMART’s figures make the distinction concrete. Registered buyers describe cumulative reach. Active buyers describe a recent activity window. A 90-day repeat-buyer rate describes behavior within a much shorter window. Supplier storefronts describe supply presence, while paying suppliers describe monetized supply.
Dividing 41 million active buyers by 234 million registered buyers would look like an activation rate, but it would be invalid without matching cohort dates and account definitions. The two counts answer different questions.
PRO TIP
Build an operator scorecard with separate columns for GMV, recognized revenue, active buyers, buyer repeat or retention, active sellers, supplier monetization and gross margin. Leave a cell blank when the operator does not disclose the metric rather than substituting a nearby number.
Business models explain why the measures differ
Amazon Business, Xometry, IndiaMART and GigaCloud do not perform the same role in the same market. A procurement destination, a manufacturing marketplace, a supplier-discovery platform and a large-item B2B marketplace can all be valid marketplace models while recognizing revenue and defining activity differently.
That is why operator figures work best as case-specific evidence. For a view of how marketplace, distributor and direct-to-business models appear in practice, see our collection of B2B ecommerce examples.
Marketplace economics need metric discipline
Marketplace economics are measurable only when revenue recognition, GMV coverage, margin definitions and customer windows are visible.
Gross margin is not take rate
Xometry reported a 34.7% marketplace gross margin for Q2 2026. Gross margin shows gross profit as a share of marketplace revenue under Xometry’s accounting presentation. A take rate would compare marketplace revenue or fees with transaction value under a defined formula. The company did not label 34.7% as take rate, so neither should an article.
Spend per active buyer is not average order value
GigaCloud reported $136,069 in trailing-12-month spend per active buyer. Its SEC filing defines the measure as trailing-12-month marketplace GMV divided by active buyers. It says nothing by itself about order count, basket size, order frequency or buyer concentration.
Calling the figure average order value would overstate what the denominator supports. A buyer placing ten orders and a buyer placing one order can have the same annual spend.
Existing-account revenue is not retention
Xometry’s 98% share of marketplace revenue from existing accounts is strong evidence that previously acquired accounts drive most marketplace revenue. It is not logo retention, net revenue retention or repeat-purchase rate because the numerator is revenue and the denominator is total marketplace revenue, not an opening customer cohort.
Third-party GMV share is not revenue share
GigaCloud reported $962.3 million in third-party-seller GMV against $1.7448 billion in total marketplace GMV for the trailing 12 months to June 30, 2026. That equals about 55.2% by IVRIS calculation. It describes the composition of transaction value, not the composition of recognized revenue or gross profit.
Advertising results are associations, not universal lifts
Faire analyzed more than 10,000 brands that used Faire Ads for at least 30 days between January 1 and February 28, 2026. Compared with non-advertisers, advertisers averaged 70% more product-page views, 25% more new customers and 35% more sales during the analyzed period.
The source does not describe a randomized experiment. Brands choosing ads may differ in budget, assortment, maturity or operational quality. The evidence supports an observed association inside Faire’s cohort, not a promise that any seller will gain 35% more sales.
Forecasts and repeated claims need visible labels
A forecast belongs in a forecast section, and a repeated claim belongs nowhere until its original source can be inspected.
The 2024 US figure remains a forecast here
Digital Commerce 360 projected US B2B marketplace sales above $350 billion in 2024, up 35% year over year, and forecast a 14.4% share of US B2B ecommerce. We found the original public forecast, but not an equally inspectable public final 2024 result using the same definition and denominator.
For that reason, this article preserves the forecast label. The fact that 2024 is now in the past does not convert a projection into an observed result.
Broad B2B ecommerce totals do not measure marketplaces
Public market-size pages publish sharply different multi-trillion-dollar estimates for B2B ecommerce. Those estimates can vary by geography, included industries, transaction channels, marketplace treatment and modeled forecast period. Averaging them would create a number that no source actually measured.
This article therefore does not use a global B2B ecommerce forecast as a proxy for global B2B marketplace GMV. A direct ecommerce site, EDI transaction, procurement portal and multi-vendor marketplace may all sit inside a broad B2B ecommerce total.
Statistics corrected or excluded from this reference
| Repeated wording | Decision | Why | Publication-safe wording |
|---|---|---|---|
| “45% of EU B2B firms use marketplaces” | Corrected | Eurostat’s population is EU enterprises making web sales, and the activity is not B2B-only | 45% of EU enterprises making web sales used ecommerce marketplaces in 2024 |
| “58% of B2B sellers use three or more marketplaces” | Corrected | DHL says ecommerce platforms, which can include owned stores | 58% of surveyed B2B retailers sold on three or more ecommerce platforms |
| “Amazon Business revenue is $60 billion” | Corrected | Amazon calls it annualized gross sales | Amazon Business reached $60 billion in annualized gross sales in Q2 2026 |
| “Xometry’s marketplace take rate is 34.7%” | Corrected | Xometry labels the figure marketplace gross margin | Xometry reported a 34.7% marketplace gross margin for Q2 2026 |
| “Marketplace ads increase sales by 35%” | Corrected | Faire reported a non-randomized cohort association | Faire advertisers in the analyzed cohort averaged 35% more sales than non-advertisers |
| “Mirakl marketplace ad spend reached $12.7 million, up 258%” | Excluded | The recovered package did not preserve a publicly inspectable original source and denominator for the absolute figure | Do not quote until the original report and population can be inspected |
| “The global B2B marketplace market will reach $X trillion” | Excluded | Most accessible versions rely on opaque commercial forecasts or substitute total B2B ecommerce for marketplace activity | Use a geography-specific marketplace measure with a visible methodology |
| “The average B2B marketplace conversion rate is X%” | Excluded | Conversion definitions differ by visit, account, RFQ, quote, order and repeat-purchase funnel | Benchmark your own funnel using a named stage and denominator |
The right response to conflicting marketplace statistics is not to average them. It is to rebuild the denominator.
How to use marketplace statistics without bad decisions
To use marketplace statistics well, match each number to the decision it can support and keep the caveat beside it.
- Name the metric. Write GMV, recognized revenue, gross sales, turnover share, active buyers or survey response before writing the value.
- Preserve the period. Distinguish a quarter, calendar year, trailing 12 months and annualized run rate.
- Record the population. State the geography, business type, sample size and activity requirement.
- Label the evidence status. Mark observed, estimated, forecast, survey response, expectation, company-reported or IVRIS-calculated.
- Keep the denominator visible. “Share of B2B ecommerce” cannot become “share of all B2B sales.”
- Separate operator metrics. Do not rank GMV, revenue, registrations and active buyers in one column.
- Carry the limitation into the interpretation. A statistic is not safe if the headline survives but the caveat disappears.
What marketplace operators should measure
Operators should prioritize active buyers, repeat behavior, seller activation, GMV, recognized revenue, gross margin, fulfillment quality and concentration. A global market forecast can support a board narrative, but it cannot diagnose whether supplier onboarding or buyer repeat is failing.
What sellers should measure
Sellers should compare marketplace-acquired customers, margin after fees and ads, repeat orders, return rates, payment terms and channel concentration. DHL’s adoption figures support testing marketplaces as part of a channel mix; they do not prove that more marketplaces always create profitable growth.
What buyers should measure
Buyers should assess supplier verification, assortment depth, contract pricing, RFQ handling, payment terms, tax, logistics and procurement integration. Large GMV can signal liquidity, but it does not guarantee suitability for a regulated category or negotiated enterprise purchase.
What B2B leaders should measure
Leaders should track marketplace sales as a share of digital sales and total company sales separately. Eurostat’s adoption-versus-turnover pattern is a useful warning: being present on a marketplace is not the same as shifting a large share of revenue there.
Methodology and revision policy
IVRIS used the recovered research package as a source map, then re-fetched every statistic published in this article. Source priority was official statistical agencies, regulatory filings, investor materials, company-reported operational data and original industry research. Secondary roundups were used only to discover possible claims, never as the final citation.
Each number was classified by data period, geography, population, denominator, methodology and evidence status. The 55.2% GigaCloud third-party GMV share is an IVRIS calculation from $962.3 million divided by $1.7448 billion; both inputs come from the same company-reported period. Claims were excluded when the original source, population or denominator could not be inspected.
Verification was completed on August 25, 2026. Company operating metrics should be reviewed after the next quarterly report, while survey and official-statistics sections should be checked when their source families publish new editions.
Frequently Asked Questions
There is no single defensible global figure because sources define geography, channel and transaction value differently. For the United States, Digital Commerce 360 estimated B2B marketplace sales at $224 billion in 2023. Its separate figure above $350 billion for 2024 was a forecast, not a verified completed-year outcome.
Digital Commerce 360 estimated that marketplaces represented 1.3% of all US B2B sales in 2023. It separately forecast a 14.4% share of US B2B ecommerce in 2024. The percentages are not comparable because the periods, evidence status and denominators differ.
The evidence points toward growth, but forecasts and expectations must stay labeled. Digital Commerce 360 forecast 35% US marketplace-sales growth for 2024, while 75% of DHL’s surveyed B2B retailers expected third-party marketplace sales to rise over the next three to five years. Neither is a completed global growth rate.
GMV is the transaction value processed through a marketplace under the operator’s stated definition. It can include first-party and third-party activity and may treat shipping, tax, returns or cancellations differently. GMV is not the marketplace operator’s revenue, gross profit or take rate.
No current public count is defensible across all definitions. Lists can include transaction marketplaces, supplier directories, procurement networks, distributors, software marketplaces and platforms used to build marketplaces. A useful count needs a published inclusion rule, geography, active-status test and observation date.