

Search for high LTV B2B industries and you get a ranked list within three seconds. Architecture at $1.13 million. Business consultancies at $385,000. Software at $240,000. The figures are precise, the order is identical on every page of the first results screen, and the implied instruction is hard to miss: go sell to architects.
The ranking is real. The instruction is wrong, for two reasons that take about ten minutes to check and that none of the ranking pages mention.
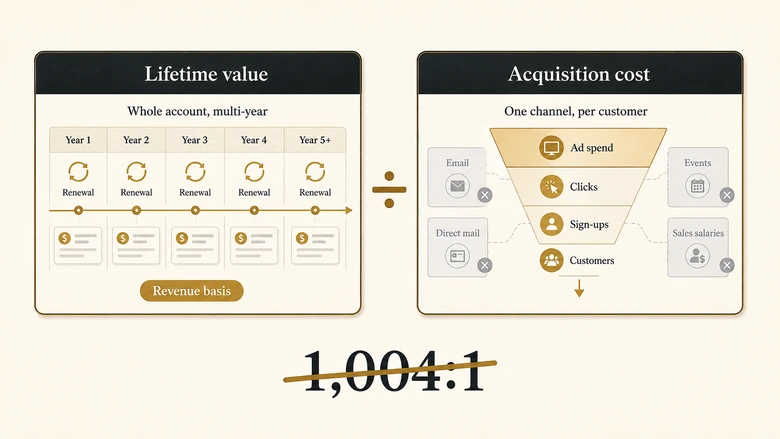
First, all seven figures come from one dataset. Not seven studies, not a meta-analysis. One vendor’s decade of account programmes, published once and quoted onward until it reads like consensus. Second, that dataset defines lifetime value as contract years multiplied by annual revenue, so the numbers are revenue rather than profit, and they cannot be divided by the acquisition-cost benchmarks published on the same screen. Divide them anyway and B2B SaaS returns a ratio of 1,004 to 1.
This page gives you the published ranking with its definition attached, shows what happens when the definition changes, and answers the question the ranking was standing in for: which verticals justify building revenue operations around them.
Direct answer — Which B2B industries have the highest customer lifetime value?
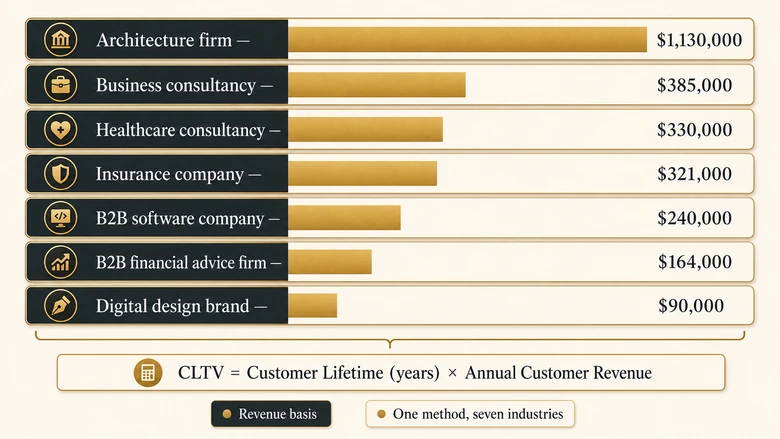
Architecture firms top the published ranking at about $1.13 million, ahead of business consultancies ($385,000), healthcare consultancies ($330,000), insurance ($321,000), software ($240,000), financial advice ($164,000) and digital design ($90,000). All seven figures come from one CustomerGauge dataset that defines lifetime value as contract years times annual revenue, before gross margin. They are revenue, not profit, and they cannot be divided by published CAC benchmarks.
Key Takeaways
- Every published B2B lifetime-value-by-industry figure on page one traces to a single CustomerGauge dataset covering seven industries. The apparent agreement between sources is republication, not replication.
- The formula behind those figures is contract years times annual revenue. No gross margin, no discount rate. Switch to a margin basis and the distance between architecture and software closes from roughly 4.7x to roughly 2.1x.
- Published LTV and published CAC come from different measurement systems. Dividing one by the other gives B2B SaaS a 1,004:1 ratio, which is evidence the two datasets do not belong in the same equation.
- High lifetime value alone does not justify a revenue operations investment. Account volume and coordination load do. Four accounts a year at $1.13 million needs a disciplined CRM, not a RevOps function.
- The three break points are payback, retention and concentration.
What high LTV means when you are comparing B2B industries
Customer lifetime value in B2B is the total revenue one customer account generates across the entire relationship. A high-LTV industry is one where the typical account stays several years, renews on a contract rather than a repurchase decision, and grows its spend without triggering a second acquisition cost. Duration and expansion matter more than the size of the opening deal.
That definition sounds uncontroversial until you try to apply it to two industries at once. An architecture firm’s “customer” is a developer who commissions a building, pays across a multi-year project, and may never return. A B2B software company’s customer is an account on a twelve-month subscription that either renews or does not. Both produce a number called lifetime value. The two numbers describe different things.
This matters because the comparison is the whole point of the query. Nobody looks up lifetime value by industry to admire the architecture figure. They look it up to decide where to point a go-to-market team.
The published ranking, and the single dataset behind it
The B2B lifetime-value ranking that appears across the first page of results comes from CustomerGauge’s own research across seven B2B industries, drawn from a decade of running account experience programmes. Here is the ranking with the definition attached, which is the part that usually goes missing when the numbers get quoted.
| Industry | Published CLTV | What the figure counts | What it excludes |
|---|---|---|---|
| Architecture firm | $1,130,000 | Project revenue across the client relationship | Delivery cost, subcontractor pass-through |
| Business consultancy | $385,000 | Retained and project fees over the relationship | Consultant cost, utilisation |
| Healthcare consultancy | $330,000 | Advisory revenue over the relationship | Delivery cost, compliance overhead |
| Insurance company | $321,000 | Premium and renewal revenue | Claims, reserves, commission |
| B2B software company | $240,000 | Subscription revenue across the account life | Hosting, support, gross margin |
| B2B financial advice firm | $164,000 | Fee revenue over the relationship | Adviser cost, regulatory overhead |
| Digital design brand | $90,000 | Project revenue across the client relationship | Production cost, freelancer spend |
The formula CustomerGauge applies is stated plainly on the source page, and it is simpler than most readers assume.
CLTV = Customer Lifetime (years) × Annual Customer RevenueThere is no margin adjustment in that expression, no discount rate applied to future years, and no probability weighting on renewal. It is a top-line multiplication. That is a legitimate way to size an account base, and CustomerGauge is transparent about it. The problem starts one hop downstream, when the output gets treated as a profitability measure by pages that never restate the formula.
Why the sources appear to agree
Three separate pages on the first results screen quote the $1.13 million architecture figure. That looks like corroboration. It is not. Trace each citation and they converge on the same origin, sometimes with the attribution intact and sometimes without it. One dataset, republished, reads exactly like a consensus until you follow the links.
IMPORTANT
Repetition across sources is not replication. Before adopting any industry benchmark as a target, follow every citation to its origin and count how many independent measurements you actually have. On this topic the answer is one.
Four definitions of lifetime value produce four different rankings
Lifetime value is calculated four common ways in B2B, and each one reorders the industry table. The definitions are not competing attempts at the same number. They answer different questions.
- Revenue LTV. Contract years times annual revenue. The basis for every figure in the table above. Answers: how large is this account relationship.
- Gross-margin LTV. The same figure multiplied by gross margin. Answers: how much of that relationship is available to fund anything.
- Contract-term LTV. Committed contract value only, excluding assumed renewals. Answers: what is actually signed.
- Churn-derived LTV. Annual revenue divided by the annual churn rate. Answers: what does the retention curve imply, given no fixed term.
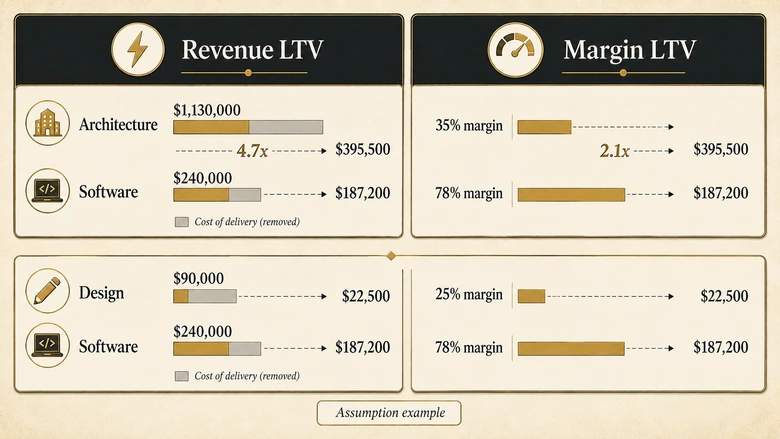
The gap between the first two is where the industry ranking quietly falls apart. Take the two extremes in the table and apply gross margins. Use your own numbers rather than published averages, because gross margin varies more within a vertical than between verticals. For the sake of a worked example, assume 35% for project-based architecture work and 78% for B2B software.
Architecture: $1,130,000 revenue LTV at 35% margin leaves about $395,500. Software: $240,000 revenue LTV at 78% margin leaves about $187,200. The revenue gap of 4.7x becomes a margin gap of about 2.1x. The order does not flip in this pair, but more than half the apparent advantage evaporates, and against a lower-margin services vertical it does flip. A 25%-margin design business at $90,000 keeps $22,500. A 78%-margin software account at $240,000 keeps $187,200, or eight times as much, against a revenue ratio of under three.
Those margin figures are assumptions, clearly labelled as such, and that is the point. Nobody publishes gross-margin LTV by industry, so the only version of this calculation that means anything is the one you run on your own accounts.
Why you cannot divide these LTVs by the published CAC figures
The same results screen that ranks lifetime value by industry also ranks acquisition cost by industry, and both pages recommend a minimum ratio of 3:1. The arrangement invites a division that produces nonsense.
First Page Sage’s acquisition-cost dataset, built from January 2022 to August 2025 data and last updated in January 2026, puts B2B SaaS at $239 per customer combined, business consulting at $533 and financial services at $784. Set those against the lifetime-value figures from the other dataset:
| Industry | Published LTV | Published CAC | Implied ratio | Target ratio |
|---|---|---|---|---|
| B2B SaaS / software | $240,000 | $239 | 1,004 : 1 | 3 : 1 |
| Business consultancy | $385,000 | $533 | 722 : 1 | 3 : 1 |
| Financial services / advice | $164,000 | $784 | 209 : 1 | 3 : 1 |
A ratio of 1,004:1 is not a finding about B2B SaaS. It is a receipt showing that the two datasets measure different objects. The lifetime-value figure is a whole-account, multi-year, top-line number. The acquisition-cost figure is a marketing-channel cost per new customer, drawn mostly from search and paid media, with email, events, direct mail and outdoor spend excluded because the sample was too thin. Sales salaries are not in it either.
There is a second tell inside the acquisition dataset. It carries both a “B2B SaaS” row at $239 and a “Software Development” row at $720. Two labels for adjacent businesses, differing threefold. If a vertical taxonomy cannot hold still inside one dataset, it will not survive being joined to another one.
Any LTV:CAC ratio above roughly 10:1 is a unit-mismatch alarm, not a result. Check that both halves count the same customers over the same period before you interpret the number.
High lifetime value does not justify RevOps investment. Operational load does
A revenue operations function earns its cost by removing friction that repeats. Routing, scoring, handoff rules, forecast hygiene, data enrichment and pipeline reporting all pay back through volume. Run the same broken handoff four times a year and the fix is a conversation. Run it four hundred times and the fix is a system.
That makes account volume, not account value, the first input to the investment decision. An architecture practice winning four clients a year at $1.13 million each has an outstanding business and almost no operational load. It needs a disciplined CRM, a named owner for each relationship and a renewal calendar. Building lead scoring for forty opportunities a year would cost more than the errors it prevents.
The vertical that justifies the investment is the one where value and volume are both high enough that manual coordination fails.
Coordination load is a measurable input
A useful way to frame the decision:
RevOps case = (Margin LTV × Accounts per year) ÷ Coordination load per dealCoordination load is not a soft term. It is measurable, and two published figures size it. 6sense’s buyer experience research, based on nearly 4,000 responses, reports that typical B2B purchases now involve buying groups averaging more than ten members, and that the average buying cycle ran 10.1 months in 2025, down from 11.3 months the year before. Ten stakeholders across ten months is the coordination problem RevOps exists to absorb. Multiply it by deal count and the business case either appears or it does not.
This is also why the standard metric set matters more in some verticals than others. Where deal counts are low, a handful of owners can hold the definitions in their heads. Where deal counts are high, definitions drift between teams within a quarter, which is the failure mode a shared register of metric definitions and named owners is built to prevent.
The five inputs that actually build lifetime value in B2B
Lifetime value is an output. Five inputs produce it, and a vertical is worth targeting when several of them run in your favour at once rather than when the headline figure is large.
Deal size sets the ceiling, not the outcome
A large opening contract raises the maximum but predicts little on its own. Large first deals correlate with longer evaluations, bigger buying groups and more implementation risk, all of which push the return further out.
Cycle length decides how much you finance
Every month between first touch and signature is a month of paid acquisition and sales cost with no revenue against it. A ten-month cycle on a two-year contract means roughly 40% of the committed term is consumed before the relationship starts.
Retention decides whether the multiplier is real
Contract years in the formula are an assumption until the retention curve confirms them. Two verticals with identical average tenure can behave completely differently: one loses a third of accounts at first renewal and holds the rest for a decade, the other decays steadily. The averages match. The forecast does not.
Expansion is the largest single swing factor
Growth inside an existing account carries no new acquisition cost, which is why it moves lifetime value further than any other input. It is also the input most often assumed rather than measured. SaaS Capital’s April 2026 survey of more than 1,000 private B2B SaaS companies puts median net revenue retention at 103%, with the 90th percentile at 117.9%. The median company is barely expanding. Before you credit a vertical with compounding account value, check which sample, period and contract-size band the retention figure you are quoting came from, because the widely repeated 118% enterprise number tracks a 90th-percentile reading rather than any published median.
Switching cost protects everything above it
Deep integration, migrated data and trained users make replacement expensive for the buyer. This is the input least visible in benchmark tables and the one that most reliably separates two companies inside the same vertical.
Which verticals justify the investment, and which only look like they do
Use the combination rather than the headline. The pattern below holds across the seven industries in the published dataset and generalises past them.
| Profile | Typical verticals | Verdict |
|---|---|---|
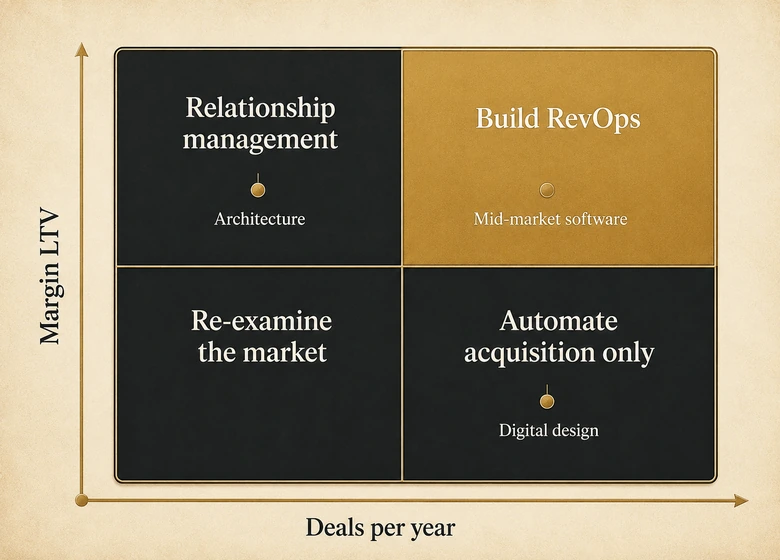
| High value, high volume, contractual renewal, expansion motion | Mid-market and enterprise B2B software, managed services, B2B insurance | Invest. Coordination load is real and repeats |
| High value, low volume, project-based, no renewal mechanism | Architecture, large-format construction, specialist consulting | Do not build RevOps. Fund relationship management and a clean CRM |
| Moderate value, high volume, short cycle, weak switching cost | Digital design, small-agency retainers, transactional SMB software | Invest narrowly. Automate acquisition and onboarding only |
| High value, long cycle, heavy compliance gates | Healthcare, regulated financial services | Invest in data governance first. Routing and scoring come later |
Read the table as a starting hypothesis, not a verdict on your business. The dispersion inside any one of these rows is wider than the distance between rows, which is exactly why the industry average fails as a target.
Once a vertical clears the bar, the work shifts from choosing a market to describing the accounts inside it precisely enough to filter on. That is a different exercise with a different output, and it is where a tiered profile with thresholds you can actually query replaces the industry label. Manufacturing is the clearest illustration of why the label is not enough: two plants with the same SIC code, headcount and revenue can sit at opposite ends of the fit range depending on production model and integration depth, which is why a manufacturing profile has to score production characteristics rather than firmographics.
Where the economics break
Three failure points turn a high-LTV vertical into a cash problem. Each one is measurable before you commit.
Payback outruns the contract
Lifetime value spread over six years does not pay a bill due in month fourteen. Acquisition cost recovery is the constraint that binds first, and the median has been moving the wrong way. Benchmarkit’s 2025 performance metrics report that CAC payback has lengthened by 12.5% at the median since 2022, alongside net revenue retention of 101%. The formula you pick moves the answer as much as the performance does, so the sensible move is to settle which payback definition you are using before you compare yourself to anyone, since including expansion ARR and dropping the gross-margin adjustment can take the same company from 22.5 months to 12.
Retention sits below 100%
Under 100% net revenue retention, the existing base shrinks every year. Lifetime value calculated from a historical average will overstate every future cohort, and the gap compounds. A vertical with a large headline figure and sub-100% retention is a vertical whose best years are already in the data.
Concentration turns churn into an event
High-LTV verticals concentrate revenue by construction. Four accounts at $1.13 million means one departure removes a quarter of the business. The same total spread across two hundred accounts is a rounding error. Average lifetime value says nothing about this, because concentration is a property of the distribution rather than the mean.
PRO TIP
Run the concentration test before the value test. Sort accounts by revenue and check what share the top five represent. Above 40%, the priority is diversification, whatever the vertical benchmark says.
How to test your own vertical before you fund the motion
To decide whether a vertical justifies the investment, work from your closed-won data rather than a published average. The sequence below takes about half a day with CRM access and produces a defensible answer.
The six-step vertical test
Workflow · 4 hours
How to test whether a B2B vertical justifies RevOps investment
Replaces a published industry average with a margin-adjusted, retention-checked lifetime value drawn from your own closed-won accounts, then weighs it against the coordination load the vertical actually creates.
Pull closed-won accounts grouped by vertical
Export every closed-won account from the last 36 months with industry, first contract date, total revenue booked and current status. Exclude accounts under twelve months old; they have no retention signal yet.
State which lifetime value definition you are using
Pick one of the four definitions and write it at the top of the sheet. Every figure below it must use that basis. Mixing bases across rows is the single most common error in this analysis.
Apply your real gross margin per vertical
Multiply each vertical’s revenue lifetime value by the gross margin that vertical actually delivers, including delivery and support cost. Service-heavy verticals will drop further than product-led ones.
Plot the retention curve, not the average tenure
Chart the share of each vertical’s cohort still active at 12, 24 and 36 months. A cliff at first renewal and a steady decay produce the same average and completely different forecasts.
Divide by coordination load
Count deals per year, average stakeholders per deal and average cycle length for each vertical. Margin lifetime value times deal count, divided by that load, ranks the verticals by how much a system would return.
Check concentration before committing
Calculate what share of vertical revenue the top five accounts hold. Above 40%, treat the vertical as a relationship-management problem rather than a scale problem, regardless of where it ranked in step five.
What the output tells you
The output of step five is the number worth arguing about internally. It is also the number that converts a targeting opinion into a budget request, because it expresses the vertical in terms of returned effort rather than headline revenue. Where the analysis says invest, the next step is turning the winning vertical into weighted, queryable scoring criteria your CRM can apply to inbound accounts rather than a label a rep applies by hand.
Sources, and how to check them
Four datasets support the figures on this page, and each one is worth opening rather than taking on trust.
- Lifetime value by industry. CustomerGauge, seven B2B industries, published May 2026, drawn from a decade of account experience programmes. Revenue basis, formula published on the page.
- Acquisition cost by industry. First Page Sage, 29 B2B industries, data window January 2022 to August 2025, updated January 2026. Marketing-channel basis, weighted toward search, excludes email, events and direct mail.
- Net revenue retention. SaaS Capital, more than 1,000 private B2B SaaS companies, published April 2026. Median 103%, 90th percentile 117.9%.
- Acquisition payback and retention trend. Benchmarkit 2025 performance metrics. Payback lengthened 12.5% at median since 2022; net revenue retention 101%.
Two of these describe revenue, one describes marketing cost and one describes retention. They are useful individually and misleading in combination, which is the argument this page has been making throughout. Where a figure here is an assumption rather than a measurement, it is labelled as one.
Frequently Asked Questions
Three to one is the common target, meaning each customer returns three times what it cost to win them. The ratio only means something when both halves count the same customers over the same period and use the same margin basis. A result above roughly ten to one usually signals mismatched datasets rather than an exceptional business.
Architecture firms lead the published ranking at roughly $1.13 million per client, according to CustomerGauge’s seven-industry dataset. That figure is project revenue across a client relationship, not profit, and it reflects very low deal volume. On a gross-margin basis the advantage over B2B software narrows sharply.
Nothing consistent. Lifetime value, customer lifetime value and CLTV are used interchangeably across B2B sources. What varies is the calculation underneath the label, not the label itself. Always ask whether a quoted figure is revenue or margin based, and whether future years are discounted, before comparing it to anything.
Divide one by your annual customer churn rate. A 20% annual churn rate implies a five-year average lifespan. The result assumes churn stays constant, which it rarely does in B2B, where losses cluster at the first renewal. Plot the actual retention curve before trusting the implied figure.
Use gross margin for any decision about spending money. Revenue lifetime value sizes a relationship; margin lifetime value tells you what is available to fund acquisition, delivery and overhead. Nearly all published industry benchmarks are revenue based, which is why they overstate the case for service-heavy verticals.





