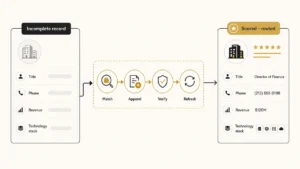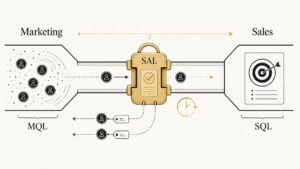
A B2B SaaS company that defines its ideal customer as “mid-market software firms in North America” has described tens of thousands of companies and qualified none of them. Sales feels it first: every inbound demo looks equally promising, reps work whoever replied fastest, and the pipeline fills with accounts that were never going to renew.
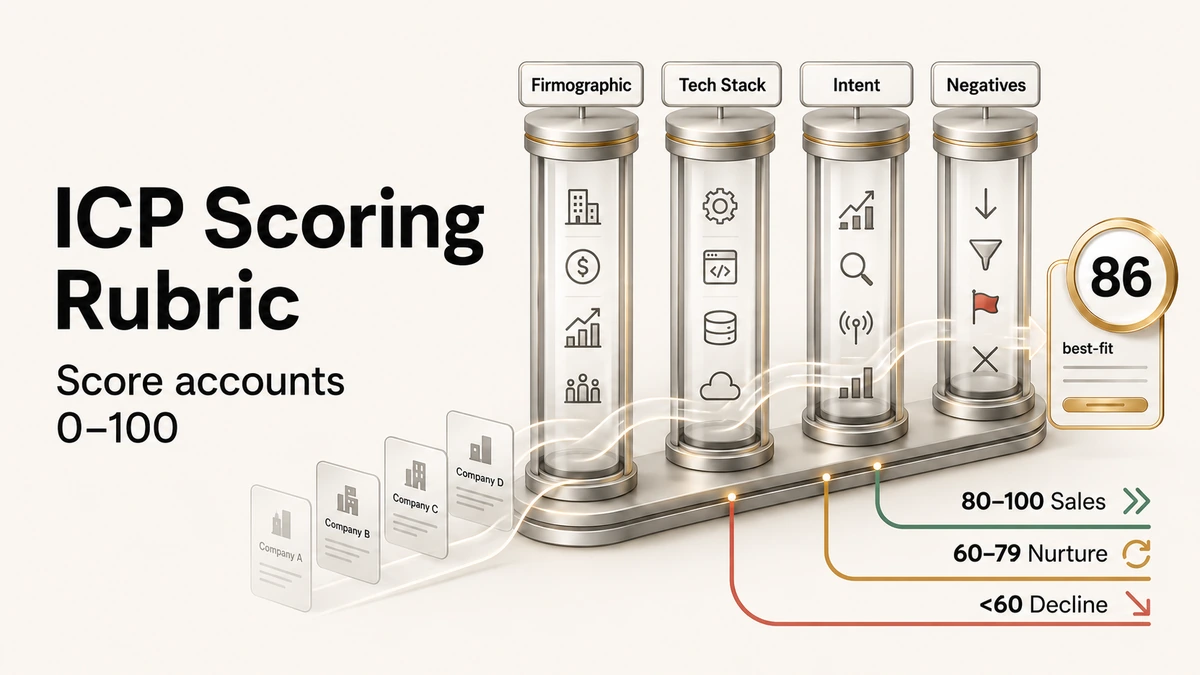
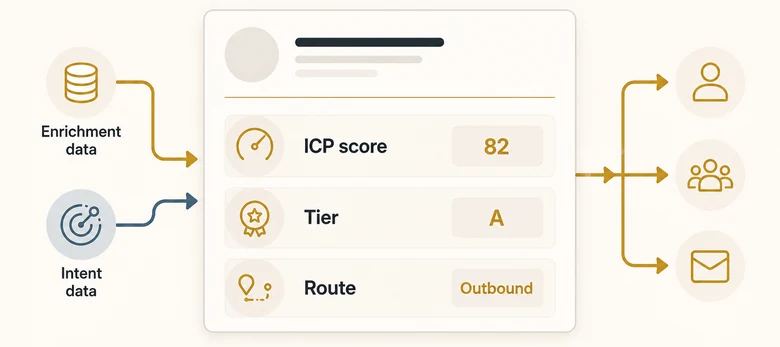
An ICP scoring rubric for B2B SaaS fixes that by turning fit into a number. Instead of a paragraph nobody reads, you score each account against weighted attributes and get a single 0-100 figure that says who to call now, who to keep warm, and who to decline. The stakes are concrete: Forrester puts the inquiry-to-closed-won conversion rate of a traditional lead-centric funnel at less than 1%, which is the leakage disciplined fit-scoring is built to stop.
This guide gives you the four weighted pillars, a worked 0-100 scorecard, the green/yellow/red routing tiers, and the exact steps to build a rubric from your own closed-won data.
Key Takeaways
- An ICP scoring rubric scores four pillars and produces one 0-100 number, so account fit stops being a gut call.
- The four pillars are firmographics, technographics, behavioral and intent signals, and negative signals, each weighted by how well it predicted your past wins.
- In SaaS, intent and product behavior often predict a deal better than company size, so weight the behavioral pillar near the top.
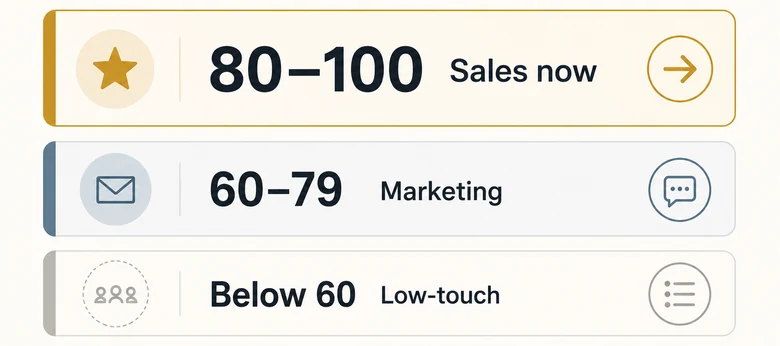
- Three tiers route the work: green (80-100) goes to sales now, yellow (60-79) to marketing follow-up, red (below 60) to low-touch or disqualify.
- Negative signals are deductions, not a positive share of the score. A missing buying committee or a regulatory blocker can pull an otherwise-decent account into the red.
What an ICP Scoring Rubric Is (B2B SaaS Definition)
An ICP scoring rubric is a weighted framework B2B SaaS teams use to score how closely an account matches their ideal customer, assigning points across firmographic, technographic, behavioral, and negative-signal attributes to produce a single 0-100 fit score that routes the account to the right next action.
The rubric describes a company, not a person, and it is built to exclude as much as to include. The weights are not universal. The attributes that predict a SaaS buyer are not the ones that predict a factory, which is why the same rubric tuned for a single industrial vertical leads with certifications and installed equipment instead of ARR and tech stack. Your job is to find the weights that separated your wins from your losses, then write them down.
ICP Scoring Rubric vs ICP vs Buyer Persona
These three artifacts get used interchangeably and they should not be. The ICP describes which companies to target, the rubric scores how well a given account fits that description, and the persona describes the people inside the account you actually talk to.
| Artifact | Question it answers | Unit | B2B SaaS example |
|---|---|---|---|
| ICP scoring rubric | How well does this account fit, as a number? | Account (scored) | A 150-employee Series B fintech scores 86 of 100 |
| Ideal customer profile | Which companies should we target? | Account (described) | Mid-market fintech, 100-500 employees, payments stack in place |
| Buyer persona | How do we speak to the people inside? | Person / role | VP of Engineering; Head of RevOps; the economic buyer in finance |
Why a Vague ICP Routes Nothing
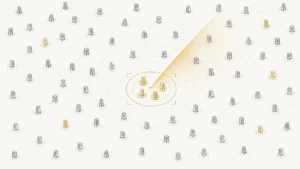
A profile that fits thousands of companies cannot route a single lead. When the criteria are “software, mid-size, North America,” every inbound signup looks equally qualified, so reps fall back on instinct and marketing spends budget on accounts that will churn in two quarters. A scored rubric replaces that with a threshold: above it, a human gets involved; below it, the account waits or gets declined. The value of a rubric lives in what it says no to.
The 4 Pillars of an ICP Scoring Rubric
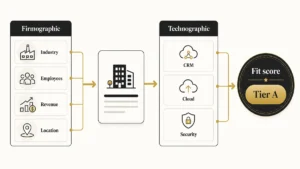
An ICP scoring rubric scores four pillars: firmographics, technographics, behavioral and intent signals, and negative signals, each weighted by how well it predicted your past closed-won accounts. That weighting is only as good as the closed-won history behind it, so attributing closed revenue back to the account is what supplies the rubric with a truthful training set in the first place.
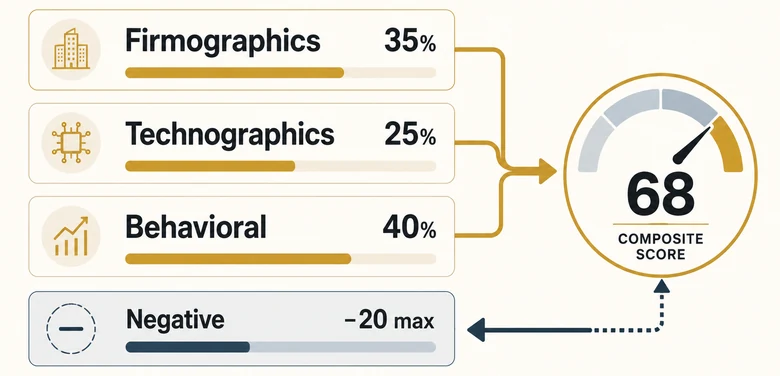
The three positive pillars carry the score and should sum to 100% for your business. Negative signals are deductions applied on top, not a positive share. You will see ranges cited as typical, firmographics at 30-40%, technographics at 20-25%, and behavioral at 25-30%, but those ranges cannot all sum to 100, so treat them as starting points and tune to your own win data. The rubric in this guide weights intent at the top, because in SaaS a buying trigger predicts timing in a way a static attribute never will.
| Pillar | What it measures | Example attributes | Weight | Direction |
|---|---|---|---|---|
| Firmographics | Company shape and fit to your pricing model | ARR / revenue band, employee count, industry, funding stage, geography | 35% | + |
| Technographics | The software environment and spend capacity | Current stack, complementary tools, legacy or competitor tools, budget signals | 25% | + |
| Behavioral & Intent | Readiness and timing | Third-party intent, content and product engagement, buying triggers | 40% | + |
| Negative signals | Disqualifiers that predict a bad deal | No buying committee, regulatory blocker, competitor lock-in, sub-threshold size | up to −20 pts | − |
Firmographics (30-40%)
Firmographics measure the structural fit between an account and the customers your product is priced and built for. Size maps to deal value and buying complexity: Gartner puts a complex B2B purchase in the hands of six to ten decision-makers, so a 30-person startup and a 3,000-person enterprise are not the same sale even when both say yes. Score higher inside your proven band:
- ARR or revenue inside the range where your product wins and renews
- Employee count in your sweet spot, not the edges
- Industry or vertical that matches your highest-converting segments
- Funding stage that signals both budget and urgency
- Geography you can sell to and support, including data-residency fit
Technographics (20-25%)
Technographics measure the software an account already runs and whether it can fund another tool. A prospect using complementary products that integrate with yours is a stronger fit than one running a homegrown system with no API. Budget capacity is part of this pillar too: Gartner’s April 2026 forecast projects worldwide IT spending will reach $6.31 trillion in 2026, up 13.5%, so a prospect’s investment posture is a real signal of whether it can pay.
- Complementary tools that make adoption easy
- Integrations your product depends on or enhances
- Legacy or competitor tools that create a switching opportunity
- Budget and spend indicators (recent funding, tooling investment, hiring in your category)
Behavioral & Intent Signals (25-30%)
Behavioral and intent signals measure readiness, the difference between an account that could buy and one that is about to. This pillar earns the top weight in our model because it predicts timing. In a Forrester Consulting study commissioned by 6sense, teams using intent-driven account prioritization reported a 4x increase in win rate against a slower, fit-only motion.
- Third-party intent data on your category and competitors
- Engagement: pricing-page visits, repeat sessions, multiple stakeholders downloading content
- Product or trial activity, the sharpest signal in a product-led motion
- Buying triggers: new funding, a leadership hire, fast headcount growth, a competitor switch
For a product-led company, this pillar gets richer, because product-qualified signals like trial depth and feature activation become the strongest fit evidence you have, scored at the contact level and rolled up to the account. Intent also ages, so the behavioral pillar needs a decay rule that lets stale signals fall off rather than propping up a score forever, the same discipline behind any durable lead scoring model that holds up over time.
Negative Signals (−10% to −20%)
Negative signals are disqualifiers that predict a bad deal regardless of how well an account scores everywhere else. They work as deductions, and the strongest ones should act as a hard gate. An account with no identifiable buying committee, a regulatory profile your product cannot serve, or a recent commitment to a competitor belongs in the red no matter how good its firmographics look. Treat the worst of these as a hard gate that filters bad-fit accounts before they ever score, not as a few points off the top.
- No buying committee or budget authority for your category
- Regulatory or compliance restrictions you cannot meet
- Locked into a competitor on a long contract
- Below your minimum viable size, or a past churned logo
How to Calculate an ICP Score (Step by Step)
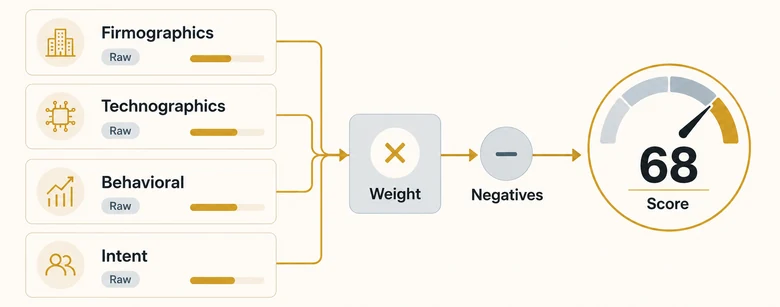
To calculate an ICP score, score each attribute against its band to get a 0-100 raw score per pillar, multiply each pillar by its weight, sum the weighted pillars, subtract any negative signals, and normalize the result to a 0-100 scale.
ICP Score = (Firmographics × 35%) + (Technographics × 25%) + (Behavioral & Intent × 40%) − Negative SignalsWorkflow · 5 min
How to calculate an ICP score for one account
Turn one account’s attributes into a single 0-100 fit score and a routing tier.
List the scored attributes per pillar
Pull the firmographic, technographic, behavioral, and negative attributes your rubric defines for the account.
Assign a raw score to each pillar
Score each attribute against its band, then roll each pillar up to a 0-100 raw score (full, partial, or zero fit).
Multiply each pillar by its weight
Apply your pillar weights (35%, 25%, 40%) to each raw score to get its weighted contribution.
Sum the weighted pillars
Add the three weighted contributions into a single positive subtotal between 0 and 100.
Subtract negative signals
Deduct points for any disqualifiers present, such as a missing buying committee or a regulatory blocker.
Normalize and assign a tier
Express the result on a 0-100 scale and map it to green, yellow, or red.
The math is deliberately simple so a rep can trust it. The hard part is not the arithmetic; it is agreeing on the bands and the weights, which is why the worked example below matters more than the formula. When that arithmetic has to run on every account, the revenue-band slice of it is the most mechanical piece, and turning those bands into tested SQL or Python scores each account the same way without a human in the loop.
ICP Score Tiers: The Traffic-Light System
ICP score tiers sort accounts into three routing bands: green (80-100) for immediate sales outreach, yellow (60-79) for marketing nurture, and red (below 60) for low-touch or automatic disqualification.
| Tier | Score range | What it means | Owner and next action | SLA |
|---|---|---|---|---|
| 🟢 Green | 80-100 | Strong fit, high readiness | Sales / BDR, direct outreach now | Within 24 hours |
| 🟡 Yellow | 60-79 | Partial fit, watch for a trigger | Marketing nurture, route on signal | Weekly review |
| 🔴 Red | Below 60 | Poor fit or disqualified | Low-touch automation or decline | No active work |
What Each Tier Triggers
The tier is a routing instruction, not a label. Green means a human reaches out on a clock, because the cost of a slow response on a ready account is a lost deal. Yellow means the account stays in marketing until a trigger fires, so the marketing track is doing real work rather than parking leads. Red means you stop spending attention, which is the tier most teams refuse to operate and the reason their reps drown in poor-fit accounts.
Where to Set Your Thresholds (80 Isn’t Sacred)
The 80 and 60 cutoffs are starting points, not laws. Back-test them against your closed-won accounts and move the lines until each tier predicts real conversion in your pipeline. The green cutoff is a routing threshold, the same handoff logic that separates an MQL from an SQL at the lead level, applied one level up to the account. If half your green accounts stall, your threshold is too low or your weights are wrong.
A Sample ICP Scoring Rubric for B2B SaaS (Worked Scorecard)
A sample ICP scoring rubric scores one account across all four pillars and shows the math: a 150-employee Series B fintech with strong intent and no negative flags scores 86 and lands in the green tier.
| Pillar | Raw score (0-100) | Weight | Weighted contribution |
|---|---|---|---|
| Firmographics | 88 | 35% | 30.8 |
| Technographics | 80 | 25% | 20.0 |
| Behavioral & Intent | 88 | 40% | 35.2 |
| Negative signals | none present | deduction | 0 |
| Composite | 86 → 🟢 Green |
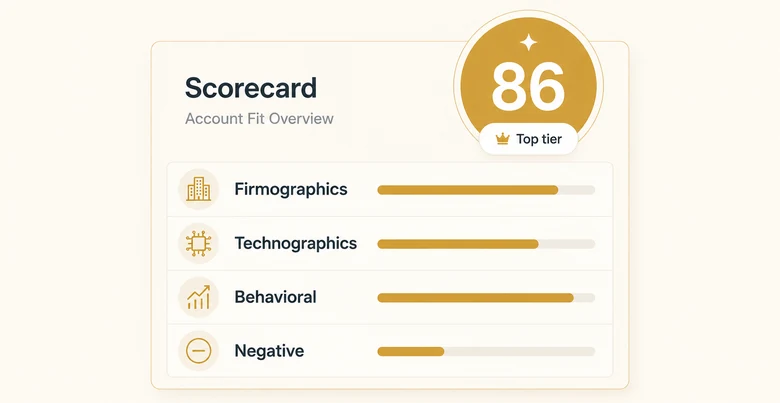
Green-Tier Example (scores 86)
The fintech above fits the firmographic band, runs a complementary stack, and shows active intent: pricing-page visits from three stakeholders and a recent funding round. No negative signals fire. The weighted pillars sum to 86, a clear green that belongs in front of a rep this week.
Yellow-Tier Example (scores 68)
A similar fintech scores 80 on firmographics but only 60 on technographics (a competitor is entrenched) and 62 on behavioral (little recent activity). The weighted total lands near 68. It fits on paper but shows no urgency, so it stays in marketing until a trigger, a renewal date or a leadership change, moves it.
Red-Tier Example (scores 42)
A 40-person startup scores moderately across the positive pillars but has no identifiable buying committee, which fires a −15 negative signal. A positive subtotal of roughly 57 drops to 42 after the deduction. The negative signal is doing exactly its job: pulling an account that looked passable into the tier where it stops consuming sales time.
ICP Scoring Rubric for B2B Executive Outreach
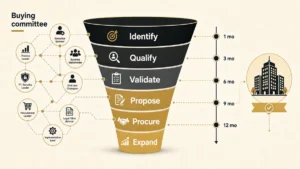
An ICP scoring rubric for B2B executive outreach is a weighted 100-point scorecard that grades an account on four categories, firmographic fit, buying authority and executive persona, timing and intent signals, and strategic fit, then subtracts negative signals, before a rep spends a personalized C-suite touch. The total routes the account to a tier: pursue now, nurture, or disqualify.
The four pillars are the same ones you just scored, but the weighting changes. A personalized executive sequence is expensive and low-volume, so reaching the right decision-maker at the right moment predicts a reply better than raw company size. This variant pulls buying authority, executive persona, and trigger timing to the top of the scorecard and treats firmographics as a qualifier rather than the headline. That is the gap most ICP rubrics miss: they score the company and forget the executive.
| Category (max points) | Signal | Points | What earns the points |
|---|---|---|---|
| Firmographic fit (25) | Industry & vertical match | 10 | Account sits in a priority vertical you reliably win |
| Revenue / employee band | 10 | Inside your target size range | |
| Geography & compliance fit | 5 | In territory; data-residency and regulatory fit | |
| Buying authority & executive persona (30) | Target executive title present | 15 | A real decision-maker or budget owner exists (CxO / VP) |
| Reachable champion or warm path | 8 | Identified entry point, referral, or mutual connection | |
| Buying-committee completeness | 7 | Supporting roles exist so the executive can actually act | |
| Timing & intent signals (30) | Trigger event | 15 | Exec appointment, funding round, M&A, reorg, or tech migration |
| Account-level intent | 10 | Third-party intent surge or content / webinar engagement | |
| Organizational readiness | 5 | Hiring in the relevant function; an active initiative | |
| Strategic & technographic fit (15) | Technographic alignment | 10 | Complementary stack; no entrenched competitor |
| Strategic / expansion value | 5 | Logo value or land-and-expand potential | |
| Negative signals (−20 max) | Locked with a competitor | −10 | Long-term contract or recent renewal with a rival |
| Single-threaded / no reachable committee | −10 | No path to the people who approve the purchase | |
| Total | 100 | Positive points, less up to −20 in deductions |
Executive-Outreach Tiers: What Each Score Triggers
Map the total to the same green / yellow / red routing the rest of this rubric uses (some revenue teams label these Tier A, B, and C):
- 🟢 Green / Tier A (80-100): launch a personalized, multi-touch executive sequence now, a research-led first touch, a relevant proof point, and a specific reason the timing fits.
- 🟡 Yellow / Tier B (60-79): nurture with lower-touch marketing and hold the executive touch until a trigger fires. A good account with no urgency has not yet earned a senior buyer’s attention.
- 🔴 Red / Tier C (below 60): exclude from executive and SDR cadences. Disqualify or keep on low-touch nurture so reps stop spending personalized touches on accounts that cannot convert.
The scorecard decides which accounts deserve an executive touch; deciding whether a specific senior buyer inside that account is worth a personalized approach is a second gate. The B2B executive outreach qualification criteria add seniority, economic authority, and reachability as their own weighted checks at the person level, the same way lead scoring criteria rank the contacts once the account clears.
Worked Example: Scoring an Account for Executive Outreach
A 600-employee logistics-SaaS account just appointed a new CRO. It fits the vertical and size band and sits in-territory (firmographic 25), exposes a reachable VP of RevOps as a warm path with a near-complete buying committee (authority and persona 27), and shows the fresh trigger plus a third-party intent surge on “revenue operations” (timing and intent 25). A complementary tech stack with modest expansion potential adds 12, and no negative signals fire. The total lands at 89, a clear green: this account earns a personalized executive sequence this week, opened around the new CRO’s first-90-days agenda.
What Is an ICP in B2B SaaS? (and How Scoring Differs from Lead Scoring)
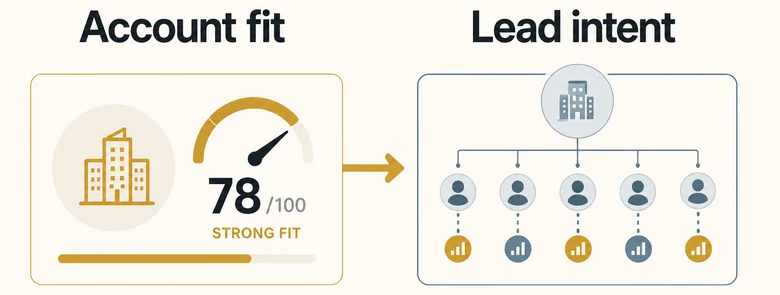
An ICP in B2B SaaS is a data-backed description of the company accounts most likely to buy, expand, and renew, defined at the account level rather than the individual-lead level. The scoring rubric is how you turn that description into a number you can route on.
ICP scoring and lead scoring answer different questions and work at different units. ICP scoring ranks whole accounts by fit; lead scoring ranks individual contacts by buying readiness. Used together, account fit decides which companies matter and lead scoring decides which person inside them to call first. When that person is a senior buyer, readiness alone is not enough, and a weighted scorecard for executive outreach adds seniority and economic authority as separate gates before a rep invests in the account.
| ICP score | Lead score | |
|---|---|---|
| Unit | Account / company | Individual contact / lead |
| Question | How well does this company fit? | How ready is this person to buy? |
| Main inputs | Firmographics, technographics, account-level intent | Role, engagement, demo requests, email activity |
| Decides | Which accounts to target and resource | Which contact to work first inside an account |
Once an account clears the green tier, the rubric hands off to the contact level, where the signals and point values that score the people inside decide which buyer a rep calls first. The account score sets the priority; the lead score sets the sequence.
How to Build Your ICP Scoring Rubric from Closed-Won Data
To build an ICP scoring rubric, score your last 30-50 closed-won and churned accounts on the four pillars, find the attributes that separated the wins from the losses, and set your pillar weights from that pattern instead of from intuition.
Calibrating Weights to Your Win Data
Start with the rubric in this guide, then test it against history. Score your won accounts and your churned ones, and look for the pillar that actually split them. If every won account showed strong intent and your losses did not, intent earns its 40%. If firmographics barely moved between wins and losses, drop their weight and move the points. The weights are hypotheses until your own data confirms them.
Writing the Negative-Signal List
The disqualifier list is where most of the rubric’s value sits, and it is the part teams skip. Pull the traits your worst-fit and fastest-churning accounts shared, then write them down as deductions or hard gates. A rubric that cannot name an account type you will decline is a wish list, not a scoring model.
IMPORTANT
The negative-signal list is not optional. If your rubric only adds points and never subtracts them, every account drifts toward “qualified” and the tiers collapse. Name the disqualifiers and let reps cite them out loud.
Validating with Sales Before You Lock Thresholds
Walk the draft past two reps and one closer before you operationalize anything. They will tell you which signals are noise and which deals the model would have wrongly killed. The payoff is real time back: Salesforce’s State of Sales report finds reps already spend more than half their week on non-selling work, so a rubric that auto-declines poor-fit accounts buys back the scarcest resource they have.
Operationalizing the Rubric in Your CRM and GTM Stack
Operationalizing an ICP scoring rubric means encoding it as CRM fields and automated workflows so every account is scored, tiered, and routed without anyone re-reading the rubric.
Scoring Fields and Routing in HubSpot or Salesforce
The rubric becomes three things in the CRM: a set of scored properties on the account record, a calculated ICP-score field, and a routing rule that fires on the tier. Green accounts assign to a rep with an SLA, yellow accounts enroll in a marketing sequence, and red accounts route to low-touch automation. Whether you build it in HubSpot or Salesforce, the principle is the same: the score lives on the record and the workflow acts on it.
Enriching Firmographic and Intent Data
A rubric is only as good as the data feeding it, and most of that data does not live in your CRM by default. Enrichment and intent tools fill the firmographic, technographic, and behavioral fields the rubric scores, so the calculation runs on current information rather than whatever a form captured months ago.
Re-Scoring on a Cadence
An ICP score is a snapshot, and intent decays. Re-score accounts on a cadence so a hot signal from last quarter stops inflating today’s priority, and re-run your weight calibration once or twice a year as you add segments or move upmarket. A rubric only stays trusted when it is owned by RevOps as a shared scoring contract rather than re-litigated in every pipeline review.
PRO TIP
Set the behavioral pillar to decay on a 60-to-90-day clock. An account that showed strong intent last quarter and nothing since is not a green account anymore, and a rubric that pretends otherwise sends reps after cold deals.
Frequently Asked Questions
An ICP in B2B SaaS is a data-backed description of the company accounts most likely to buy, expand, and renew. It defines the firmographic, technographic, behavioral, and disqualifying attributes of a best-fit account at the company level, separate from the individual buyer persona and from lead-level scoring of specific contacts.
The ICP scoring model is a weighted rubric that assigns point values across four pillars, firmographics, technographics, behavioral and intent signals, and negative signals, then sums them into a 0-100 fit score. The score sorts each account into a green, yellow, or red tier that decides who works it and how fast.
Score each account’s attributes to get a raw 0-100 per pillar, multiply each pillar by its weight (for example 35% firmographic, 25% technographic, 40% behavioral), sum the weighted pillars, subtract any negative signals, and normalize to 0-100. The final number maps directly to a routing tier.
Lead scoring helps B2B companies rank individual contacts by buying readiness so sales works the hottest leads first. ICP scoring works one level up, ranking whole accounts by fit. Used together, account fit decides which companies matter and lead scoring decides which person inside them to call now.
Common thresholds set green at 80-100 for immediate sales outreach, yellow at 60-79 for marketing follow-up, and red below 60 for low-touch or disqualification. Treat these as starting points: back-test them against your closed-won accounts and shift the cutoffs until each tier predicts real conversion in your own pipeline.
It is a weighted 100-point scorecard that grades an account on firmographic fit, buying authority and executive persona, timing and intent signals, and strategic fit, then subtracts negative signals, before a rep commits a personalized C-suite touch. The total routes the account to pursue-now, nurture, or disqualify, so expensive executive outreach goes only to accounts that can convert.
The four pillars are the same, but the weighting shifts. Because a personalized executive sequence is expensive and low-volume, reaching the right decision-maker at the right moment predicts a reply better than company size, so the rubric weights buying authority, executive persona, and trigger timing at the top and treats firmographics as a qualifier rather than the headline.
Reserve personalized executive outreach for green-tier accounts scoring 80 or above, where firmographic fit, a reachable decision-maker, and an active trigger all line up. Accounts at 60-79 are nurtured until a trigger fires, and accounts below 60 are excluded from executive and SDR cadences so reps stop spending senior-level touches on accounts that cannot convert.