
Marcus runs RevOps at a 240-person product-led B2B SaaS. His 2024 scoring model rewarded a free-trial signup that logged in four times in three days with +120 points, routed her to an SDR, and watched the deal die in week two. She had been a competitor researcher all along. Same week, an outbound contact at a target Series C account opened two emails and clicked one pricing-page link. His model gave that contact +35 and pushed it to the drip queue. Eleven weeks later, the same Series C account quietly bought a $58K annual contract through a different vendor. The scoring model had rewarded engagement that did not predict revenue and underweighted intent that did.
Generic 5-criteria scoring assumes contact-level engagement maps to buying intent the same way for every motion. Product-led SaaS breaks that assumption in three predictable ways: free-trial signups behave nothing like demo requests, product-usage signals carry information firmographic models cannot read, and PLG accounts collide with outbound-targeted accounts in the same CRM. This guide gives you the 24-signal weight table for B2B SaaS lead scoring built around Product Qualified Lead (PQL) activation events, free-trial cohort decay logic with day-of-trial weighting (including reverse-trial patterns), a PLG-and-sales-led merge that runs at the account level, and a reverse-ETL implementation pattern that brings your product data warehouse signals into HubSpot or Salesforce, plus a downloadable Sheets template ready to copy.
Key Takeaways
- PLG and sales-led need two parallel scoring tracks merged at the account level, not the contact level. The roll-up rule that survives both motions is account_score = max(PQL_account, MQL_account) + 0.5 × min(PQL_account, MQL_account) — the cross-validation premium recognizes a target account that also activated as the conversion gold path.
- Activation events (the first key action that defines value) carry +35 weight, the highest single signal in the table. Multi-user invitations from one account score +30 as an account-expansion signal, not a per-user signal. Recurring DAU (3+ days in week one) scores +20. These three signals plus pricing-page-visit-after-activation cover the bulk of PQL conversion variance.
- Free-trial decay is non-linear. 14-day trials decay linearly Day 1 to Day 14. 30-day trials run flat through Day 7 then decay linearly Days 8 to 30. Reverse-trial patterns (full access at signup, forced downgrade after N days) invert the curve and peak around Days 7 to 10 when usage limits start biting.
- The SaaS buying committee weights the End-User Champion (PM, developer, ops lead) at +30, the Economic Buyer (CFO, department head) at +25, and treats the Technical Veto (CTO, Security, IT) as a deal-killer at -50 when explicitly blocked. End-user weight runs higher than economic-buyer weight because adoption fails without the day-to-day user, regardless of executive sign-off.
- Reverse ETL from your product event store (Snowflake, BigQuery) through Hightouch, Census, or RudderStack into HubSpot custom properties or Salesforce custom objects is the implementation layer most SERP competitors skip. Without it, your scoring model cannot see the product-usage signals that drive PQL conversion. Quarterly recalibration against closed-won cohorts keeps the discrimination ratio above 4x.
Why Generic 5-Criteria Lead Scoring Fails for B2B SaaS
B2B SaaS lead scoring is the practice of weighting prospect signals against the realities of product-led growth, free-trial cohorts, multi-stakeholder buying committees, and the merge between self-service and sales-led motions inside one CRM. Generic 5-criteria models built for demo-request-driven SaaS break in three predictable ways: free-trial signup behavior diverges from demo-request behavior, product-usage signals carry information firmographic models cannot read, and PLG accounts collide with outbound-targeted accounts at the same CRM row.
The horizontal scoring fundamentals we walk through in lead scoring best practices for B2B teams hold across most B2B categories. SaaS breaks them on three fronts. Free-trial signups arrive without filling a marketing form, often using a personal email, with no firmographic data, and their first signal is a product event a horizontal model never sees. PLG accounts produce dozens of product events per week per user; trying to score every event drowns the model in noise. And sales-led outbound and PLG self-service routinely hit the same account from opposite directions. The scoring model has to resolve which motion owns the response without dropping signal from the other.
The model in this guide treats PQL signals as the spine and the firmographic side as a layered overlay, not the centerpiece. That ordering reflects what actually predicts SaaS conversion: a target-ICP account that does not activate converts at less than half the rate of a non-ICP account that does. Activation depth outranks firmographic fit when the two disagree, and the article frames the weight table around that finding.
PLG vs Sales-Led: One Scoring System, Two Tracks, Account-Level Merge
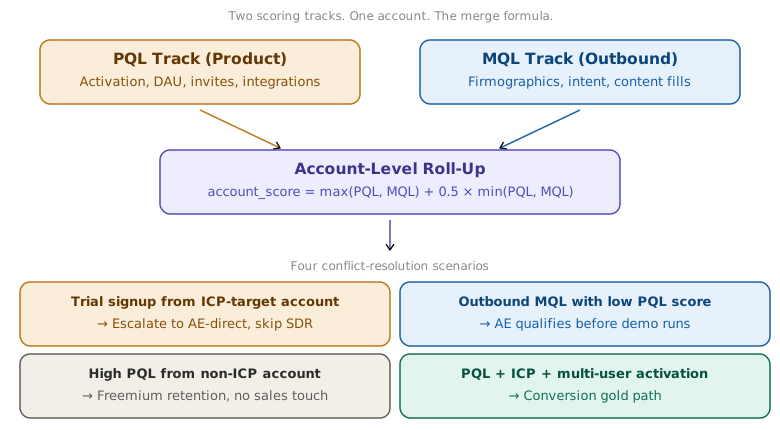
A PLG-and-sales-led scoring system runs two parallel scoring tracks and merges them at the account level. The Product track scores PQL signals from product-usage events. The Outbound track scores MQL and firmographic signals from forms, content, and intent data. Both tracks roll up to the same account, where the merge formula recognizes the cross-validation premium when both fire together. The roll-up rule that survives both motions is account_score = max(PQL_account, MQL_account) + 0.5 × min(PQL_account, MQL_account).
Why max + half-min instead of straight addition? Straight addition double-counts the buying signal. A contact who completes activation AND clicks an outbound email is one buying signal expressed two ways, not two buying signals. The merge formula treats the higher-scoring track as the primary signal and the lower-scoring track as cross-validation. Account-level scoring also reads inbound channels that feed self-service signup as part of the Product track, not the Outbound track, because the first event is the signup itself, not a marketing form fill.
The Four Conflict-Resolution Scenarios
Scenario 1, free-trial signup from an outbound-targeted account. A trial signup arrives from a domain that is already in the outbound ICP target list. Both tracks score above MQA. Escalate to AE-direct, skip SDR fast-track. The trial signup means a buyer at that account is already in your product; the outbound motion has been validated by behavior. Scenario 2, outbound MQL with low PQL score. A target-ICP contact clicks two emails and books a demo, but no one at the account has activated in product. AE qualifies before the demo runs, because the buying-committee absence inside the product means adoption risk runs high. Scenario 3, high PQL from a non-ICP account. Someone at a 30-person agency completes activation and invites three users. PQL track scores +95, Outbound track scores 0 (off-ICP). Hold in product-led freemium retention, no sales touch. The product is working as intended for non-ICP retention; sales cycles burn cycles converting them. Scenario 4, high PQL with ICP fit and multi-user activation. The conversion gold path. Target Series C account, two users activate within Day 1, a third user is invited Day 3, pricing page visited Day 5. Both tracks fire, the merge formula adds the cross-validation premium, account score crosses 95, route AE-direct with 15-minute response SLA.
Why Account-Level and Not Contact-Level
SaaS buying committees average between 3 and 6 stakeholders per evaluation cycle for deals above $25K ACV. A contact-level scoring model splits the signal across those stakeholders and surfaces 3 to 6 mid-scoring contacts where the account-level model surfaces 1 hot account. Sales reps acting on contact-level surfaces work outreach against the wrong buyer two times out of three. Account-level scoring lets the buyer self-identify by which contact crosses the routing threshold first, while the score lives on the account.
The PQL Signal-Weight Table: Product-Usage Activation Events
The PQL signal-weight table assigns starting weights to eight product-usage event categories that predict SaaS conversion: activation events, time-to-aha completion, multi-user invitations, API or integration setup, workflow creation, recurring DAU, export and share actions, and pricing-page visits after activation. These are starting weights. Calibrate them against your own closed-won conversion data quarterly, but the relative ordering holds across most product categories.
| # | PQL Signal | Starting Weight | What It Predicts |
|---|---|---|---|
| 1 | Activation event (first key action) | +35 | Single strongest predictor of conversion across PLG SaaS |
| 2 | Multi-user invitation from same account | +30 | Account expansion signal; team adoption began |
| 3 | Time-to-aha hit under benchmark (e.g. <5 min) | +25 | Onboarding worked; user grasped the value |
| 4 | Recurring DAU (3+ days in first week) | +20 | Stickiness; not a one-time evaluation |
| 5 | API or integration setup | +20 | Workflow embedding; high switching cost |
| 6 | Pricing-page visit AFTER activation | +20 | Re-engagement intent; the buying conversation started |
| 7 | Workflow creation or saved configuration | +15 | Investment in setup; rising switching cost |
| 8 | Export or share action (collaboration signal) | +15 | Internal champion behavior; circulated the value |
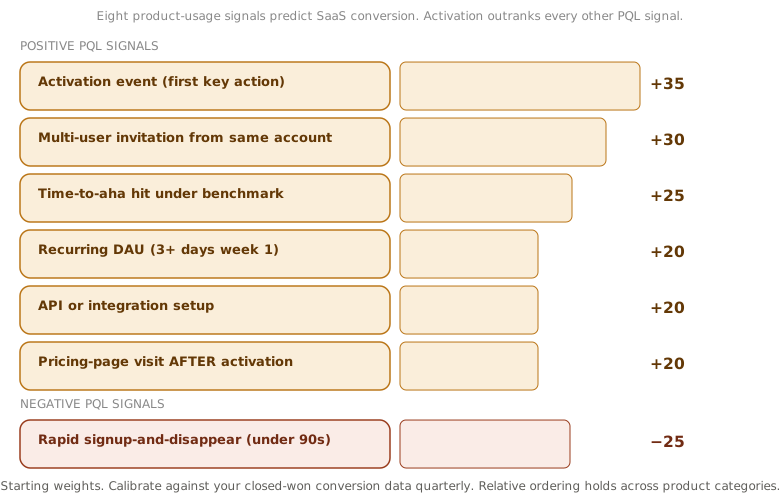
The reason activation outranks every other PQL signal is that nothing else happens reliably without it. A user who never completes the first key action never returns, never invites teammates, never visits the pricing page. Activation gates the entire downstream signal flow, so its weight reflects the cumulative information value of the events it enables.
Activation Definitions by SaaS Sub-Category
The single hardest part of building a PQL model is defining activation precisely. Activation is not “logged in” or “completed onboarding.” Activation is the first action that defines the product’s value and predicts continued usage. The definition varies by sub-category, and getting it wrong wrecks the model from the start.
Horizontal SaaS (Notion-like, Airtable-like, Linear-like): activation = first workspace or project created plus 3 collaborators invited. The value lives in shared workspaces, so single-user activity does not count. Vertical SaaS (LegalTech, HealthTech, FinTech, ConstructionTech): activation = first vertical-specific entity created (matter, case, account, project) plus the primary document or record attached. The value is workflow-specific, so the act of creating the first real artifact is the signal. Dev tools and infrastructure: activation = first API call from production environment plus repository or codebase connected. Sandbox-only API calls do not count because they do not predict production adoption. Observability and infrastructure monitoring: activation = first alert rule set plus integration to a source system. The product only delivers value once it is reading from a real source.
A model that defines activation as “logged in” labels 90% of signups activated and then watches conversion run flat against the score. A model that defines activation as the first key action labels 25% of signups activated and watches conversion run 3 to 8 times higher inside that band. The boundary between these two ways of defining activation distinguishes how MQL and SQL differ from PQL: PQL is gated on the product event, not the marketing event.
Account-Level PQL Aggregation
PQL signals roll up to the account, not the contact. A multi-user invitation is an account signal even though the originating contact triggered it. Recurring DAU on three different users at one account counts once at the account level at +20, not three times at +60. The aggregation rule prevents the model from over-weighting a single hyper-active user who is researching the product without buying authority. Sum the highest PQL weight from each signal category at the account level; do not sum across contacts.
Negative PQL Signals
Most SERP competitors stop at positive PQL signals. The negative side carries equal predictive weight. Declining DAU after Day 7 activation is a churn proxy, not a buying intent. A user who hit the product hard for a week and then dropped to once-a-week activity is leaving the trial, not entering the buying conversation. Score declining DAU at -15. Single-user activity on a multi-seat product tier is stuck adoption, not a buying signal. Score at -10. Pricing-page visits WITHOUT activation are tire-kicking; the visitor is comparing prices to evaluate against incumbents, not preparing to convert. Score at -5. Rapid signup-and-disappear (under 90 seconds inside product) is bot, competitor research, or wrong-product traffic. Score at -25.
Free-Trial Cohort Decay Logic: 14-Day vs 30-Day, Day-of-Trial Weighting
Free-trial cohort decay is the rule that determines how a PQL signal loses weight over time. 14-day trials decay linearly. 30-day trials decay piecewise. Reverse-trial patterns (full access at signup, forced downgrade after N days) invert the decay curve. Day-of-trial weighting recognizes that an event on Day 2 carries more information than the same event on Day 12 because early activation predicts conversion across every category Madkudu and OpenView have studied.
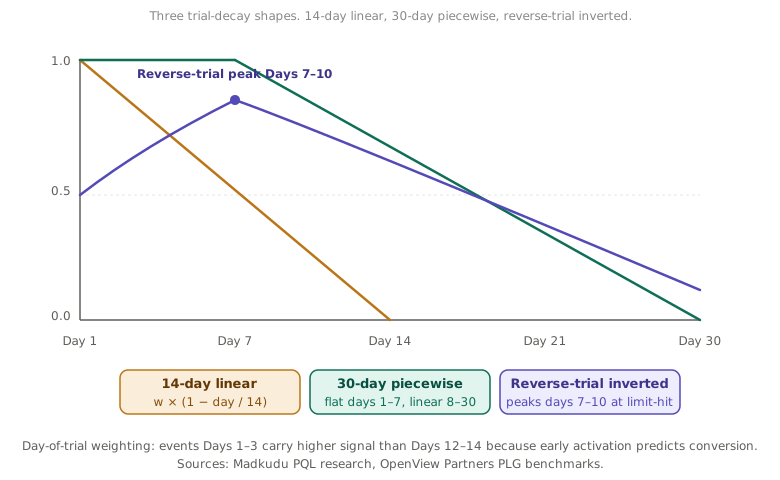
The decay formula for a 14-day trial: signal_weight × max(0, 1 − days_since_event ÷ 14). Day 1 weight = 1.0, Day 7 weight = 0.5, Day 14 weight = 0.0. The entire decision window is compressed, so signal decay tracks the trial clock directly. The decay formula for a 30-day trial runs piecewise: weight × 1.0 for Days 1 through 7 (the real evaluation window holds value at full strength), then weight × max(0, 1 − (days_since_event − 7) ÷ 23) for Days 8 through 30. Day 7 = 1.0, Day 18 = 0.5, Day 30 = 0.0. The Day-1-to-Day-7 flat period reflects that 30-day trials use the first week for setup and the next three for actual evaluation; decaying signal during setup understates the buying signal. OpenView Partners’ product-led growth research documents the activation-to-conversion lift that justifies the day-of-trial weighting rule.
Reverse Trial Patterns
Reverse trials grant full access at signup, then force a downgrade to a free or limited tier after N days. Linear, Cal.com, Notion, and several developer-tools have adopted this pattern. The decay curve inverts. Day 1 weight = 0.5 because the user has not yet hit usage limits. The curve peaks at Days 7 to 10 when usage limits start biting and the user is actively deciding whether to upgrade. After the downgrade, signal weight depends on whether the user continues using the limited tier (cool decline) or drops out (sharp decline). Score the peak-window pricing page visit at +30 (instead of the +20 standard) because intent has compounded with the limit-hit event.
Most SERP competitors do not even mention reverse trials, which means the decay curve they recommend will score reverse-trial users incorrectly. A reverse-trial Day 1 signup scored on the 14-day linear curve is rewarded for early activation that has not yet happened against meaningful limits. A reverse-trial Day 9 limit-hit event scored on the 14-day curve is decayed when it should be peaking.
Self-Service to Sales-Led Handoff Triggers
Three triggers escalate a self-service trial to a sales-led conversation regardless of cumulative score. User count above 5 on one account indicates team adoption and crosses the procurement-conversation threshold; route to AE within 24 hours. Usage above the free-tier threshold (1,000 API calls per day, 10K events per month, whatever your tier ceiling is) means the trial-tier economics will not sustain continued use; route to AE. Role-based escalation when an admin, VP, or C-suite contact activates inside the trial — even at low usage — surfaces an account where the buyer is already in the product; route to AE within 4 hours.
Time-Limited vs Usage-Limited Trial Decay Differences
Time-limited trials (the 14-day or 30-day calendar windows above) use calendar decay. Usage-limited trials (1,000 free events, 5 free seats, 100 free queries) use event-count decay where the “day” becomes “percentage of quota consumed.” A user who consumes 50% of their free quota in 3 days hits the same decay point as a 30-day trial user at Day 15. Score against quota-consumption percentage, not calendar days, for usage-limited products. Mixed models (time AND usage limits, like AWS-style free tier) decay against whichever limit is closer to exhaustion.
SaaS Buyer Committee: End-User Champion, Economic Buyer, Technical Veto
A B2B SaaS buying committee typically includes 3 to 6 stakeholders for deals above $25K ACV: the End-User Champion who lives in the product daily, the Economic Buyer who owns the budget, and the Technical Veto roles (CTO, Security, IT) who can block the deal on architectural or compliance grounds. Scoring them at the same weight as a horizontal title score is a model error. SaaS weights end-user engagement higher than executive engagement because adoption fails without daily users regardless of executive sign-off.
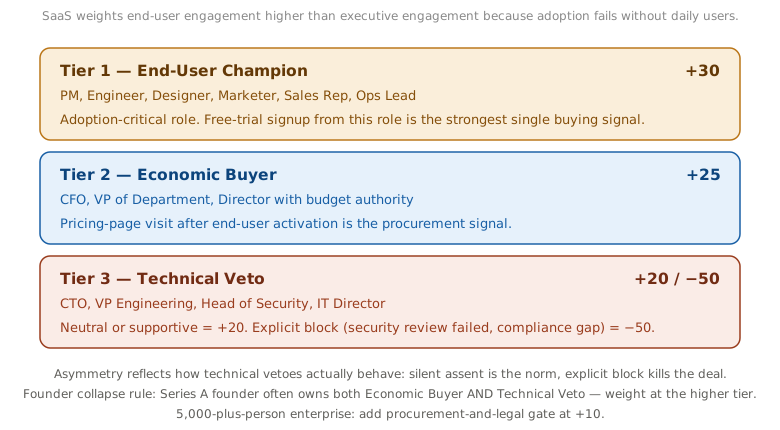
The horizontal title scoring patterns from the criteria framework with point values still apply to the firmographic gate, but the SaaS committee inverts the weight ordering. End-user roles outscore economic-buyer roles, because the SaaS adoption failure mode is “the team never used it,” not “finance never approved it.”
The Three-Tier Committee Structure
End-User Champion (+30): Product Manager, Engineer, Designer, Marketer, Sales Rep, Ops Lead — the role that lives inside the product daily and owns the workflow the product replaces or augments. Engagement here is load-bearing because adoption fails without them. A free-trial signup from this role at a target account is the strongest single buying signal in SaaS. Economic Buyer (+25): CFO, VP of department, Director with budget authority. Engagement signals budget intent. An economic-buyer pricing-page visit after the end-user champion has activated is the procurement signal. The deal moved from “evaluating” to “deciding.” Technical Veto tier (variable, -50 if blocked): CTO, VP Engineering, Head of Security, IT Director. A neutral or supportive technical evaluator is a +20 signal. An explicitly blocked deal (security review failed, compliance gap flagged, architectural mismatch identified) is -50. The deal is dead until the blocker resolves. The asymmetry reflects how technical vetoes actually behave: silent assent is the norm, explicit block is the exception, and the explicit block kills deals more reliably than enthusiastic support saves them.
Role-by-Stage Modulation
Role weights modulate by company stage. At a Series A startup, the founder is often the economic buyer AND the technical veto; weight the founder at the higher of the two tiers when both roles collapse. At a 200-person Series C, role tiers separate cleanly. At a 5,000-person enterprise, an additional procurement-and-legal gate enters the committee at +10. The deal cannot close without contract sign-off even when the rest of the committee aligns. Score the procurement role at +10 when the account size puts it on the committee; ignore it for sub-200-person targets where contract review is informal.
Firmographic and ICP Tiers for SaaS Targets
SaaS firmographic scoring tiers a prospect by Annual Recurring Revenue (ARR) band, growth stage, tech-stack compatibility, and geography. Two of those four levers, tech-stack compatibility especially, come straight from the account-fit data these tiers rest on. ARR band predicts deal size and committee complexity; growth stage predicts buying urgency and budget elasticity; tech stack predicts integration depth; geography predicts compliance overhead. The four sit additively in the firmographic layer beneath the PQL layer. Those firmographic tiers are really the account-fit half of the picture, and folding them into a four-pillar ICP scoring rubric gives you one 0-100 fit score that decides which accounts deserve the PQL model’s attention in the first place.
The funnel mechanics behind ICP fit are covered in SaaS marketing metrics that explain the funnel; the model below stacks the firmographic weights specifically for committee-sized B2B SaaS deals.
ARR Band
Tier 1 ($50M to $500M ARR) +30: The committee-driven enterprise mid-market. Deals above $25K ACV, 3 to 5 month evaluation cycles, full buying committee. Tier 2 ($10M to $50M ARR) +25: Growth-stage SaaS, faster cycles (2 to 4 months), often founder-influenced decisions. Tier 3 ($1M to $10M ARR) +15: Early-stage targets, shorter cycles, smaller deals ($5K to $25K ACV). Pre-revenue or under $1M ARR (-10): below addressable for most enterprise-tier SaaS pricing. Override allowed for usage-based pricing that monetizes at any scale.
Growth Stage
Series A (+10): fast decisions, small deals. Series B (+20): scaling motion, ICP sweet spot. Series C/D (+25): committee-driven, larger deals. Pre-IPO and public (+15): slower cycles, larger deals, procurement-heavy. Bootstrapped (+5): variable; ARR band carries more weight than stage. Recent funding round announcement in last 90 days (+15): budget freed, buying initiatives green-lit.
Tech-Stack Compatibility
The integrations your product depends on appear in the prospect’s stack: +15 (the deal does not require a parallel migration). Competitor’s product currently in stack: +20 (active vendor-evaluation signal; rip-and-replace cycles are budget-validated). Direct replacement of a manual process (no incumbent vendor): +10. Tech stack signals are detectable via BuiltWith, Wappalyzer, or 6sense category-intent surge data. Score the named-integration match at +15 baseline; score competitor-replacement signal separately because the buying conversation already started.
Geography
Primary market (US/Canada/UK for most US-based SaaS) (+10). Secondary expansion market (EU, Australia) (+5). Non-expansion market (regions where you do not sell): 0 or negative depending on compliance and support load. Geography is the lowest-weight firmographic but distinguishes signal-only from buying-ready signal flow. Each of those firmographic fields reaches the score through ongoing B2B data enrichment that keeps location and headcount current.
Web Form Audit inspects the 21 canonical hidden fields used by HubSpot v2, Marketo, and Microsoft Dynamics Tier-A for campaign attribution, and flags what’s missing or misnamed.
Reverse ETL: Bringing Product Data Warehouse Signals into the CRM
Reverse ETL is the data pipeline pattern that moves product-usage events from your data warehouse into your CRM as scoring inputs. Most SERP competitors stop at “track product usage in your CRM” without explaining how product data gets there, which leaves readers stuck at the implementation gap. The path runs: product event store (Snowflake, BigQuery, Redshift) through a reverse-ETL layer (Hightouch, Census, RudderStack) into CRM custom properties (HubSpot custom properties, Salesforce custom objects, or Common Room signals).
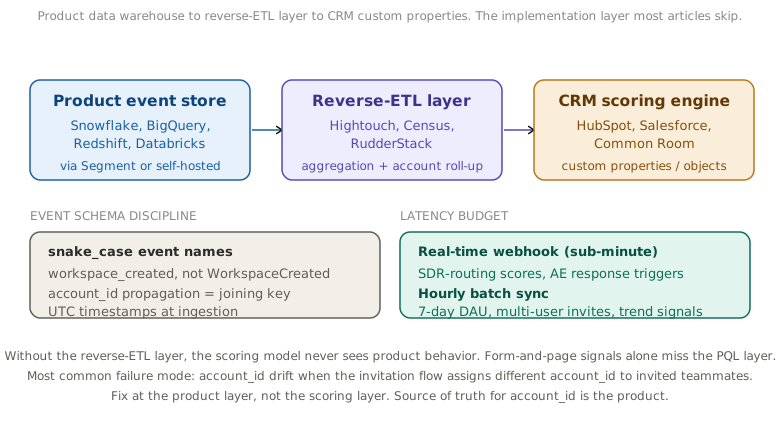
Product Data Warehouse to CDP to CRM Pipeline Pattern
Source layer: your product writes events to a Customer Data Platform (Segment, Rudderstack, self-hosted) which lands them in a data warehouse (Snowflake, BigQuery, Redshift, Databricks). The product team owns this layer because it powers product analytics, A/B testing, and dashboards before any scoring concern arrives. Reverse-ETL layer: Hightouch’s reverse-ETL documentation (and competing tools Census and RudderStack) reads aggregated product signals from the warehouse on a schedule (hourly, every 15 minutes, or near-real-time webhook) and writes them as custom properties on contact and account records in the CRM. Destination layer: HubSpot Lead Scoring or Salesforce Einstein consumes the custom properties as scoring inputs. The reverse-ETL layer is what makes the scoring model see product behavior; without it, the scoring model is limited to form-and-page signals that miss the PQL layer entirely.
Event Schema Standardization
Event names use snake_case (workspace_created, not WorkspaceCreated or workspace-created). The account_id field propagates through every event as the joining key. Without consistent account_id propagation, the reverse-ETL layer cannot roll up signals to the account level. Timestamps normalize to UTC at ingestion, never device-local time. Event payloads include both contact_id (the user) and account_id (the account they belong to) so the scoring layer can route the signal to the right grain.
The most common failure mode is account_id drift: a free-trial signup creates an account_id at signup time, the user invites two teammates, and the teammates get assigned a different account_id because the invitation flow used a different identifier. Fix this at the product layer, not the scoring layer. The source of truth for account_id must be the product, and every downstream system reads from it.
Latency Budget
Real-time webhooks (sub-minute latency) are necessary for SDR-routing scores where the AE needs to respond within 15 minutes of the activation event. Hourly batch sync (with 15-minute resolution) is fine for trend signals like 7-day DAU, multi-user invitations, or pricing-page-visit-after-activation. Daily batch sync is too slow for routing decisions but adequate for backtest model inputs. Mix the two: real-time for routing-threshold-crossing events, batch for everything else. Real-time across all signals burns reverse-ETL credits without improving outcomes for the slower-decaying signals.
Negative Scoring: Trial Abandonment, Stuck Adoption, and Disqualification
Negative SaaS scoring penalizes signals that look positive on the surface but predict churn or non-buying behavior. Trial abandonment after early high engagement, stuck single-user adoption on multi-seat tiers, personal email at signup, competitor domain in the email, and 90-day stalls all subtract weight. The horizontal disqualifier set from generic B2B scoring shifts in SaaS because the signal patterns shift. That baseline is worth knowing on its own, since the horizontal B2B negative-scoring framework these SaaS signals adapt from sets the default deductions, decay logic, and suppression thresholds before any product-led adjustments.
Negative Signals: What to Subtract
Trial abandonment after high engagement (-25): a user who activated, hit recurring DAU in week 1, then dropped to zero usage by week 2 is leaving the trial, not converting. The early-engagement signal was real but did not survive the value test. Stuck single-user adoption on multi-seat product (-15): the user activated but never invited teammates. For a multi-seat product, single-user adoption rarely converts because the value lives in team workflows. Personal email on B2B SaaS form (-20): stronger than generic B2B because product-led companies attract more researchers, hobbyists, and bootstrappers using personal emails. Competitor domain in email (-30): high-confidence competitor research, not a buying signal. 90-day stall after single engagement (-20): the user evaluated and chose not to proceed; subsequent dormancy is not buying intent. Free-tier user above 12 months without expansion signals (-10): stable freemium retention, not a conversion candidate.
The Stuck Adoption Signal vs the Churn Signal
Stuck adoption (one user, no team invites, low DAU after activation) and churn risk (was active, now declining) look similar on a dashboard but route to different teams. Stuck adoption is a product-team and onboarding-team problem; the activation flow failed to bring teammates in. Churn risk after recent activity is a CSM problem; the value started landing then stopped. Score them separately at the routing layer: stuck adoption flags into product-onboarding ops, churn risk flags into customer success. Both subtract from the lead score because neither is a buying signal, but the operational owner differs.
The 24-Signal SaaS Lead Scoring Weight Table
The 24-signal SaaS lead scoring matrix assigns starting weights across firmographic ARR band, growth stage, tech-stack fit, buying-committee role, PQL behavioral signals, intent signals, and negative signals. Total points per account, not per contact. MQA threshold defaults to 100. Decay window 30 days for time-limited trials (14-day → 14-day linear; 30-day → 30-day piecewise; reverse-trial → inverted curve). Quarterly recalibration aligned to product roadmap cadence.
| # | Signal Type | Specific Signal | Weight | Notes / Constraint |
|---|---|---|---|---|
| 1 | Firmographic (ARR band) | Tier 1 ($50M-$500M ARR target) | +30 | Committee-driven mid-market |
| 2 | Firmographic (ARR band) | Tier 2 ($10M-$50M ARR target) | +25 | Growth-stage sweet spot |
| 3 | Firmographic (ARR band) | Tier 3 ($1M-$10M ARR target) | +15 | Shorter cycles, smaller deals |
| 4 | Firmographic (ARR band) | Pre-revenue / sub-$1M ARR | -10 | Below addressable; override for usage-based pricing |
| 5 | Firmographic (growth stage) | Series B/C/D or pre-IPO | +20 | Budget freed, scaling motion |
| 6 | Firmographic (growth stage) | Recent funding round (last 90 days) | +15 | Budget freshly green-lit |
| 7 | Firmographic (tech-stack fit) | Required integration present in stack | +15 | No parallel migration required |
| 8 | Firmographic (tech-stack fit) | Competitor product currently in stack | +20 | Active vendor-evaluation signal |
| 9 | Role (End-User Champion) | PM / Engineer / Marketer / Ops Lead engaged | +30 | Adoption-critical role |
| 10 | Role (Economic Buyer) | CFO / VP department head / Director engaged | +25 | Budget authority signal |
| 11 | Role (Technical Veto) | CTO / Security / IT supportive or neutral | +20 | Permission signal |
| 12 | Role (Technical Veto) | Security review or compliance gap flagged | -50 | Deal blocker until resolved |
| 13 | PQL Behavioral | Activation event (first key action) | +35 | Strongest single PQL signal |
| 14 | PQL Behavioral | Multi-user invitation from same account | +30 | Account-expansion signal |
| 15 | PQL Behavioral | Time-to-aha under benchmark | +25 | Onboarding succeeded |
| 16 | PQL Behavioral | Recurring DAU (3+ days in first week) | +20 | Stickiness signal |
| 17 | PQL Behavioral | API or integration setup completed | +20 | Workflow embedding |
| 18 | PQL Behavioral | Pricing-page visit after activation | +20 | Buying conversation started |
| 19 | PQL Behavioral | Workflow creation or saved configuration | +15 | Rising switching cost |
| 20 | Intent (third-party) | 6sense / Bombora category-intent surge | +25 | Outside-product buying-cycle signal |
| 21 | Negative | Trial abandonment after high engagement | -25 | Engaged but did not convert |
| 22 | Negative | Personal email on B2B SaaS form | -20 | Researcher or hobbyist signal |
| 23 | Negative | Competitor domain in email | -30 | Competitor research, not buying |
| 24 | Negative | Declining DAU after Day 7 activation | -15 | Churn proxy, not buying intent |
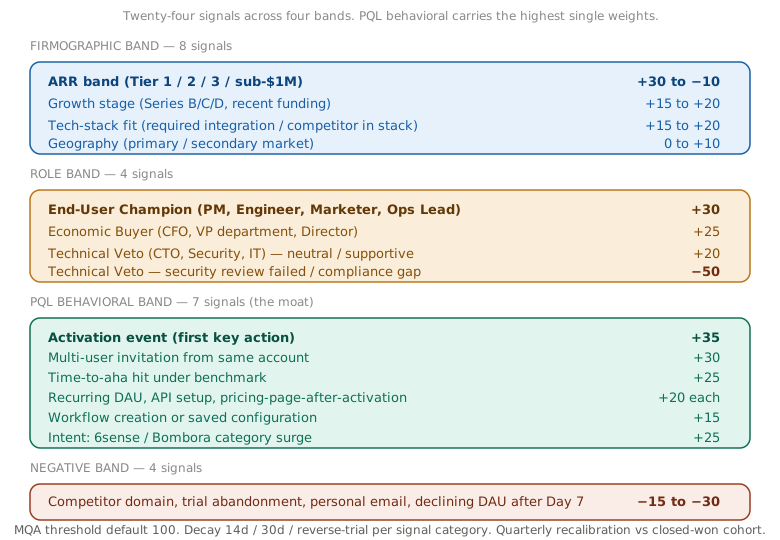
Worked Example: SaaSCo-X (Series C, 240-Person B2B SaaS)
SaaSCo-X, a 240-person Series C target with $40M ARR, accumulates over 21 days inside a 30-day free trial: Tier 2 ARR band (+25), Series C growth stage (+20), competitor product in stack (+20), PM activated Day 1 (+30 end-user champion + +35 activation = +65), multi-user invitation Day 3 (+30), recurring DAU 4 days in week 1 (+20), pricing-page visit Day 11 (+20), CFO email opened Day 14 (+25 economic buyer), 6sense intent surge for the product category (+25). Total: 250 points, MQA threshold (100) crossed 2.5 times. Route AE-direct with 15-minute response SLA.
Contrast: a horizontal contact-level model splits these signals across 3 contacts (the PM, the invited teammates, and the CFO), and each contact scores between 35 and 85. Each contact sits below the standard MQL threshold of 50; the account surfaces as 3 mediocre individual leads instead of 1 hot account. The SaaS model surfaces it because it scores at the account level with PQL behavioral signals at the top.
Implementing Self-Service + Sales-Led Scoring in HubSpot, Common Room, or Madkudu
Implementing the 24-signal SaaS scoring model requires three layers: a reverse-ETL pipeline to bring product events into the CRM, a scoring engine to combine product and firmographic signals, and a routing layer to translate score into action. HubSpot Professional or Enterprise handles all three for teams under 5,000 historical closed-won leads. Common Room specializes in PLG signal aggregation. Madkudu adds a predictive ML layer above 5,000 historical leads. Salesforce Einstein is the alternative scoring engine for Salesforce-anchored stacks.
HubSpot Lead Scoring with Reverse-ETL Inputs
Build the 24-signal model as a custom score in HubSpot Professional or Enterprise. Configure Hightouch or Census to write PQL signal fields (activation_event_date, multi_user_invite_count, recurring_dau_week_1, integration_setup_complete, etc.) as custom contact properties or custom company properties. HubSpot’s score-property builder reads from custom properties natively, so once the reverse-ETL layer populates them, the scoring rules compose normally. HubSpot Academy’s lead scoring course walks through the rule-builder UI. The decay formula applies via calculated properties: score_weight × max(0, 1 − days_since_signal ÷ decay_window). Adjust decay_window per signal category (14 for short-trial PQL events, 30 for long-trial events, 60 for firmographic enrichment).
Common Room for PLG Signal Aggregation
Common Room ingests product-usage signals, community signals (Slack, Discord, GitHub), and CRM data into one signal layer. For PLG-heavy motions where the community signals carry buying intent (open-source adoption, Slack community engagement, developer-tool stars-and-forks), Common Room saves the reverse-ETL build by ingesting from sources directly. Pair Common Room’s signal aggregation with HubSpot’s scoring engine, or use Common Room’s native scoring for accounts where the community signals dominate.
Madkudu Predictive Scoring Above 5,000 Historical Leads
Madkudu adds an ML predictive layer over the rule-based 24-signal model. The transition threshold is 5,000 scored historical leads with closed-won outcomes; below that, the model overfits on noise and sales loses trust. Above 5K, Madkudu surfaces signal combinations the rule writer missed (signal interactions, time-decay non-linearities, role-by-stage modulation) that the rules-based model treats as independent. Hybrid approach: run Madkudu in parallel with the rules-based score; flag for manual review when the two diverge by 20+ points on the same account. The lead-gen tool stack ranked by job covers tool selection across the full RevOps surface, not just scoring.
Salesforce Einstein for Salesforce-Anchored Stacks
For Salesforce-anchored stacks, Einstein consumes custom-object fields the same way HubSpot consumes custom properties. The reverse-ETL destination changes from HubSpot custom properties to Salesforce custom objects (Product_Event__c or PQL_Signal__c). Einstein’s auto-feature-selection picks up the new fields automatically; manual feature configuration is only needed to exclude fields that should not enter the model (PII, test fields, fields with high missing-value rates).
Routing Rules: Score-to-Action Triggers
Routing rules translate cumulative account score into a sales or product action. Four thresholds map score bands to actions: 0 to 30 drip, 31 to 65 self-serve email cadence, 66 to 85 SDR fast-track, 86 and above AE-direct. Time-to-touch SLAs tighten as score climbs. A separate reverse-routing rule sends high-score-but-stuck-adoption accounts back to the product team instead of forward to sales.
Score Thresholds Mapped to Action
0 to 30, drip. Email and retargeting cadence. No human sales touch. Most free-tier and freemium users live in this band indefinitely without progressing. 31 to 65, self-serve email nudge. In-product and transactional email cadence pushes the user toward activation and team invites. Still no human sales touch. The model is hoping for enough product signal to push the account to the next band. 66 to 85, SDR fast-track. SDR responds within 5 minutes during business hours; first email within 30 minutes for off-hours. Goal: qualify for AE handoff inside 24 hours. The 5-minute SLA is the deciding factor. Drift, Chili Piper, and similar tools measure conversion lift between 5-minute and 15-minute response and find 70%+ deltas. 86 and above, AE-direct. Skip SDR. AE owns first response within 15 minutes. Calendar slot offered in the first email. This band correlates with multi-signal accounts where PQL and Outbound tracks both fire above 50. The account is in the buying conversation already.
Reverse Routing for Stuck Adoption
The contrarian rule SERP competitors miss: a high score combined with stuck adoption is a product problem, not a sales problem. An account scores 88 on the cumulative model but the lead spent the last 5 days at zero DAU after a strong activation week, never invited teammates, and let the trial run down. Sending that account to an AE generates a frustrated buyer (“we already tried, the team did not adopt”) and burns the AE relationship for a follow-up cycle. Route to product-onboarding ops or CSM instead. Goal: diagnose why the activation that scored well failed to stick, fix it, then re-route to sales on the next signal cycle.
Time-to-Touch SLAs by Tier
The empirical conversion-lift curve for response time is steep below 30 minutes and flat above 2 hours. 5-minute response converts 4 to 8 times higher than 30-minute response for SDR fast-track band. 15-minute response is the AE-direct minimum because the buyer is actively in-product and a stale response loses to incumbent vendors with faster reps. Build the SLA into the routing layer with on-call rotations for business-hours coverage; do not rely on inbox monitoring.
Backtesting and Calibrating Your Score Against Closed-Won Cohorts
Backtesting validates that the scoring model is predictive, not descriptive. Define the closed-won cohort, compute score-at-conversion versus score-at-MQL, derive the discrimination ratio between top-quartile and bottom-quartile conversion rates, and recalibrate quarterly when the discrimination ratio drops or the product changes meaningfully.
Defining the Closed-Won Cohort
Pull all closed-won deals from the last 12 months. Filter to deals above $X ACV for the sales-led track (X depends on your pricing; typically $5K to $25K). Include all conversions for the PLG track regardless of deal size, because PLG conversion economics tolerate smaller individual conversions. Exclude churned accounts inside the 12 months (those are not buying signals; they are renewal risk). Exclude expansions of existing accounts (different signal pattern than new-logo conversions). The remaining cohort is your training and validation set.
Score-at-Conversion vs Score-at-MQL Comparison
For each closed-won account, compute two scores: the score on the day MQA threshold was first crossed, and the score on the day the deal closed-won. The lift between the two reveals whether the model is predictive (score climbed from MQA to close-won) or descriptive (score climbed because the deal already closed, not because the model surfaced it early). Predictive models show 30%+ score growth between MQA-cross and close-won. Descriptive models show score growth concentrated in the last 7 days before close, which means the model is detecting the deal late.
The Discrimination Ratio
Bucket all leads (won and lost) by score quartile. Compute conversion rate per quartile. The discrimination ratio is the top-quartile conversion rate divided by the bottom-quartile rate. A ratio of 4 or higher indicates the model is separating signal from noise. A ratio under 3 indicates the model is not discriminating effectively. Too much weight sits on noisy signals, not enough on predictive ones. Recalibrate weights against the discrimination ratio quarterly.
Quarterly Recalibration Cadence
Four signals trigger a weight re-tune outside the quarterly cadence: the discrimination ratio drops below 3x, the product team launches a feature that creates a new activation event, the sales motion shifts (new outbound segment, new ABM tier, new vertical expansion), or the ICP definition changes. Monthly recalibration is too noisy: random conversion-rate variation between months overwhelms model-quality signal. Annual is too slow: product changes inside 12 months invalidate weights that no longer reflect current usage patterns. Quarterly is the cadence where signal-to-noise resolves cleanly.
SaaS in the Broader Industry Cluster
B2B SaaS is one of five vertical lead-scoring deep-dives in the IVRIS industry cluster. Each weights different signal hierarchies, buying-committee shapes, decay windows, and regulatory contexts. The horizontal scoring fundamentals (what inputs the model needs from your inbound and product funnels) sit in the foundational lead-scoring pillar; the per-industry overrides live in each vertical’s deep-dive.
Healthcare scores HIPAA-compliant signals against clinical veto power and federal-vs-commercial buying segments. Manufacturing scores Tier-1 OEM versus Tier-2 supplier versus job shop with sector certifications (ISO 9001, IATF 16949, AS9100). Financial Services weights multi-stakeholder committees against GLBA and SOX. B2B E-Commerce scores multi-approver buying workflows where procurement carries the highest weight. Each vertical inverts a different assumption the horizontal model takes for granted.
Download the Industry Lead Scoring Template — the SaaS tab has all 24 signals, the PQL activation-event categories, the 14-day and 30-day and reverse-trial decay formulas, the account-level merge logic for PLG and sales-led, and the MQA threshold calculator pre-built. Healthcare tab launches in mid-June 2026; Manufacturing, FinServ, and E-Commerce tabs follow.
Frequently Asked Questions
MQL (Marketing Qualified Lead) is a lead who crossed a marketing-engagement threshold (form fills, content downloads, email engagement). SQL (Sales Qualified Lead) is a lead the sales team has accepted as ready for active selling. PQL (Product Qualified Lead) is a lead who completed activation inside the product itself, the first key action that defines value. PQL is the SaaS-native qualification grade and outranks MQL as a conversion predictor for product-led motions because the user has already experienced the product’s value. The 24-signal model treats activation events at +35, the highest single signal weight, reflecting PQL’s primacy.
The practical threshold is 5,000 scored historical leads with closed-won outcomes. Below that, ML models overfit on noise. They detect patterns in the training set that do not generalize, and sales loses trust quickly when AI-flagged leads do not convert. Above 5K, ML surfaces signal combinations the rule writer missed (signal interactions, role-by-stage modulation, time-decay non-linearities). Hybrid is the safest path: run rules-based scoring as the primary system and ML predictive as a parallel check; flag for manual review when the two diverge by 20+ points on the same account.
This is Scenario 1 from the four-conflict-resolution rule. Both scoring tracks fire: the Product track scores PQL activation signals from the trial signup, and the Outbound track scores firmographic and ICP-fit signals from the target account list. The merge formula adds the cross-validation premium: account_score = max(PQL, MQL) + 0.5 × min(PQL, MQL). Escalate the account to AE-direct, skip SDR fast-track, because the trial signup validates that a buyer at the target account is already in the product. The AE owns first response within 15 minutes.
SaaS uses a shorter decay window than traditional B2B because evaluation cycles compress around the trial calendar. 14-day trials decay PQL signals linearly Day 1 to Day 14. 30-day trials run flat for Days 1 to 7 (the real evaluation window) then decay linearly Days 8 to 30. Reverse trials invert the curve: Day 1 weight = 0.5, peaks Days 7 to 10 when usage limits start biting. Firmographic signals decay slower (60 days) than PQL signals (14 to 30 days) because account-level facts move on a longer timescale than user-level events.
Direct push works for simple event volumes (under 100K events per month) but breaks at scale. Reverse ETL through Hightouch, Census, or RudderStack handles aggregation, deduplication, account-level roll-up, and rate-limit management between the product event store and the CRM. Without aggregation, you ship every login event to HubSpot and burn through API quota; without account-level roll-up, the scoring layer sees per-contact events instead of per-account signals. For PLG SaaS with thousands of users per week, reverse ETL is the only stable path. The reverse-ETL layer also lets you tune the latency budget per signal (real-time for routing-threshold events, hourly batch for trend signals).





