You’re tracking MQLs, website traffic, and maybe CAC. But when your CEO asks whether marketing is actually driving revenue growth, you scramble to connect the dots. Most B2B SaaS marketing teams measure activity instead of impact, and the gap between “we’re busy” and “we’re profitable” shows up in every board meeting.
The fix isn’t tracking more saas marketing metrics. It’s tracking the right ones, in the right order, and connecting them to the financial outcomes your leadership team actually cares about. This guide covers the 15 KPIs that B2B SaaS marketing teams should monitor, with the formulas, benchmarks, and context you need to turn raw numbers into decisions. If your business is B2B but not SaaS specifically, our broader B2B marketing metrics guide covers the 15 KPIs that work across business models.
Key Takeaways
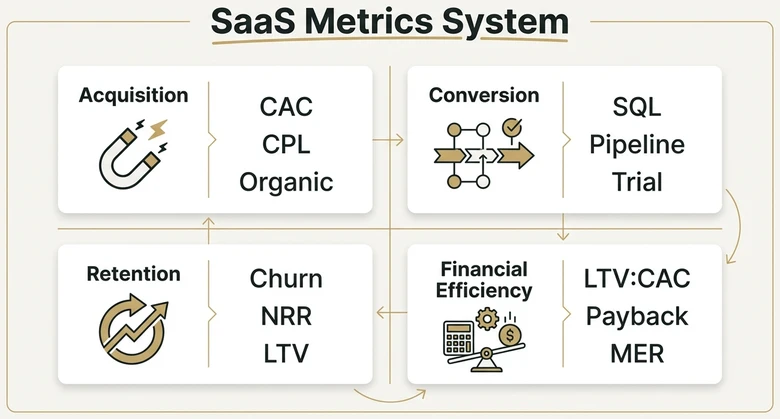
- SaaS marketing metrics fall into four categories: acquisition, conversion, retention, and financial efficiency. Track at least two from each.
- CAC and LTV are meaningless in isolation. The LTV:CAC ratio (target: 3:1 or higher) is the metric that tells you if your growth is sustainable.
- Net Revenue Retention (NRR) above 120% means your existing customers grow your revenue even without new sales.
- Marketing-sourced pipeline and revenue attribution matter more than MQL counts for proving marketing’s value.
- Build a dashboard that connects leading indicators (traffic, MQLs) to lagging indicators (revenue, NRR) so you can act before problems hit the P&L.
What Are SaaS Marketing Metrics?
SaaS marketing metrics are quantifiable measurements that track the performance, efficiency, and revenue impact of marketing efforts within a software-as-a-service business model. Unlike traditional product marketing metrics, SaaS metrics account for recurring revenue dynamics, customer lifetime value, and the compounding effect of retention on long-term growth.
The distinction matters because SaaS economics are fundamentally different from one-time purchase models. You invest heavily upfront to acquire a customer, then earn back that investment over months or years of subscription payments. If your metrics only measure the front end (leads generated, demos booked), you’re flying blind on whether those customers actually generate positive ROI over their lifetime.
The metrics that matter break into four groups: acquisition (how efficiently you attract new prospects), conversion (how effectively you turn prospects into customers), retention (how well you keep and grow existing customers), and financial efficiency (whether the math actually works). Let’s walk through each. Each of those groups reduces to a rate, and putting a conversion rate together in SQL is the same safe division every time: a count over a count, guarded against an empty denominator.
Acquisition Metrics: How You Attract New Prospects
1. Customer Acquisition Cost (CAC)
CAC measures the total cost of acquiring one new customer. It includes every dollar spent on marketing and sales: ad spend, content production, tool subscriptions, salaries, commissions, and overhead.
Pricing is the fastest lever for improving unit economics — see our B2B pricing strategy guide for models that pair well with these metrics.
CAC = (Total Marketing + Sales Costs) ÷ Number of New Customers AcquiredA realistic benchmark for B2B SaaS is $200-$600 for SMB customers and $5,000-$15,000+ for enterprise deals. But the number alone means nothing. A $10,000 CAC is perfectly healthy if your customer’s lifetime value is $50,000. It’s a disaster if LTV is $8,000.
Track CAC by channel (organic, paid, outbound, events) to identify which acquisition paths deliver the best economics. Most teams find that organic search and referrals produce the lowest CAC, while paid channels and outbound produce faster results at higher cost. That channel comparison only holds when the underlying CAC math is right — the headline number most teams report typically underestimates fully-loaded CAC by 25 to 40 percent, which leaves the channel ranking resting on a wrong baseline.
2. Marketing Qualified Leads (MQLs) and Sales Qualified Leads (SQLs)
MQLs are prospects who’ve taken actions indicating purchase intent based on your scoring criteria. SQLs are MQLs that sales has reviewed and confirmed as worth pursuing. The ratio between them tells you about lead quality.
Benchmark: MQL-to-SQL conversion should sit between 25-40% for healthy B2B SaaS organizations. Below 20% signals a scoring problem or a misalignment between marketing and sales on what “qualified” means.
The caveat: MQLs are becoming a contested metric. Many RevOps teams following modern best practices are shifting toward Marketing Qualified Accounts (MQAs) and pipeline contribution as primary measures, using MQLs only as a leading indicator.
3. Organic Traffic and Share of Voice
Organic traffic measures visitors arriving from unpaid search results. Share of Voice (SOV) measures how often your brand appears in search results compared to competitors for your target keywords.
These are leading indicators: they don’t directly generate revenue, but they predict future pipeline. According to Semrush research, B2B SaaS companies with strong organic presence typically generate 40-60% of their pipeline from inbound channels. A solid B2B SEO strategy is the foundation of sustainable acquisition economics.
Getting accurate traffic data starts with a proper GA4 configuration. Our Google Analytics traffic guide for B2B walks through the setup most teams skip.
4. Cost Per Lead (CPL)
CPL measures what you spend to generate a single lead across specific channels or campaigns.
CPL = Total Campaign Spend ÷ Number of Leads GeneratedB2B SaaS CPL benchmarks vary widely. Content marketing typically delivers leads at $50-$200 each. Paid search runs $100-$500. Event marketing can exceed $1,000 per lead.
The key is comparing CPL against downstream conversion rates. A $500 lead that converts at 15% is cheaper per customer than a $100 lead that converts at 1%.
Conversion Metrics: Turning Prospects Into Customers
5. Lead-to-Customer Conversion Rate
This tracks the percentage of leads who ultimately become paying customers, measured across your entire funnel.
Conversion Rate = (New Customers ÷ Total Leads) × 100Benchmark: Overall lead-to-customer conversion for B2B SaaS typically ranges from 2-7%. Top performers push above 10% through better targeting and email drip sequences. If you’re below 2%, either your lead quality is poor or your sales process has leaks.
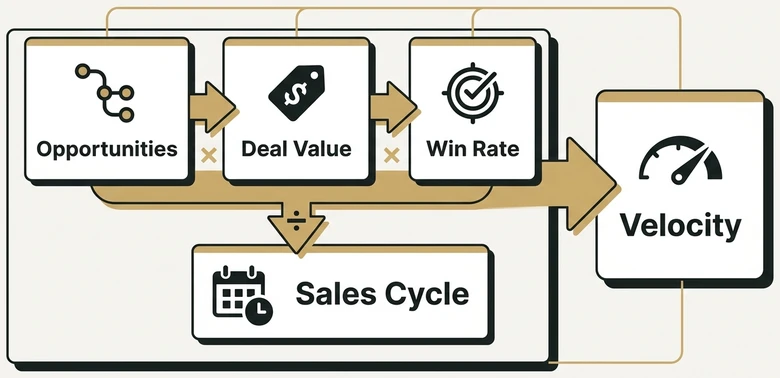
6. Pipeline Velocity
Pipeline velocity measures how quickly revenue moves through your sales pipeline. It’s one of the most useful metrics for forecasting because it combines multiple variables into a single indicator.
Pipeline Velocity = (Number of Opportunities × Average Deal Value × Win Rate) ÷ Average Sales Cycle LengthTrack this monthly and compare it against your revenue targets. If velocity slows, diagnose which variable changed: fewer opportunities, smaller deals, lower win rates, or longer cycles. Each points to a different fix.
PRO TIP
Pipeline velocity is the single best metric for weekly revenue standups. It gives your team a forward-looking view of whether pipeline can support next quarter’s targets, with enough lead time to make corrections.
7. Free Trial-to-Paid Conversion Rate
For SaaS companies offering free trials or freemium models, this metric tracks how many trial users convert to paid subscriptions.
Benchmark: Free trial conversion rates range from 2-5% for opt-out trials (credit card required) to 15-25% for opt-in trials with onboarding support. Freemium models typically convert 1-4% of free users to paid plans.
If your trial conversion is below benchmark, examine your onboarding flow. Most trial users make their purchase decision within the first 3-5 days. If they haven’t experienced your product’s core value by then, they won’t convert. The full diagnostic sits one layer up — our SaaS sales funnel guide separates activation from conversion so a low trial-to-paid number can be traced to the stage that actually caused it. The scoring layer that translates activation behavior into a sales-routing signal sits one layer below — the PQL-weighted SaaS lead scoring model assigns starting weights to activation events, time-to-aha, multi-user invitations, and recurring DAU, then decays them on a 14-day or 30-day trial curve.
8. Marketing-Sourced Pipeline and Revenue
Marketing-sourced pipeline measures the total dollar value of sales opportunities that originated from marketing activities. Marketing-sourced revenue tracks how much closed-won revenue those opportunities generated.
This is the metric that answers your CEO’s question: “Is marketing making us money?” For B2B SaaS companies, marketing should source 30-50% of total pipeline and 20-40% of closed revenue. Track this with multi-touch attribution in your CRM using tools like HubSpot’s attribution reports or Bizible.
Retention Metrics: Keeping and Growing Customers
9. Churn Rate
Churn rate measures the percentage of customers (or revenue) lost during a specific period. It’s arguably the most critical saas marketing metric for long-term viability because churn compounds. A 5% monthly churn rate means you lose nearly half your customer base every year.
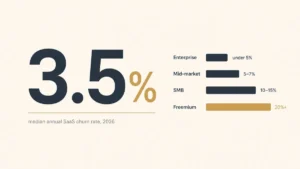
Customer Churn Rate = (Customers Lost in Period ÷ Customers at Start of Period) × 100Benchmark: Annual churn below 5-7% is considered excellent for B2B SaaS. Monthly churn under 1% is the gold standard. Enterprise SaaS with annual contracts often sees churn below 5%, while SMB-focused products with monthly billing may see 3-7% monthly churn.
10. Net Revenue Retention (NRR)
NRR is the metric that separates good SaaS companies from great ones. It measures the revenue retained from existing customers, including expansions and upsells, minus churn and contractions.
NRR = ((Starting MRR + Expansion MRR - Churned MRR - Contraction MRR) ÷ Starting MRR) × 100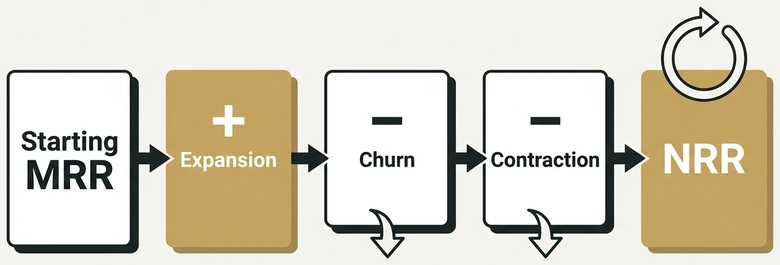
Benchmark: NRR above 100% means your existing customers generate more revenue over time without any new sales. Above 120% is best-in-class for enterprise SaaS. Companies like Snowflake and Datadog have reported NRR above 130%, meaning their existing customer base grows revenue by 30%+ annually even if they never sign another deal. Parloa’s 150% NRR is a current AI-software example of why this metric belongs beside every ARR growth headline.
For marketing teams, NRR is the ultimate proof that you’re attracting the right customers. High churn often traces back to poor-fit customers that marketing acquired through misaligned targeting or messaging. Whether your churn signals targeting trouble depends on segment — our benchmarks for churn in 2026 show the 38× spread across SMB, mid-market, and enterprise.
11. Customer Lifetime Value (LTV)
LTV estimates the total revenue a customer will generate over their relationship with your company.
LTV = ARPA (Average Revenue Per Account) × Customer Lifetime (1 ÷ Churn Rate)If your average monthly revenue per account is $500 and your monthly churn rate is 2%, customer lifetime is 50 months and LTV is $25,000. Knowing this number tells you exactly how much you can afford to spend acquiring each customer.
Financial Efficiency Metrics: Does the Math Work?
12. LTV:CAC Ratio
This ratio determines whether your growth model is sustainable. It tells you how much value each customer generates relative to what you spent to acquire them.

LTV:CAC = Customer Lifetime Value ÷ Customer Acquisition CostBenchmark: A 3:1 ratio is considered healthy, meaning each customer generates three dollars for every one dollar spent on acquisition. Below 1:1 means you’re losing money on every customer. Above 5:1 might mean you’re under-investing in growth and leaving market share on the table.
IMPORTANT
LTV:CAC is the single most-requested metric from SaaS investors and board members. If you can only get one metric right, make it this one. It tells you whether your company is building value or burning cash.
13. CAC Payback Period
CAC payback measures how many months it takes to recoup the cost of acquiring a customer from their subscription revenue.
Payback Period = CAC ÷ (ARPA × Gross Margin)Benchmark: Under 12 months is healthy for most B2B SaaS. Under 6 months is excellent. Above 18 months puts strain on cash flow and may require external funding to sustain growth. The shorter your payback period, the faster you can reinvest in acquiring more customers.
14. Monthly Recurring Revenue (MRR) and Annual Recurring Revenue (ARR)
MRR tracks the predictable monthly revenue from all active subscriptions. ARR is simply MRR x 12. These are the north star metrics for any SaaS business because they represent the recurring revenue foundation everything else builds on. Worth a footnote though — that “simply” hides a real disagreement about what counts as live ARR versus booked ARR, CARR, or pipeline ARR, and the wrong choice can change the headline number by 10-15%.
Track MRR components separately: New MRR (from new customers), Expansion MRR (from upgrades and upsells), Churned MRR (from lost customers), and Contraction MRR (from downgrades). Breaking MRR into components tells you where growth is coming from and where it’s leaking.
15. Marketing Efficiency Ratio (MER)
MER measures your overall marketing efficiency by comparing total revenue against total marketing spend.
MER = Total Revenue ÷ Total Marketing SpendUnlike ROAS (which measures specific campaigns), MER captures your entire marketing program’s efficiency, including brand, content, and activities that don’t generate directly attributable revenue. A healthy B2B SaaS MER typically falls between 5:1 and 10:1, meaning you generate five to ten dollars in revenue for every marketing dollar spent.
How to Build Your SaaS Metrics Dashboard
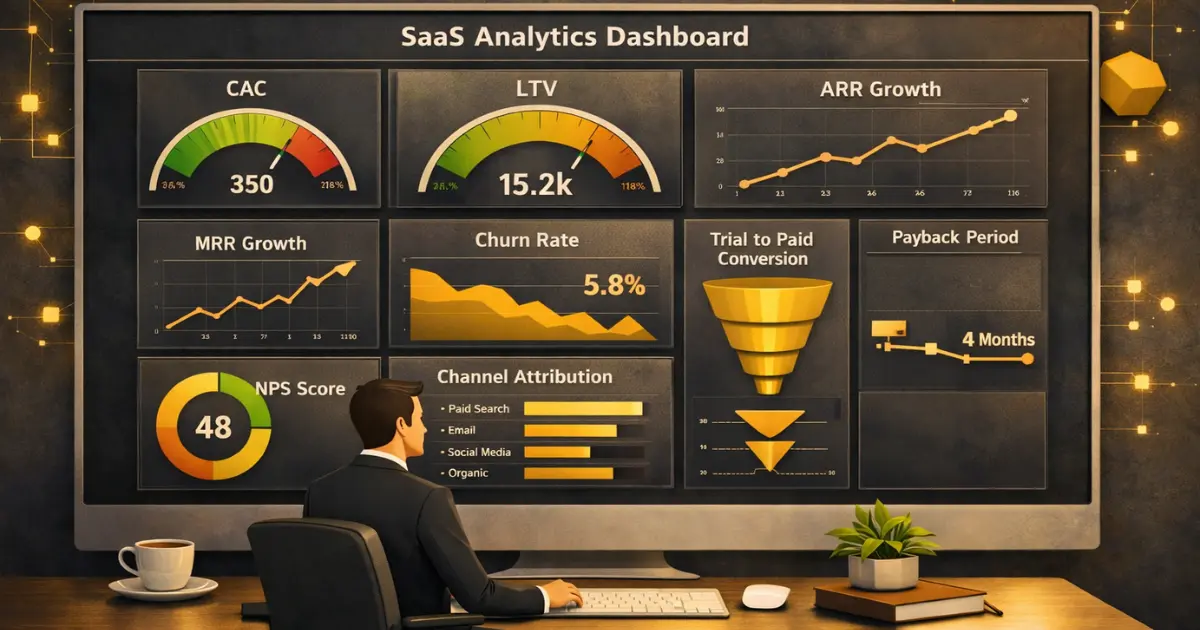
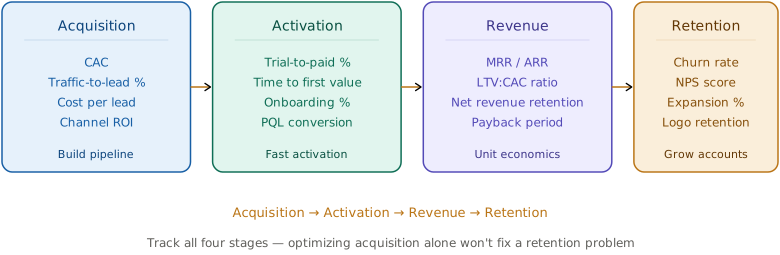
Tracking 15 metrics doesn’t mean staring at 15 charts every morning. Structure your dashboard in tiers.
Executive Dashboard (Weekly Review)
Limit this to five metrics: MRR/ARR trend, pipeline velocity, CAC payback period, NRR, and marketing-sourced pipeline percentage. These tell leadership whether the engine is working. Tools like Databox, Klipfolio, or your CRM’s native dashboards can pull these automatically.
Marketing Team Dashboard (Daily/Weekly)
Your team needs leading indicators they can act on: organic traffic trends, CPL by channel, MQL volume and quality scores, trial sign-ups, and conversion rates at each funnel stage. This is where you catch problems early, before they affect the executive metrics.
Monthly Deep Dive
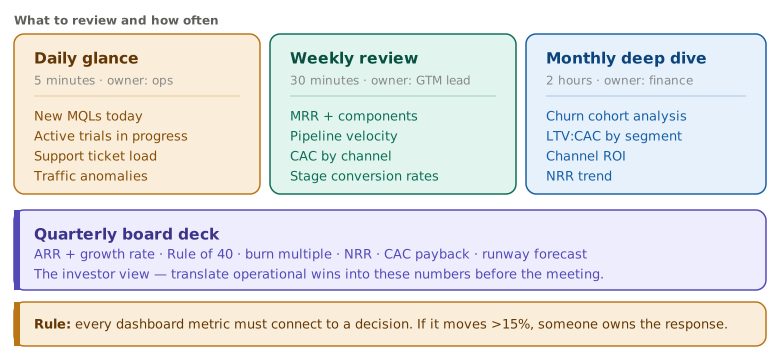
Once a month, review the full set: churn cohort analysis, LTV:CAC by segment, channel-level ROI, and content performance tied to pipeline. This is where strategic decisions happen: should you double down on paid, shift budget to content, or invest in retention programs?
The biggest mistake teams make is building a dashboard and never acting on it. Every metric should connect to a specific decision. If a number changes by more than 15%, someone should own the investigation and response. That rule is exactly what separates a working content marketing metrics dashboard from a decorative one, since a metric with no owner and no threshold drives no decision at all.
SaaS Metrics Benchmarks: What Good Looks Like in 2026
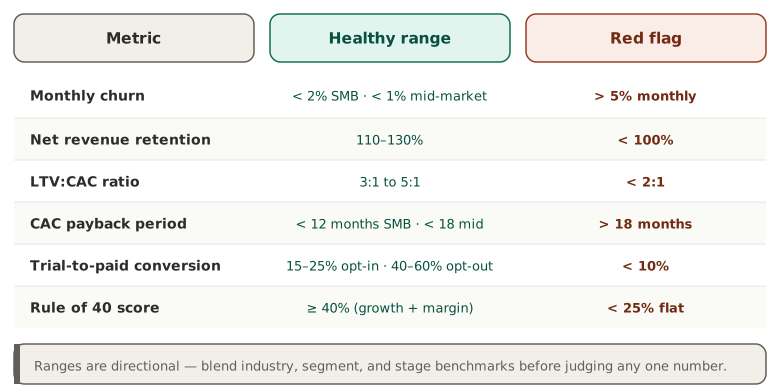
Raw numbers mean nothing without context. Here are the benchmark ranges that separate healthy SaaS companies from struggling ones, based on industry data and what we’ve seen working with B2B SaaS teams across multiple growth stages.
Acquisition Benchmarks
CAC: Varies wildly by segment. SMB SaaS typically sees $200-$500 CAC. Mid-market ranges from $2,000-$10,000. Enterprise can exceed $50,000. The number itself matters less than the ratio to LTV. A $20,000 CAC is healthy if LTV is $80,000.
MQL-to-SQL conversion: 15-30% is typical for B2B SaaS. Below 15% suggests your lead qualification criteria are too loose. Above 40% might mean they’re too tight and you’re leaving pipeline on the table.
Conversion Benchmarks
Lead-to-customer rate: 2-5% for inbound, 0.5-2% for outbound. If your inbound conversion is below 2%, the problem is usually qualification or the handoff between marketing and sales, not volume.
Free trial-to-paid: 15-25% for opt-in trials (credit card not required), 40-60% for opt-out trials (credit card required). If you’re below these ranges, your onboarding experience is likely the bottleneck.
Retention Benchmarks
Monthly churn: Below 2% for SMB SaaS. Below 1% for mid-market. Below 0.5% for enterprise. Annual customer churn above 10% in mid-market or enterprise is a red flag that warrants immediate investigation.
Net revenue retention (NRR): 100% is the baseline. 110-120% is good. Above 120% is exceptional. Top-performing SaaS companies consistently achieve NRR above 130%, meaning their existing customer base grows by 30%+ annually without any new logos. This is the single metric most correlated with SaaS company valuation multiples.
Financial Efficiency Benchmarks
LTV:CAC ratio: 3:1 is healthy. 5:1 or above is excellent. Below 2:1, you’re spending more to acquire customers than they’re worth. Above 7:1, you’re likely underinvesting in growth.
CAC payback: Under 12 months for SMB, under 18 months for mid-market. If payback exceeds 18 months, either prices need to increase or acquisition efficiency needs to improve. Companies following the 3-3-2-2-2 growth trajectory typically target payback under 12 months to maintain the capital efficiency that framework demands.
SaaS Metrics for Investors vs. Operators
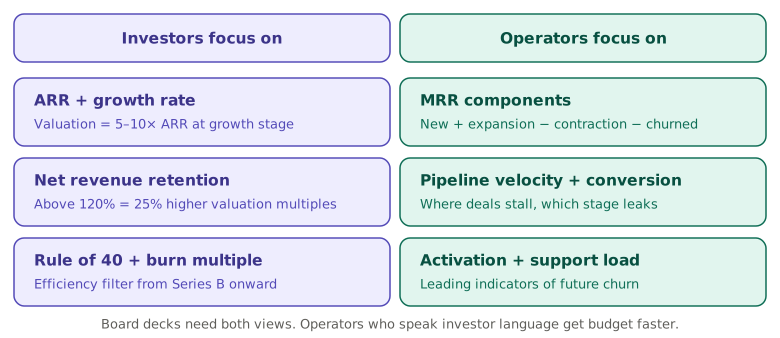
Investors and operators look at the same company through different lenses. Understanding which metrics each group prioritizes helps you build dashboards and board decks that answer the right questions for the right audience.
What Investors Focus On
ARR and ARR growth rate — this is the first number in every investor conversation. Early-stage valuations are expressed as revenue multiples (5-10x ARR is typical). Your ARR milestone ($1M, $5M, $10M) determines your fundraising timeline.
Net revenue retention — proves your product has long-term value. NRR above 120% signals to investors that growth compounds on its own. Below 100% means you need constant new customer acquisition just to stay flat.
Rule of 40 — growth rate plus profit margin should exceed 40%. At Series A, investors tolerate a low margin if growth is strong. By Series B, this metric becomes a near-universal filter. Companies scoring below 25% with no improvement trend face significantly tougher fundraising conversations.
Burn multiple — net burn divided by net new ARR. Below 1.5x is considered capital-efficient. Above 2.0x raises questions about sustainability. This metric replaced “growth at all costs” as the dominant investor framework after the 2022 market correction.
What Operators Focus On
MRR and its components — new MRR, expansion MRR, contraction MRR, and churned MRR. This breakdown shows exactly where revenue is growing or leaking. A $50K MRR increase that comes from $80K new and $30K churned is very different from $55K new and $5K churned.
Pipeline velocity and conversion rates — how fast deals move and where they stall. If pipeline velocity drops, operators need to know which stage is the bottleneck before it shows up in missed revenue targets.
Activation rate — the percentage of new signups that reach a predefined “aha moment” within the first 7-14 days. This is the leading indicator that most directly predicts retention and LTV. If activation drops, churn will rise 30-60 days later.
Support ticket volume per account — often overlooked, but it’s an early warning system. Rising ticket volume per account correlates with churn risk. Falling volume after an onboarding change confirms the change worked.
How to Measure SaaS Content Marketing
Content marketing is one of the hardest channels to measure in SaaS because the time between “reads your blog post” and “becomes a customer” can be months. Here’s how to track it without resorting to vanity metrics.
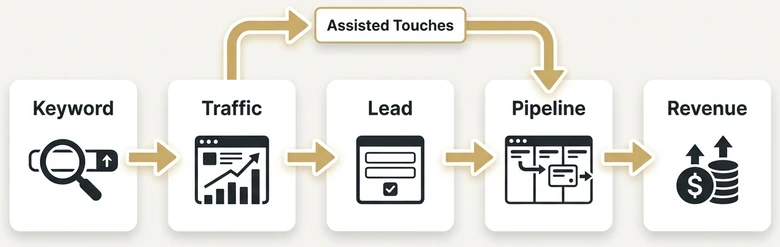
First-touch attribution by content. In your CRM, tag the first piece of content each lead consumed before entering the funnel. This tells you which articles attract future customers, not just which articles get traffic. A post with 500 visits and 3 pipeline-stage leads is more valuable than a post with 5,000 visits and zero.
Assisted conversions. Most B2B buyers consume 3-7 pieces of content before converting. Track multi-touch attribution to see which content appears repeatedly in winning deal paths. In Google Analytics, the assisted conversions report (under Advertising) shows which pages contribute to conversions without being the last touch.
Content-influenced pipeline. Run a monthly report: of all deals that closed this month, how many contacts consumed at least one piece of your content before entering the pipeline? This gives you a content-influenced revenue number that’s defensible in board presentations.
Keyword ranking → traffic → lead correlation. Track the chain: did your target keyword move up in rankings? Did that increase traffic? Did that traffic produce leads? If rankings improve but leads don’t follow, the content might be attracting the wrong audience or the page lacks a clear conversion path. For more on building this tracking chain, see our guide to B2B SEO strategy.
Common Mistakes When Tracking SaaS Metrics
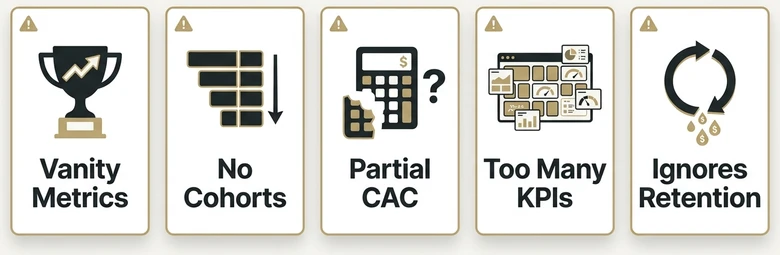
Measuring vanity metrics. Page views, social followers, and email open rates feel good but don’t predict revenue. Tie every metric to a downstream financial outcome.
Ignoring cohort analysis. Averages lie. A healthy-looking overall churn rate can mask a segment with 15% monthly churn buried inside a segment with 1% churn. Always break metrics down by acquisition cohort, customer segment, and time period.
Calculating CAC without fully-loaded costs. Your real CAC includes salaries, tools, overhead, and agency fees. Not just ad spend. Under-counting CAC makes your unit economics look better than they’re.
Tracking too many metrics. If your team monitors 30 KPIs, they’re monitoring zero KPIs effectively. Start with five, master them, then add more as your reporting infrastructure matures.
Ignoring the connection between marketing and retention. If marketing acquires customers who churn quickly, that’s a marketing problem, not just a customer success problem. Your acquisition targeting directly affects retention.
Frequently Asked Questions
The four most critical metrics are CAC, LTV, LTV:CAC ratio, and NRR. Together, they tell you whether you’re acquiring customers efficiently, retaining them profitably, and building sustainable growth. Everything else supports these four.
Review leading indicators (traffic, MQLs, CPL) weekly. Review financial metrics (MRR, CAC, churn) monthly. Run a full strategic review including LTV:CAC, NRR, and cohort analysis quarterly.
A 3:1 ratio is the industry standard for healthy B2B SaaS. Below 3:1 suggests you’re spending too much to acquire customers or not retaining them long enough. Above 5:1 may indicate room to invest more aggressively in growth.
Traditional metrics focus on one-time transactions: cost per sale, revenue per transaction, campaign ROI. SaaS metrics account for recurring revenue, making retention, expansion, and lifetime value central to the measurement framework. A customer’s value isn’t realized at purchase. It compounds over their subscription lifetime.
MRR (revenue baseline), churn rate (retention health), LTV (customer value), CAC (acquisition efficiency), and NRR (expansion strength). These five give you a complete picture of whether your SaaS business is growing sustainably. If you can only track five metrics, start with these and add more as your analytics mature.
Track three layers: first-touch attribution (which content brought leads into the funnel), assisted conversions (which content appears in winning deal paths), and content-influenced pipeline (what percentage of closed deals involved content consumption). Avoid relying on traffic alone. A blog post with 500 visits that generates 3 pipeline leads is more valuable than a post with 5,000 visits and zero leads.
Start Measuring What Matters
You don’t need a perfect analytics stack to start tracking saas marketing metrics that drive decisions. Open your CRM right now and answer three questions: What’s your current CAC? What’s your average customer lifetime? And what’s the ratio between them?
If you can’t answer those questions today, that’s your first project. Pull the data from your billing system and your marketing spend reports. Calculate LTV:CAC for your top three customer segments. The numbers might surprise you, and they’ll tell you exactly where to focus next.
Once you have those baselines, build a simple weekly dashboard with five metrics and review it every Monday. That single habit will do more for your B2B marketing campaigns than any new tool or tactic.