Most B2B marketers check Google Analytics the same way they check the weather: a quick glance at the homepage, maybe a nod at the traffic graph, then back to whatever felt more urgent. The data sits there collecting dust while pipeline meetings run on gut instinct.
The problem isn’t the tool. Google Analytics 4 tracks everything you need to connect marketing spend to revenue. The problem is that GA4 was built for everyone, and “everyone” defaults to ecommerce. B2B teams need different reports, different events, and a different way of reading the numbers.
After setting up GA4 for over a dozen B2B sites, we’ve found that most teams track too many vanity metrics and too few signals that actually predict pipeline. This guide covers the specific GA4 setup, reports, and traffic analysis techniques that matter for B2B companies. No generic tutorials. Just the reports and configurations that help you answer the question your CMO actually cares about: which channels drive revenue?
Direct answer – google analytics for b2b
Google Analytics for B2B means configuring GA4 to track pipeline-relevant traffic instead of vanity sessions. The core setup: filter out internal and bot traffic, mark B2B key events (generate_lead, file_download, book_demo), tag every campaign with UTM parameters, and link Google Search Console plus your CRM. Then read the Traffic Acquisition report by session source/medium and sort by key event rate, not session count. Unlike default GA4, which defaults to ecommerce, this connects channels to revenue.
Key Takeaways
- GA4’s Traffic Acquisition report is your starting point, but B2B teams need to customize it with session source/medium as the primary dimension and add key event tracking for lead actions.
- The default channel groupings hide critical B2B data. Custom channel groups for categories like “partner referrals” and “review sites” reveal where high-intent traffic actually originates.
- Filter out internal traffic, bot traffic, and dev environments before trusting any report. Dirty data leads to bad budget decisions.
- Connect GA4 to Google Search Console and your CRM. Without this, you’re measuring clicks instead of pipeline.
- Build three custom explorations: a lead source funnel, a content engagement report, and a channel quality scorecard. These replace the 15+ default reports most teams never open.
GA4 B2B Reports at a Glance: Which One, When
| Report / dimension | What it shows | Use when | Avoid relying on it when |
|---|---|---|---|
| Traffic Acquisition (by Session source / medium) | Where all sessions come from, including returning visitors, at granular source/medium detail | You need to make budget decisions and compare channel quality by key event rate | You only care about first-touch discovery — it counts returning visits too |
| User Acquisition | First-touch source for new users only | You want to know which channels introduce new prospects to your brand | You need converting-source data — first source and converting source rarely match in a 3-6 month cycle |
| Engagement (Pages and Screens / Landing Page) | Which pages get views, engagement time, and key events | You sort by key events to find content that converts, not just attracts | You sort by views — that surfaces traffic magnets, not pipeline drivers |
| Explore (Funnel, Free Form) | Custom lead-source funnels and channel-by-content matrices | Standard reports can’t answer the question — you need drag-and-drop dimensions | You need a fast weekly glance — build a Looker Studio dashboard instead |
What Is Traffic in Google Analytics?
Traffic in Google Analytics is the record of every visit to your website, tracked as “sessions.” Each session captures where the visitor came from, what pages they viewed, how long they stayed, and what actions they took. GA4 groups this traffic by source (Google, LinkedIn, direct), medium (organic, cpc, referral), and channel (Organic Search, Paid Social, Email).
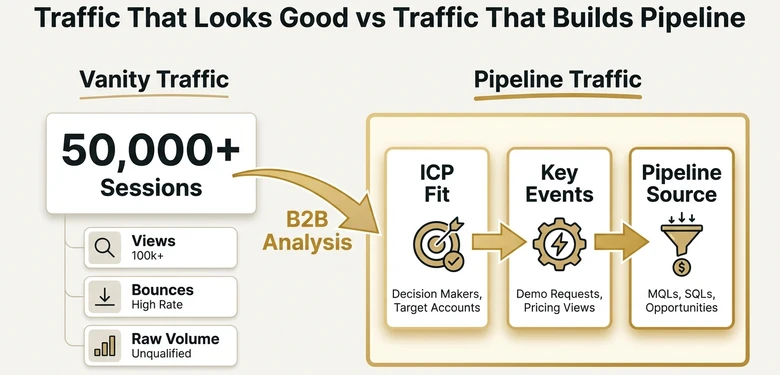
For B2B marketers, traffic data answers three questions that matter: which channels bring people to your site, which of those people match your ideal customer profile, and which channels eventually produce pipeline. The raw session count is the least interesting number in the report.
GA4 replaced Universal Analytics in July 2023, and the shift changed how traffic is measured. Universal Analytics tracked pageviews as the core unit. GA4 tracks events, which means every interaction (page view, scroll, click, form submission, video play) is recorded the same way. This gives B2B teams more flexibility to define what “valuable traffic” means for their specific sales cycle.
GA4 Traffic Reports Every B2B Marketer Needs
GA4 comes with dozens of pre-built reports. Most of them aren’t useful for B2B without customization. Here are the four reports worth your time, in the order you should check them.
Traffic Acquisition Report
Find it at Reports → Acquisition → Traffic Acquisition. This is your primary traffic dashboard. It shows where all sessions come from, broken down by channel, source, medium, or campaign. The default view groups traffic by “Session default channel group,” which splits visits into categories like Organic Search, Direct, Paid Search, Referral, and Email.
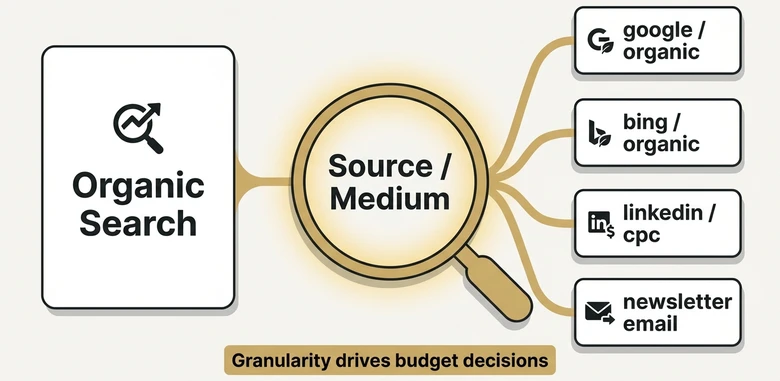
The first thing to change: swap the primary dimension from “Session default channel group” to “Session source / medium.” Channel groupings are too broad for B2B analysis. Knowing that 40% of traffic is “Organic Search” tells you less than knowing that 28% comes from google/organic while 12% comes from bing/organic. Source/medium gives you the granularity to make budget decisions.
PRO TIP
Add “Landing page” as a secondary dimension in your Traffic Acquisition report. This shows which pages each source lands on, revealing whether your LinkedIn traffic hits your homepage (low intent) or your pricing page (high intent).
User Acquisition Report
Find it at Reports → Acquisition → User Acquisition. This report shows how new users found your site for the first time. The difference matters for B2B: Traffic Acquisition shows where sessions come from (including returning visitors), while User Acquisition shows only first-touch sources.
Use User Acquisition to answer: “Which channels introduce new prospects to our brand?” Then use Traffic Acquisition to answer: “Which channels keep them engaged over a long sales cycle?” B2B buying cycles often span 3-6 months, so a visitor’s first source and their converting source are rarely the same. Once that channel data lands in a warehouse, working out a conversion rate per channel in SQL is a GROUP BY on the source column with a conditional average over the converted sessions.
Engagement Reports
Find it at Reports → Engagement → Pages and Screens. This report shows which pages get the most views, highest engagement time, and most key events. For B2B, sort by “Key events” rather than “Views” to see which content actually drives conversions instead of just traffic.
The Landing Page report (Reports → Engagement → Landing Page) is equally important. It shows the first page visitors see when they arrive. If your top landing pages are all blog posts but zero are product pages or case studies, your content is attracting researchers, not buyers.
Explorations for Custom Analysis
Standard reports only scratch the surface. GA4’s Explore tab lets you build custom reports with drag-and-drop dimensions and metrics. For B2B, three explorations are worth building from day one. We’ll walk through how to create each one later in this guide.
Understanding GA4 Traffic Sources and Channels
GA4 classifies every session using three layers: source, medium, and channel. Understanding the difference saves you from misreading your data.
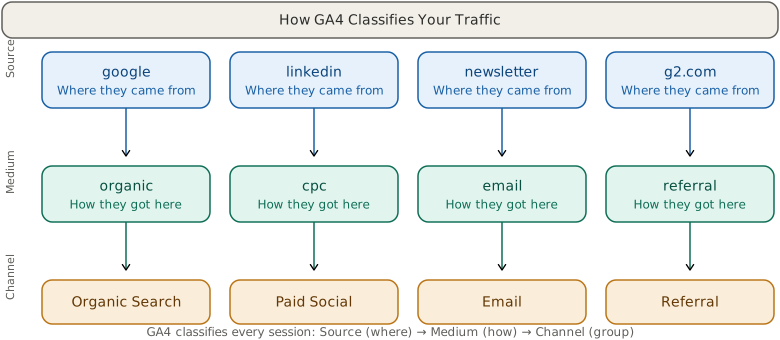
Source is the specific origin of traffic. Examples: google, linkedin, newsletter, partner-blog. It answers “where exactly did this visitor come from?”
Medium is the category of that source. Examples: organic, cpc, referral, email. It answers “what type of traffic is this?”
Channel is GA4’s automatic grouping of source/medium combinations into broader categories. Organic Search, Paid Search, Paid Social, Email, Referral, and Direct are the most common. GA4 uses a set of rules to assign every session to a channel. Those same rules are where individual campaign rows quietly disappear, which is why a campaign that ran can still show up as (other) once the dimension crosses GA4’s documented cardinality limit for the day.
Default Channels That Matter for B2B
Organic Search includes any visit from an unpaid search engine result. For most B2B sites, this is 40-60% of total traffic and the highest-quality channel by engagement metrics. If your organic traffic is below 30%, your content strategy for SEO needs attention — the upstream content production is what feeds this channel. Local service businesses tracking the same channel face different CPL math, which our local lead generation piece walks through with channel-level benchmarks.
Direct traffic means GA4 couldn’t identify the source. This happens when someone types your URL, clicks a bookmark, or arrives through a link that stripped referral data (like some email clients and messaging apps). In B2B, a growing Direct channel often signals strong brand awareness. But it also hides misattributed traffic, which we’ll address in the setup section.
Referral captures visits from links on other websites. For B2B, pay attention to referrals from review sites (G2, Capterra), partner websites, and industry publications. These visitors often have higher purchase intent than organic search visitors.
Paid Search and Paid Social track ad-driven visits. GA4 automatically tags Google Ads traffic if your accounts are linked. For LinkedIn Ads, Meta Ads, or other platforms, you need UTM parameters on every ad URL, or the traffic gets lumped into “Unassigned.” Even when a UTM is present, the click only classifies cleanly if the source/medium pair matches GA4’s recognized set — which is why operators review the URL itself against quality rules before the campaign goes live, not after the report surfaces an unfamiliar Unassigned spike.
Email shows traffic from email campaigns, but only if your links include utm_medium=email. Without UTM tags, email traffic gets misclassified as Direct. This is one of the most common B2B analytics mistakes.
IMPORTANT
GA4’s “Unassigned” channel catches everything it can’t classify. If more than 5% of your traffic is Unassigned, your UTM tagging has gaps. Audit your campaign links before drawing conclusions from channel data. Run the same audit one layer down, where submissions outnumber CRM records, because a tagging gap and a lead that never arrived look identical in a channel report and have nothing else in common.
If GA4 shows the right session but HubSpot loses the source, check HubSpot hidden fields missing UTM data before blaming channel attribution.
How to Set Up GA4 for B2B Traffic Tracking
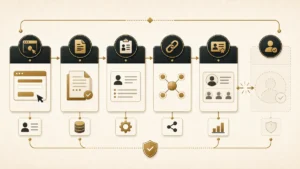
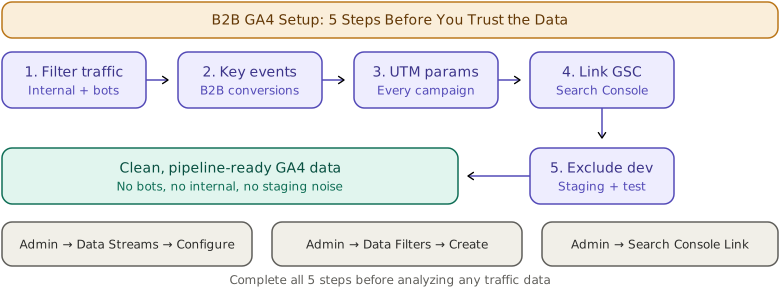
A default GA4 installation tracks page views and a few basic events. That’s enough for a personal blog. For B2B, you need to configure five things before the data becomes useful.
Step 1: Filter Out Internal and Bot Traffic
Go to Admin → Data Streams → your web stream → Configure Tag Settings → Define Internal Traffic. Add your office IP addresses (and VPN ranges if your team works remotely). Then go to Admin → Data Settings → Data Filters and activate the internal traffic filter.
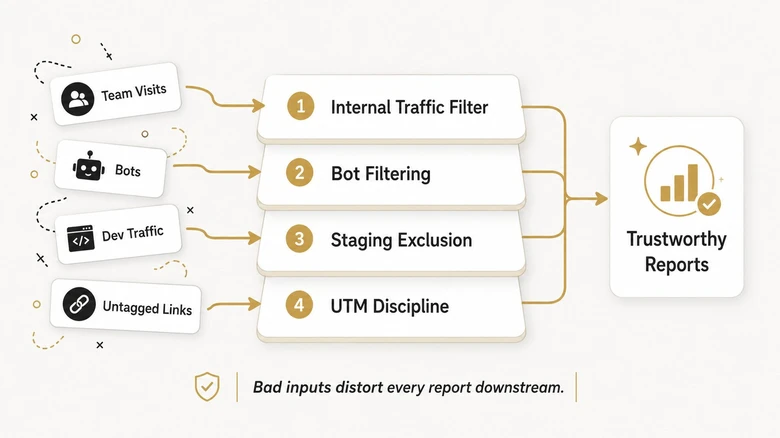
This step sounds basic, but we’ve audited B2B sites where 15-20% of “traffic” was the marketing team checking their own website. That noise distorts every report downstream.
Step 2: Set Up Key Events for B2B Conversions
GA4 calls conversions “key events.” The default events (page_view, scroll, click) don’t capture B2B buying signals. You need custom events for the actions that actually indicate pipeline potential.
For most B2B websites, track these as key events:
- generate_lead — contact form submissions, demo requests, quote requests
- file_download — gated content downloads (whitepapers, case studies, templates)
- sign_up — free trial or freemium account creation
- book_demo — calendar scheduling completions (custom event via Google Tag Manager)
- pricing_view — pricing page visits held for more than 30 seconds (custom event)
Mark each event as a key event in Admin → Events → toggle the “Mark as key event” switch. Without this step, your Traffic Acquisition report shows engagement metrics but no conversion data by channel.
Step 3: Implement UTM Parameters on Every Campaign
UTM parameters are tags added to URLs that tell GA4 where traffic came from. Without them, traffic from LinkedIn posts, email newsletters, partner links, and social shares all get classified as Direct or Referral with no campaign context.
Use Google’s Campaign URL Builder to create tagged links. Stick to a consistent naming convention:
utm_source: the platform (linkedin, newsletter, g2, partner-acme)utm_medium: the type (social, email, referral, cpc)utm_campaign: the specific campaign (spring-launch, webinar-q2, ebook-seo)
Document your UTM conventions in a shared spreadsheet so every team member tags links consistently. One person writing “LinkedIn” and another writing “linkedin” creates two separate sources in your reports.
Step 4: Link Google Search Console
Go to Admin → Product Links → Search Console Links. Connect your verified Search Console property. This adds two additional reports under Acquisition: Google Organic Search Traffic and Google Organic Search Queries.
These reports show the actual search terms people use before clicking through to your site, along with impressions, click-through rates, and average position. This is the only place in GA4 where you can see keyword-level data for organic traffic. If you’re investing in B2B SEO, this connection is non-negotiable. The connection still leaves about 47% of organic queries anonymized at Google’s source; the six recovery methods for (not provided) keywords cover what to do with the gap that GSC alone cannot close.
Step 5: Exclude Dev and Staging Environments
If your developers use a staging site that shares the same GA4 tracking code, their test traffic inflates your real numbers. Go to Admin → Data Streams → Configure Tag Settings → List Unwanted Referrals, and add your staging domains. Better yet, use a separate GA4 property for non-production environments.
5 B2B Traffic Analysis Techniques in GA4
Once your setup is clean, these five analysis techniques turn raw traffic data into decisions that affect pipeline.
1. Build a Lead Source Funnel
Go to Explore → Funnel Exploration. Create a funnel with these steps:
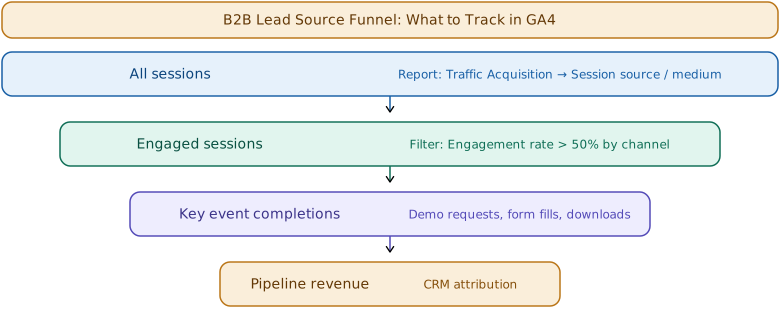
- Session start (all visitors)
- Key page view (pricing, demo, or product page)
- Form start (if you track this event)
- generate_lead (form submission)
Break down the funnel by “Session source / medium.” Now you can see not just which channels drive traffic, but which channels drive visitors who actually move through your conversion path. In our experience, organic search often brings 5x more sessions than LinkedIn, but LinkedIn visitors convert to leads at 3-4x the rate.
2. Create a Content Performance Exploration
Go to Explore → Free Form. Set the rows to “Page path,” columns to “Session default channel group,” and values to “Key events” and “Average engagement time per session.” This matrix shows you which content pieces perform best for each traffic source.
You’ll often discover that your top-traffic blog posts (attracting organic search) aren’t the same as your top-converting pages (where LinkedIn or email visitors convert). This tells you what to write more of for each channel.
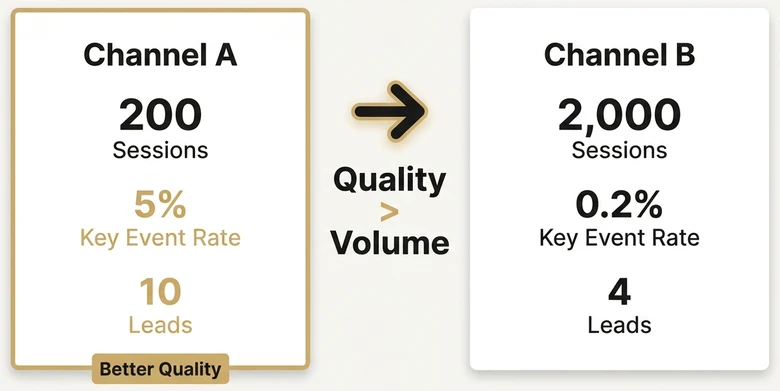
3. Compare Channel Quality, Not Just Volume
In the Traffic Acquisition report, don’t sort by sessions. Sort by “Key event rate” (the percentage of sessions that trigger a key event). A channel sending 200 sessions with a 5% key event rate produces 10 leads. A channel sending 2,000 sessions with a 0.2% rate produces only 4.
For B2B, the channels with the highest key event rates are typically:
- Email (returning, warmed-up prospects)
- Paid Search branded (people searching your company name)
- Referral from review sites (G2, Capterra visitors comparing solutions)
- Organic Search for bottom-of-funnel keywords
4. Track the Full B2B Buying Journey
B2B buyers don’t convert on their first visit. Use the User Acquisition report to see where they first discovered you, then use the Traffic Acquisition report to see what brought them back. GA4’s default attribution is data-driven, meaning it distributes credit across touchpoints. Seeing that whole sequence as one connected journey, rather than a set of separate sessions, is what customer journey analytics adds on top of GA4’s reports.
For a clearer picture, go to Advertising → Attribution → Model Comparison. Compare “Last click” with “Data-driven” attribution. If a channel looks weak in last-click but strong in data-driven, it’s an assist channel that introduces leads but doesn’t close them. Cutting its budget would shrink your top-of-funnel. GA4’s models stop at the web session, though, so when credit has to follow a deal across the CRM, the buying committee, and the offline close, that work moves to the dedicated attribution layer that picks up where GA4 stops.
5. Segment Traffic by Buyer Intent
Create audience segments in Admin → Audiences based on behavior signals:
- High intent: Visited pricing page + viewed 3 or more pages in one session
- Mid intent: Downloaded a resource or viewed a case study
- Low intent: Viewed only blog content, bounced within 30 seconds
Apply these segments in any report to filter traffic by quality. When your CEO asks “how’s website traffic?” you can answer with “high-intent traffic is up 22% month-over-month” instead of a meaningless total session count. This is how you connect marketing metrics to business outcomes.
Common GA4 Mistakes That Ruin B2B Traffic Data
Even experienced marketers make these errors. Each one quietly corrupts your data until you can’t trust the reports.
Ignoring “Not Set” and “Unassigned” Traffic
If you see “(not set)” in your source/medium reports, GA4 is receiving hits it can’t classify. Common causes: missing UTM parameters on ad campaigns, broken tracking code on certain pages, or cross-domain tracking issues. Don’t just ignore these rows. Each one represents budget you can’t attribute.
Counting All Traffic Equally
A session from a bot, a session from your own team, and a session from a qualified prospect all count as “1” in your traffic report. Without internal traffic filters, bot filtering (Admin → Data Streams → Configure Tag Settings), and lead scoring, you’re making decisions on inflated numbers.
Forgetting to Tag Email and Social Links
Every link in your email newsletters, LinkedIn posts, and social profiles needs UTM parameters. Without them, that traffic becomes “Direct” or “Referral” with no campaign context. One missing UTM tag on a high-performing email can hide hundreds of attributable sessions.
Using GA4 Data Without CRM Integration
GA4 tells you what happens on your website. Your CRM tells you what happens after the form submission. Without connecting the two, you know which channels drive leads but not which channels drive revenue. For B2B, this is the difference between optimizing for form fills (a vanity metric) and optimizing for closed-won deals. Closing that gap is the whole point of a content dashboard that joins traffic to revenue, where GA4 supplies the reach and engagement layers and the CRM supplies the money.
Tools like HubSpot’s marketing analytics, Salesforce campaigns, or dedicated attribution platforms like Dreamdata and HockeyStack bridge this gap. The integration method varies by CRM, but the principle is the same: pass the Google Analytics client ID into your form submissions so you can match web sessions to CRM contacts.
Not Tracking AI-Referred Traffic
Traffic from AI tools like ChatGPT, Perplexity, and Google’s AI Overviews is growing fast in B2B. GA4 classifies most of this as “Referral” from domains like chat.openai.com or perplexity.ai. Create a custom channel group to separate AI-referred traffic from general referrals so you can track its growth and quality independently.
GA4 Tools That Make B2B Traffic Analysis Easier
GA4 alone captures the data. These tools help you analyze it faster and connect it to pipeline. For paid campaigns specifically, GA4 stops at channel-level sessions, while the cross-account bid, budget, and spend detail lives in dedicated PPC reporting tools that read straight from the Google Ads and LinkedIn Ads APIs.
Google Tag Manager handles event tracking without touching your site’s code. Use it to fire custom events (like book_demo or pricing_view) based on button clicks, scroll depth, or time on page. For B2B sites with CRM forms embedded from HubSpot or Salesforce, GTM is the cleanest way to track form submissions as GA4 events.
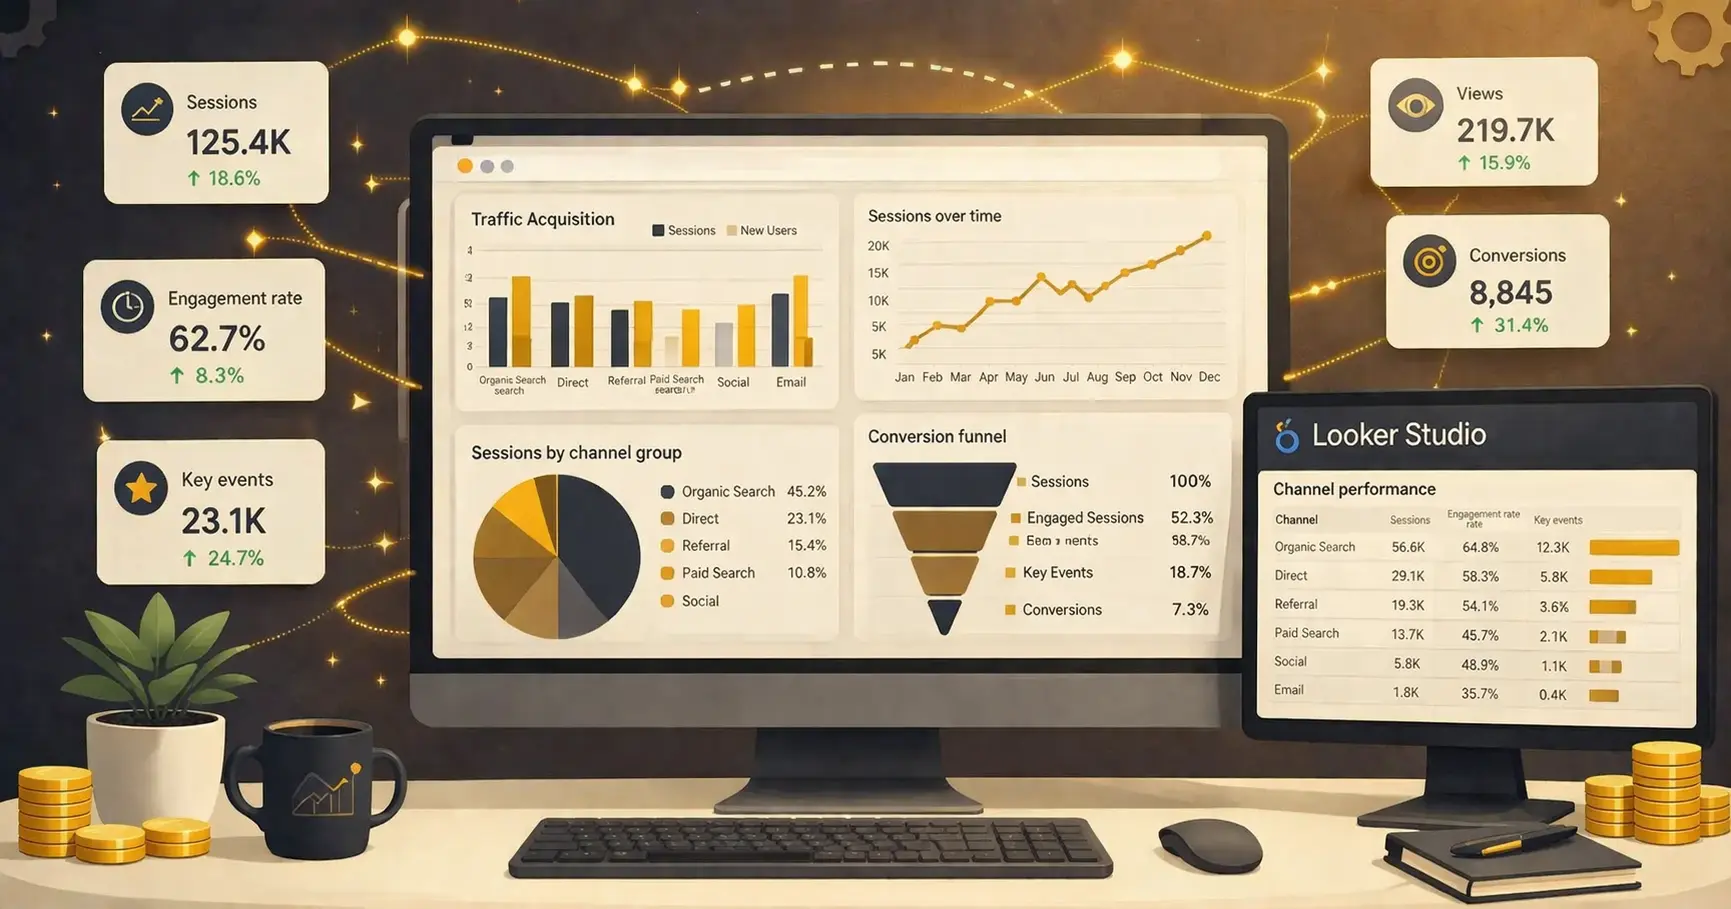
Looker Studio (formerly Data Studio) connects directly to GA4 and lets you build dashboards that auto-update. Build one dashboard for your weekly marketing standup with traffic by channel, key events by source, and month-over-month trends. Share the link with stakeholders so they stop asking “how’s the website doing?”
Semrush and similar tools complement GA4 by showing competitor traffic estimates, keyword rankings, and backlink data. GA4 shows what’s happening on your site. Semrush shows how you compare to the market. Together, they answer whether a traffic dip is your problem or an industry-wide trend.
How to Build a B2B Traffic Dashboard in Looker Studio
Default GA4 reports are fine for ad-hoc analysis, but B2B marketing teams need a live dashboard they can reference weekly. Looker Studio is free and connects natively to GA4.
Dashboard Layout
Keep it to one page with four sections:
- Traffic overview: Total sessions, users, and new users with month-over-month comparison. Add a time series chart showing daily sessions for the last 90 days
- Channel breakdown: A table showing sessions, engaged sessions, key events, and key event rate by session default channel group. Sort by key events, not sessions
- Top content: A table showing the top 10 landing pages by sessions with engagement rate and key event count. This tells you which content drives traffic and which content converts
- Conversion summary: A scorecard showing total key events broken down by event name (generate_lead, file_download, book_demo). Add week-over-week comparison
Who Gets the Dashboard
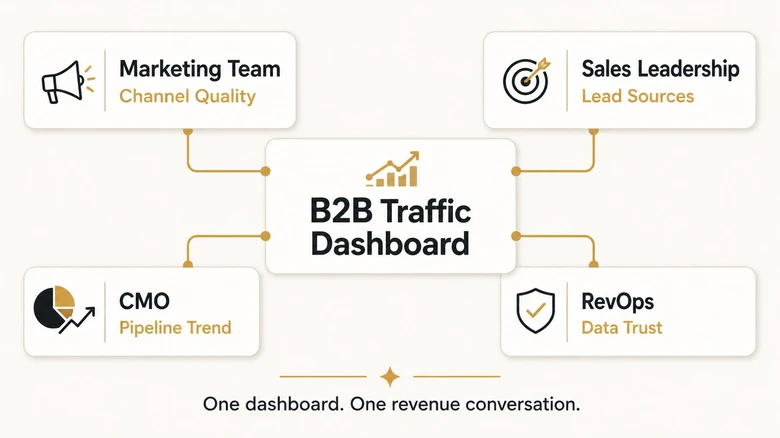
Share with view-only access to your marketing team, sales leadership, and your CMO. When everyone looks at the same numbers, pipeline meetings become about strategy instead of arguing over whose data is right. Sales teams particularly benefit from seeing which channels produce leads, because it changes how they prioritize follow-ups.
Connecting GA4 Traffic to B2B Pipeline
This is where most guides stop and where B2B analytics actually begins. Tracking traffic sources is step one. Connecting those sources to revenue is the goal.

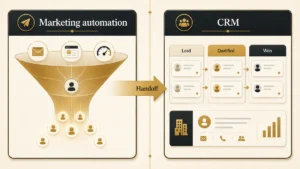
The GA4 → CRM Handoff
When a visitor submits a form on your site, capture the GA4 client ID (stored in the _ga cookie) as a hidden field. Pass it to your CRM alongside the lead’s contact information. Now you can match the CRM contact back to their full GA4 session history.
With HubSpot, this happens semi-automatically if you use HubSpot’s tracking code alongside GA4. With Salesforce, you’ll need a middleware tool or custom integration. The technical setup varies, but the outcome is the same: your CRM now shows which marketing channel sourced each deal.
From Traffic Report to Revenue Report
Once the integration is live, build a monthly report that answers:
- Which channels produced the most MQLs and SQLs this month?
- What’s the average deal size by originating channel?
- Which channel has the shortest time from first visit to closed deal?
- What’s the cost per SQL by channel (marketing spend ÷ SQLs)?
This is the report that earns marketing a seat at the revenue table. Traffic numbers alone don’t do that. Revenue attribution does.
Analytics consent by region: why your GA4 numbers differ abroad
Your GA4 traffic and conversion data is shaped by consent law, which varies by market. The same site can capture near-complete data in the US and materially less in Europe if consent is not handled correctly.
| Region | Consent requirement | Effect on your GA4 data |
|---|---|---|
| United States | No federal cookie-consent mandate (opt-out; state laws like CCPA/CPRA apply) | GA4 generally collects by default, so banner-driven data loss is small. |
| UK / EEA / Switzerland | Cookie consent (GDPR + ePrivacy/PECR) and Google Consent Mode v2, required for Google tags since March 2024 | Without consent, tags are throttled and data is modeled rather than measured. Sites that skip Consent Mode v2 lose roughly 15-40% of measurable conversions in these regions. |
| Canada / Australia | Consent expectations rising (PIPEDA; Privacy Act reforms) | A consent banner is increasingly expected; less severe than the EU today, but trending stricter. |
If a chunk of your unassigned or “(not set)” traffic is from Europe, a missing Consent Mode v2 setup is a likely cause. Last reviewed: June 2026.
Frequently Asked Questions
Consent law. In the UK, EEA, and Switzerland, GDPR and ePrivacy require cookie consent, and Google Consent Mode v2 has been mandatory for Google tags since March 2024. Without it, GA4 tags are throttled and the data is modeled rather than measured, and sites that skip it lose roughly 15-40% of measurable conversions in those regions. US traffic is largely unaffected because there is no federal cookie-consent mandate. If your European numbers look thin, check your consent banner and Consent Mode setup first.
Traffic in Google Analytics refers to the visits (sessions) your website receives. GA4 tracks where each session originates using source, medium, and channel dimensions. It records the visitor’s entry point, pages viewed, time spent, and actions taken. For B2B, traffic analysis focuses on identifying which sources drive qualified leads rather than just counting total visits.
Go to Reports → Acquisition → Traffic Acquisition. The default view shows traffic grouped by channel. Change the primary dimension to “Session source / medium” for more detail. You can add secondary dimensions like landing page or device category to further segment the data. Use the date range selector to compare periods.
Google isn’t eliminating Google Analytics. It replaced Universal Analytics (the older version) with Google Analytics 4 in July 2023. GA4 uses event-based tracking instead of session-based tracking, which provides more flexible measurement across websites and apps. GA4 is free and actively maintained by Google with regular feature updates.
Start by filtering out internal traffic, setting up key events for B2B conversions (form submissions, demo requests), and tagging all campaign links with UTM parameters. Then use the Traffic Acquisition report sorted by key event rate instead of sessions. Link Google Search Console for organic keyword data and connect your CRM to track which sources produce revenue.
Google Analytics traffic represents the total visits to your website, measured as sessions. Each session includes data about the visitor’s source, behavior, and conversions. GA4 categorizes traffic into channels like Organic Search, Paid Search, Direct, Referral, Email, and Social. The platform tracks both new and returning visitors separately through User Acquisition and Traffic Acquisition reports.
Yes, but GA4 defaults to ecommerce, so B2B teams must configure it. Filter internal and bot traffic, mark B2B key events like generate_lead and book_demo, tag campaigns with UTM parameters, and link Search Console plus your CRM. Then sort the Traffic Acquisition report by key event rate, not sessions, to connect channels to pipeline.