Ask a marketing team whether their tracking works and you will get a screenshot. A tag manager with a row of green ticks. A debug panel showing an event fired. A dashboard with a number in it. Every one of those is a real observation, and not one of them answers the question that was asked.
Tracking validation is the discipline that closes that gap, and most teams have never done it. They have done installation, which is a different job that finishes on a different day. Installation ends when the code is deployed. Validation begins when somebody asks what evidence exists that the data arrived somewhere a decision gets made.
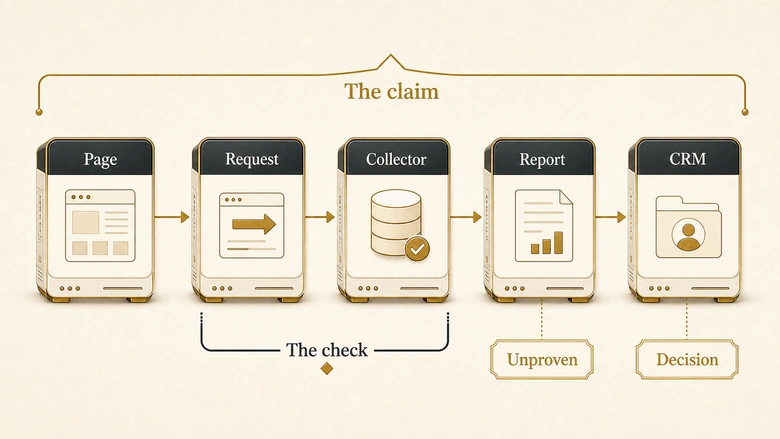
The distance between those two is where the money goes. A tag can fire perfectly into a void. A report can show a confident number that is half machine estimate. A form can pass an automated audit and still drop the campaign parameter. In each case the light is green and the failure is silent by design.
Direct answer — what is tracking validation?
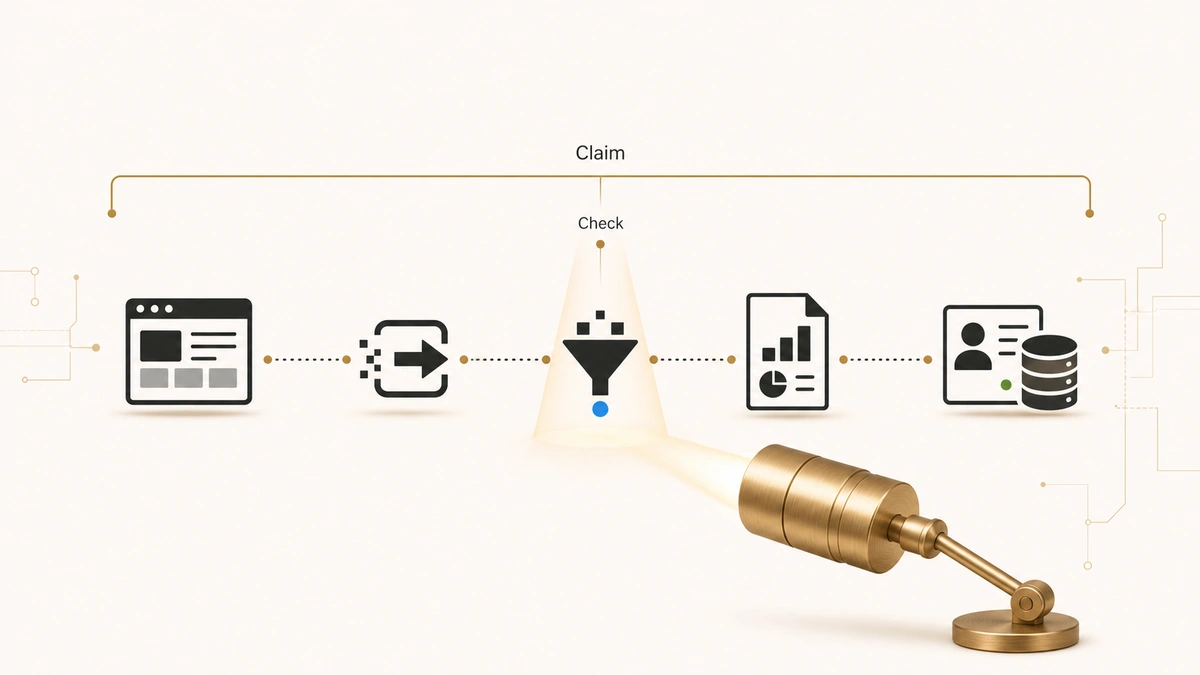
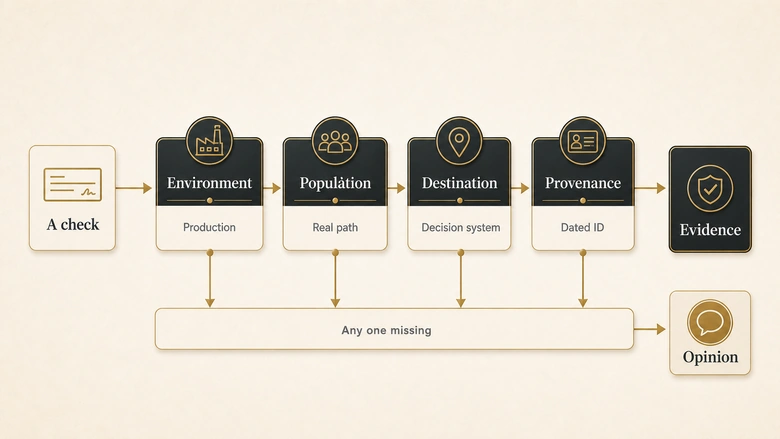
Tracking validation is the practice of proving that an analytics or campaign measurement actually collects, transmits and delivers the data it is meant to, rather than confirming that a tag was installed. It differs from implementation, which ends when code is deployed, and from monitoring, which watches a signal already trusted. A check counts as validation only when it runs in production, follows a real user path, ends at the system that makes the decision, and is recorded with a date and an identifier.
Key Takeaways
- A green light is a report about a check, never a report about the claim the check gets used to support. When the check is narrower than the claim, the gap is invisible, and that gap is the false green.
- Greens skew toward false positives because they are cheap to produce, and because they are produced in the least representative conditions available: an operator’s browser, in preview, with consent granted.
- Twelve signals commonly treated as proof are catalogued below with what each one actually establishes and the cheapest way to disprove it.
- IVRIS measured one of them. A static audit of live B2B forms detected 8 of 17 payload-confirmed campaign-data captures and missed 9, so a page-level reading of “this form captures campaign data” was right less than half the time.
- Four conditions decide whether a check is evidence: it ran in production, on a real user path, ending at the system that makes the decision, recorded with a date and an identifier. Fail any one and the result is an opinion.
What tracking validation is
Tracking validation is the work of proving that a measurement behaves as intended in production, from the user action through to the system that consumes the result. Implementation puts the mechanism in place. Validation establishes that the mechanism does what its owner claims.
The phrase is used for three unrelated things, and search engines currently mix all three, which is worth settling before going further.
| Term | What it means | Who searches it | Covered here |
|---|---|---|---|
| Tracking validation (marketing and analytics) | Proving that analytics tags, campaign parameters and data layers collect and deliver the data they are supposed to | Marketing ops, RevOps, analytics engineers | Yes, this page |
| Data validation | Checking values against rules for type, range, format and consistency, usually inside a database or a pipeline | Data engineers, analysts | Named, then handed off |
| Tracking number validation | Checking that a shipment identifier matches a carrier’s format before a lookup | Logistics and ecommerce operations | No |
The three overlap in vocabulary and share nothing operationally. Data validation asks whether a value is well formed. Tracking number validation asks whether a string matches a pattern. Tracking validation asks a harder question, because the thing being tested is a chain of independent systems, each of which can succeed on its own terms while the chain as a whole fails.
That distinction is why validation cannot be delegated to a tool that reads one link of the chain. A page scanner can tell you a tag is present. A network panel can tell you a request left the browser. Neither can tell you that the resulting row in the platform your team reports on carries the campaign it should. The measurement claim spans systems, so the evidence has to span them too, which is what separates validation from every check that comes before it and from the metrics reporting layer that sits on top and assumes it all worked.
The false green problem
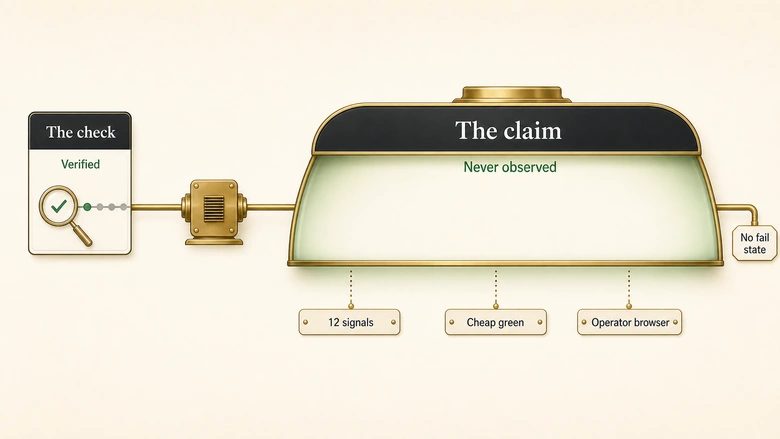
A false green is a signal that reports success for a check narrower than the claim it is used to support. The check is honest. The reading of it is not, because nobody wrote down what the check was actually scoped to observe.
“Tracking is installed” is the canonical example. The observation behind it is usually that a snippet appears in the page source or that a container has the tag in it. That observation is true. The claim it gets converted into, that campaign data will arrive in the system your team makes budget decisions from, is a claim about six or seven further steps that nobody looked at.
Three reasons greens skew positive
Three structural features push tracking checks toward false positives rather than false negatives, and they compound.
The first is cost asymmetry. A green is cheap to produce and expensive to disprove. Confirming a tag is present takes a keyboard shortcut. Confirming a lead’s source field survived the journey into the CRM takes a real submission, a wait, and a lookup. Under time pressure, teams buy the cheap signal and spend the saving elsewhere.
The second is environment bias. Almost every green is generated in the least representative conditions available: a logged-in operator, on a desktop, in a debug session, with consent granted and no ad blocker, following a path they constructed themselves. That environment is not a sample of your traffic. It is close to the opposite of it.
The third is the absence of a negative case. Well-designed tests can fail. Most tracking checks cannot, because they are inspections rather than tests: the tag is either there or it is not, and “there” is treated as the pass condition. A check with no failure mode beyond absence will never surface a value that arrived corrupted, arrived twice, or arrived at the wrong destination.
IMPORTANT
A false green is not a broken tool. Every signal in the register below reports its own check accurately. The failure happens in the sentence somebody writes afterwards, when a narrow observation gets restated as a wide guarantee.
Why “installed” became the standard of proof
Installation became the standard because it is the only part of measurement work that fits how the work is organised. It is a one-time, visible, assignable event with a completion state. Validation has none of those properties.
A tag deployment produces an artefact. Somebody can point at it, close a ticket, and move to the next item on a sprint board. Validation produces a dated observation with a shelf life, about a system that will be edited again next week by somebody who does not know the observation exists. One of those two fits a delivery process. The other looks like an open-ended commitment, so it does not get scheduled.
The result shows up in industry data. Supermetrics surveyed 435 marketing leaders and individual contributors across five markets for its 2026 Marketing Data Report and found 45 percent still struggling with measurement, with 36 percent naming the connection of marketing data as the thing most in need of improvement. Those are not implementation gaps. Almost every team in that sample has tags deployed. What they lack is any standing proof that the deployment produces trustworthy numbers.
There is also an incentive problem worth naming. Validation mostly produces bad news about work somebody has already been credited for. A person who verifies their own implementation and finds it broken has created a task, delayed a launch, and made a colleague look careless. A person who confirms the tag is present has finished. The organisation rewards the second behaviour and then wonders why attribution reports disagree with each other.
The False Green Register: 12 signals that are not evidence
The register below catalogues the green signals marketing and analytics teams most often mistake for proof. Each row states what the signal genuinely establishes, what it cannot establish, the cheapest way to disprove it, and the metric that goes wrong when the reading is wrong.
| The green signal | What it proves | What it does not prove | Cheapest disproof | Metric it corrupts |
|---|---|---|---|---|
| The tag is in the page source | The snippet was deployed to that template | That it executes, fires on the right trigger, or reaches a collector | Load the page with the network panel filtered to the collector domain and look for a request | Everything downstream |
| Tag manager preview shows the tag fired | The tag fires for your browser against the workspace you are editing | Production behaviour, because preview tests a configuration before it is published and the debug view is scoped to your own browser | Open the published site in a private window with no debug session and repeat the action | Event and conversion counts |
| The request returned HTTP 200 | The collector accepted the request | That the payload was complete, parsed correctly, or attributed to anything | Read the request payload field by field against what the report needs | Source, medium and campaign |
| DebugView or Realtime shows the event | A recent, debug-flagged hit was ingested | That it survives processing, thresholding and attribution into a standard report | Look for the same event in a standard report 24 to 48 hours later | Conversions, sessions |
| The report shows a number | The report has rows | That the rows are observed rather than estimated, because behavioural modelling fills in unconsented users | Check the property against Google’s published modelling eligibility thresholds | Users, sessions, conversions |
| The report shows zero | Nothing crossed a reporting threshold | That nothing happened, because rows are withheld under thresholds you cannot adjust | Widen the date range, drop the demographic dimension, or query the raw export | Any segmented report |
| The campaign row reads (other) | The dimension exceeded a row limit | That the campaign did not run, because high-cardinality dimensions collapse into a single bucket | Count distinct values of that dimension per day | Campaign attribution |
| A scanner says the form captures campaign data | A page-level pattern matched | That the value reaches the submission payload, a reading our own test found right less than half the time | Submit the form with a unique value and read the outbound payload | Source of every inbound lead |
| The integration status says “Connected” | An authentication handshake succeeded | That records are being written, because a connector can be authenticated and idle, or authenticated and failing per record | Compare record counts on both sides for one fixed window | Lead volume, speed to lead |
| The CRM record exists | A record was created | That the campaign fields on it are populated, or populated with the right value | Open the record and read the exact fields your report groups by | Channel and campaign reporting |
| “It worked when we tested it” | One path worked once, on one browser, in one consent state, on one date | That it works for the population, whose sessions include denied consent, blockers, in-app browsers and expired storage | Repeat on a consent-denied session and a mobile in-app browser | Everything |
| The conversion count went up | The number changed | That the change is real, because a duplicated tag raises the count and the confidence at the same time | Reconcile conversions against the system of record for the same window | Cost per acquisition, budget allocation |
How to use the register
Two rows in that table are deliberately shallow because they belong to other pages. Field-level capture failures inside a form platform are catalogued in the seven ways hidden fields lose campaign data, and the record-level question of a submission that never became a lead is worked through in the form-to-CRM reconciliation playbook. The register names them so the catalogue is complete, then hands off.
Used as intended, the register is a disproof list rather than a checklist. Take a claim somebody made about your tracking, find the row that matches the signal it rests on, and run the disproof in the fourth column. The point is not to score the setup. It is to find out how much of what you believe about your data has ever been tested.
The four conditions a check must meet to count as evidence
A tracking check is evidence when four conditions hold together. Any one of them missing turns the result into an informed opinion, which is a reasonable thing to hold and a poor thing to plan a budget on.
Environment: it ran in production
Debug tooling exists to make development possible, not to certify a deployment. Google’s own documentation is explicit that a tag manager preview session tests a container configuration before it is published, and that the debug interface appears only in the browser that enabled it. Both statements are in the preview and debug documentation, and together they describe an environment that is by definition not the one your customers are in.
The practical rule is that a green produced inside a debug session carries no weight until it is reproduced outside one, against the published configuration, in a browser with no privileged state. That single habit removes the most common false green in the register.
Population: it followed a real user path
The path an operator constructs to test a thing is rarely the path a customer takes to it. Operators arrive directly, on desktop, already consented, without a blocker, often already logged in, and usually to a page they typed rather than one they clicked through to from an ad with a query string attached.
Each of those differences maps to a known collection failure. Consent state changes what storage is available. Blockers remove the request entirely. In-app browsers on mobile behave differently from the same vendor’s standalone browser. Storage written by script is removed after a period without interaction, so a returning visitor is not the returning visitor your model assumes. A check that never leaves the operator path has tested a population of one.
Destination: it ended at the system that makes the decision
This is the condition most often skipped, because the analytics platform feels like the end of the chain and almost never is. If the budget conversation happens on CRM pipeline, then the analytics event is a waypoint and the CRM row is the destination. If a routing rule reads a source field, that field is the destination. A validation that stops one system short of where the decision is made has verified the easy part.
Naming the destination first also settles arguments about scope. There is no general answer to “is our tracking working.” There is a specific, testable answer to “does a paid social click that becomes a demo request arrive in the CRM with its campaign intact,” and that is the form a validation claim has to take. The same discipline drives the 14-rule UTM gate at the other end of the chain, where the parameters are constructed.
Provenance: it is dated and findable again
A validation result decays, because the systems underneath it are edited continuously. An undated result is therefore unusable within weeks, and an unattributed one cannot be re-run when somebody disputes it six months later.
Recording the date, the environment and a unique identifier for the test event costs one line and converts a memory into a record. The identifier matters most: it is what lets a colleague open the same row, in the same system, and see the same thing you saw, which is the difference between evidence and a strongly held recollection.
PRO TIP
Put a unique, searchable token in every test event, such as a company name of zzvalidation-2026-08-01. One string search then locates the same event in the browser payload, the analytics platform and the CRM, and it flags the record for deletion afterwards.
What the platform does to your numbers when you are not looking
Some false greens are not caused by a broken implementation at all. They are produced by the analytics platform behaving exactly as documented, in ways that change the number without changing anything visible in the interface.
| Behaviour | What the platform does | The documented threshold | What you see |
|---|---|---|---|
| Thresholding | Withholds rows so individual users cannot be identified | System defined, and stated to be not adjustable | A zero, or a row that is simply absent |
| Cardinality | Collapses excess rows into a single bucket | More than 500 unique values in one day is high cardinality, against a 50,000-value limit | An (other) row where your campaign should be |
| Behavioural modelling | Estimates the behaviour of users who declined consent | At least 1,000 events per day with analytics storage denied for 7 days, plus at least 1,000 daily consented users on 7 of the previous 28 days | A number that looks observed |
| Consent state | Fires the tag and withholds the storage | With ad storage denied, new advertising cookies are not set, though data is still sent | A firing tag with no user-level record |
Each of those is published by Google. Data thresholding is described as system defined, with the flat statement that you cannot adjust it. Cardinality is defined at more than 500 unique values in a single day. The eligibility criteria for behavioural modelling are stated as thresholds a property either meets or does not.
Read together they describe something uncomfortable. A GA4 report can show a confident zero for an event that happened, a confident (other) for a campaign that ran, and a confident user count partly composed of machine estimates, all at once, with no warning on the surface of the report beyond an icon most people never click. None of that is a defect. It is the documented behaviour of the system, and the false green is entirely in the reading. Anyone who has traced why GA4 traffic reports disagree with a CRM has met at least one of these four.
A green scanner with coin-flip sensitivity
The false green is measurable, and IVRIS measured one case of it directly. In June 2026 we audited 150 public B2B forms, then hand-validated a subsample by submitting each form and reading the outbound request payload rather than the page.
Against 20 forms with definitive payload results, the automated page-level audit detected 8 of 17 payload-confirmed campaign-data captures and missed 9. That is 47 percent sensitivity, with a 95 percent Wilson interval of 26 to 69 percent. Precision was clean at 8 of 8, so when the scanner said yes it was right, and when it said no it was wrong more often than a coin. Full method and the row-level dataset are published in the form attribution capture study.
The number to hold onto is not 47 percent. The interval is wide and the sample was deliberately selected, so treat it as evidence that page-level scanning is unreliable rather than as an industry rate. What matters is the shape of the error. The tool was not broken and never reported a capture that did not exist. It was answering a narrower question than the one being asked of it, which is the definition at the top of this page, observed in the wild with a confidence interval attached.
How to validate one tracking claim
Validation is done one claim at a time. The unit of work is a single sentence about a single measurement, proven end to end and written down, which takes under an hour of attention spread across two days of waiting.
Workflow · 2 days elapsed
How to validate one tracking claim
Produce a dated evidence record proving that one specific tracked event reaches the system that makes the decision, with an identifier anybody can look up again.
Write the claim as one sentence
Name the source, the action and the destination, as in “a LinkedIn click that submits the demo form arrives in Salesforce with its campaign field set.” Vague claims cannot be disproved, so they cannot be validated either.
Name the system that makes the decision
Identify where the number is read when budget or routing changes. That system is the endpoint of the test, not the analytics platform in the middle.
Generate one uniquely identifiable real event
Enter the site the way a customer does, with the live query string, in a private window with no debug session. Put a unique token in a free-text field so the event is searchable everywhere.
Read the outbound payload, not the tag status
Open the network panel and inspect the request body against the fields the destination needs. A fired tag with a missing parameter looks identical to a correct one in every status view.
Repeat on a denied-consent session
Run the same path again, declining consent, and record what changes. Configuration-dependent: what survives varies by consent implementation, so the result is a fact about your setup rather than a general one.
Look the token up after processing and record it
Wait 24 to 48 hours, search the destination system for the token, and write down the date, the environment, the identifier and what you found. Delete the test record afterwards.
Six steps produce one line in a register. That ratio is the honest cost of evidence, and it is why the next section matters more than this one.
What this costs, and what to do when you cannot afford it
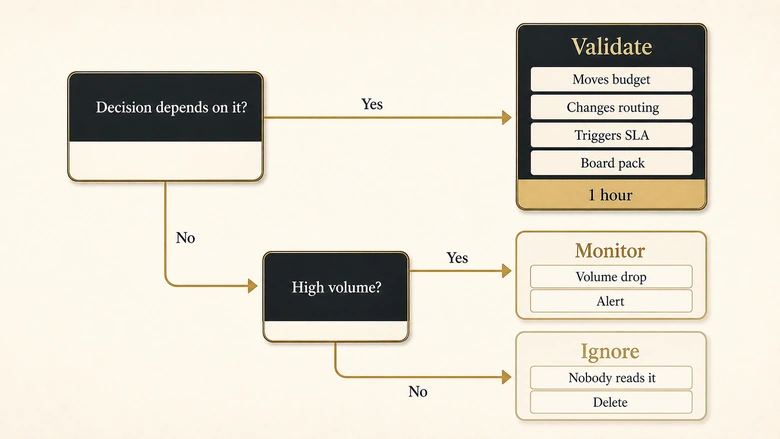
Validating everything is not a serious proposal. A mid-sized marketing operation runs dozens of events across several platforms, all of which change monthly, and an hour of proof per claim per quarter would consume a full role. The useful question is which claims earn that hour.
Validate, monitor, or ignore
Validate when a decision depends on it. If a number moves budget, changes routing, triggers an SLA or appears in a board pack, it earns a dated evidence record. The test is not how important the metric feels but whether being wrong about it would change an action somebody takes.
Monitor when the signal is high volume and the failure would be visible. Anything that produces a steady stream can be watched with an alert on a volume drop rather than proved by hand. Monitoring is cheaper and it catches breakage after the fact, which is the correct trade for signals where a day of loss is survivable.
Ignore when nothing reads it. Most tracking setups accumulate events nobody has queried in a year. Those do not need validating, monitoring or fixing. They need removing, because every one of them adds a row to the cardinality budget and a green light to a dashboard that is already too green to be informative.
The sequencing matters as much as the selection. Validation is cheapest before launch, when nothing has been spent and no records exist to clean up, which is why these checks belong inside a campaign launch gate rather than in a quarterly audit. It costs more but still repays itself inside a platform activation review, which the marketing automation QA checklist covers.
It is most expensive of all after the fact, once the evidence you need has been overwritten by the next campaign and the only remaining question is how far back the damage runs. What that damage does to a reported metric is worked through separately in silent form failures, where a capture problem shows up as a response-time problem and gets debugged in the wrong place for a quarter.
Download the False Green Register
The full twelve-row register is published above at no cost and needs no download. That is deliberate: an extractable table is what earns citations and inbound links, and putting it behind a form would forfeit the point of writing it.
The download is the working copy. A spreadsheet version carries the twelve rows pre-filled with four blank columns for your own environment, covering whether the row applies to you, when it was last disproved, the evidence identifier and the owner. A second tab holds a one-page evidence record whose required fields are the four conditions above. There is no score and no total, because a register that produces a single number would become the next false green.
Suggested citation: IVRIS Tech, The False Green Register (2026).
Frequently Asked Questions
In tracking work the four levels are the data layer, the tag or request leaving the browser, the platform that receives it, and the system that makes the decision. Most validation stops at level two. A claim is only proven when the evidence reaches level four, because that is where the number is read.
Type, range, format and consistency checks are the classic four, and they apply to values already inside a system. Tracking validation is a different job: it tests whether the value arrived at all, and whether it is the value the user’s session actually generated. A well-formed campaign name can still be the wrong one.
Generate one real event with a unique searchable token, outside any debug session, then find that token in the system where the decision gets made. Reading the outbound request payload beats reading a tag status, because a fired tag with a missing parameter looks identical to a correct one in every status view.
An example: click your own live LinkedIn ad in a private window, submit the demo form with the company name set to a unique token, then search Salesforce for that token two days later and read the campaign field. If it is populated correctly, one claim is validated. If the record is missing, the tag status was never the problem.
Validate on change rather than on a calendar. Any release that touches a form, a template, a consent banner, a tag container or a CRM field mapping invalidates prior evidence for the paths it touches. For paths that see no changes, a quarterly re-proof of the claims that move budget is a reasonable floor.
Methodology and sources
Platform behaviour described here was verified against primary documentation in August 2026. The thresholding, cardinality and behavioural modelling thresholds come from Google Analytics Help, and the statements about preview scope and unpublished configurations come from Google Tag Manager’s documentation. The survey figures come from Supermetrics’ 2026 Marketing Data Report, based on 435 marketing leaders and individual contributors across the United States, United Kingdom, Germany, Australia and Singapore. Platform thresholds change, so re-check the linked pages before relying on a specific number.
The form-capture figures are IVRIS’s own primary research, submitted on 17 June 2026 against a subsample of 20 forms with definitive payload results, drawn from a wider audit of 150 public B2B forms. The 47 percent sensitivity carries a 95 percent Wilson interval of 26 to 69 percent on a deliberately selected validation set, so it is evidence that page-level scanning is unreliable, not a measured industry rate.
The false green definition, the twelve-row register and the four evidence conditions are IVRIS constructions rather than published standards. We looked for a peer-reviewed or vendor-neutral measurement of how often marketing tracking is silently broken and did not find one with a stated error criterion and sample method, so no such figure is quoted here. The one number on this page that carries an interval is our own, and it covers a single failure mode rather than the category.