
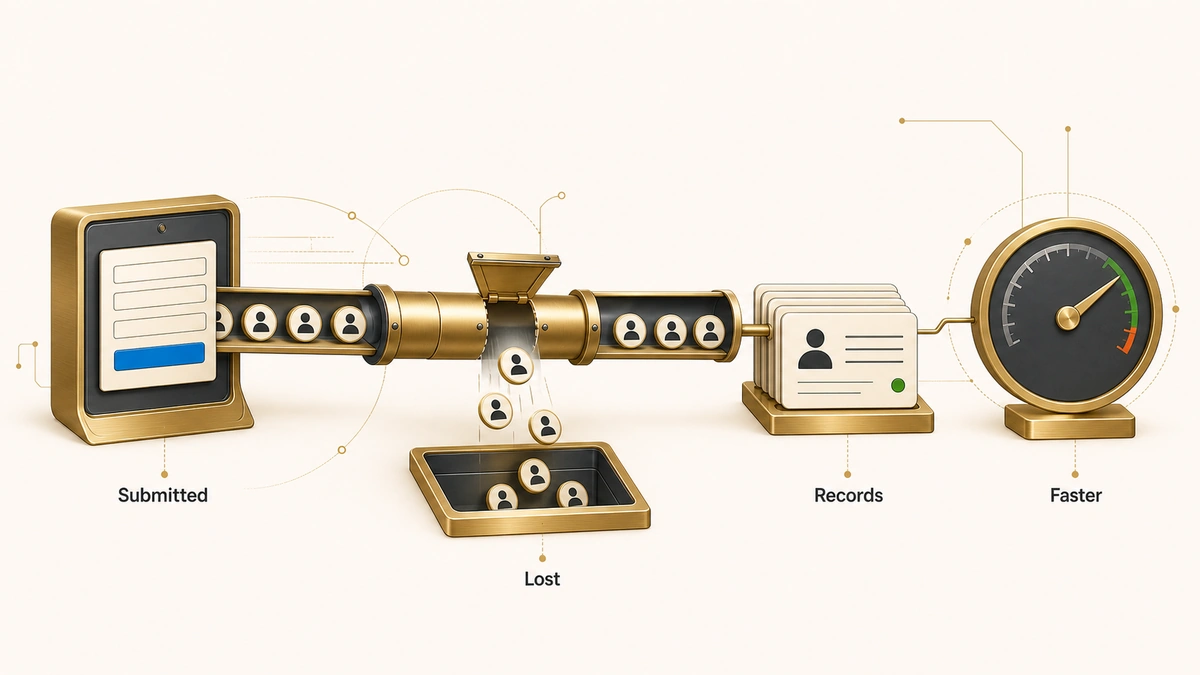
In 2014, InsideSales sent a test web lead to 14,061 companies. Before it could measure a single response time, it threw 4,523 of them out of the study. Some had no website. Most had no form. And 183 of them had a form that looked fine and did not work.
That last group is the interesting one, because those 183 companies were removed from the sample for the crime of having the exact problem the study was built to expose. The famous number that came out of that research, that 47 percent of companies never responded to an inbound lead, was calculated on the 9,538 survivors whose forms had been confirmed to work.
Your speed-to-lead dashboard does the same thing every week, and unlike the researchers, it does not tell you it is doing it. A lead that never arrives is not a slow lead. It is not in the report at all.
Direct answer — how do silent form failures distort speed-to-lead reporting?
A silent form failure is a submission that returns a success message to the visitor but never creates a record in the CRM. Because response-time metrics are calculated only on records that exist, the lost submissions never enter the sample. Reported speed to lead therefore improves as capture degrades. The metric moves opposite to the failure it should expose, which is why a rising SLA attainment figure can accompany falling pipeline.
Key Takeaways
- Capture loss does not add noise to speed-to-lead reporting. It biases it in one direction: better. Every lost submission is a lead you cannot be measured against.
- SLA attainment is always inflated by capture loss, and the correction is exact: true attainment equals reported attainment multiplied by your capture rate.
- Average and median response times are only distorted if the losses are non-random. They usually are, because failures cluster by consent state, browser, device and form variant rather than scattering evenly.
- A form that breaks completely produces zero rows, and alerting built on rate-of-change over existing rows cannot see a stream that stopped. Zero is the one number a working form never produces.
- Nearly every published response-time benchmark reports its average among responders only, so the industry figures you compare yourself against carry the same bias as your own dashboard.
What silent form failures are
A silent form failure is a form submission that reports success to the visitor and never produces the record it was supposed to produce. The defining property is not that something broke. It is that nothing complained. Both sides walk away with a false belief: the visitor believes the message was sent, and the business believes no message arrived.
Software testing has a precise name for this shape of defect. Ministry of Testing defines a silent failure as a situation where a system fails to behave as expected but surfaces no visible error, alert or warning, and notes that the danger is false confidence, because tests pass and dashboards look healthy while the problem runs underneath. Marketing operations inherited the failure mode without inheriting the vocabulary.
How a submission goes missing
The mechanisms are well understood and mostly boring. Notification email is generated but rejected downstream on SPF, DKIM or DMARC alignment and never reaches the inbox it was addressed to. A JavaScript error interrupts the submit handler after the success state has already rendered. An AJAX request resolves without checking the server response code, so a 500 displays as a thank-you. A webhook or API endpoint rejects the payload for a validation reason nobody reads. A consent banner blocks the script that populates the tracking fields, and the record is created without the campaign data that would have routed it. Spam filtering quarantines a real submission into a folder nobody opens.
Not all of these lose the record. Some lose only part of it, which is the harder case to detect and the one that does the most damage downstream, because a record that arrives without its campaign fields looks complete on the screen. Hidden fields are the canonical example: a field can exist in the form builder, map correctly to a CRM property, and still arrive empty on every submission because of where it sits in the page lifecycle. The ways hidden fields lose campaign data are invisible from the configuration screen and obvious in the payload, which is a summary of the whole problem class.
What unites them is the absence of a signal. A server error page generates a support ticket. A silent failure generates a slightly quieter Tuesday.
Why a broken form makes speed to lead look better
Speed-to-lead reporting is calculated on the records that exist in the CRM, which means a submission that never became a record cannot be slow, cannot breach an SLA, and cannot appear in an average. It is not counted as a failure. It is not counted at all.
This is survivorship bias, and it is worth being precise about why it bites here rather than waving at the aircraft-armour story. The response-time sample is not drawn from inquiries. It is drawn from inquiries that successfully became records, and the filter that decides membership is the same system whose reliability is in question. Any leads the capture layer drops are removed from the denominator before the metric is computed.
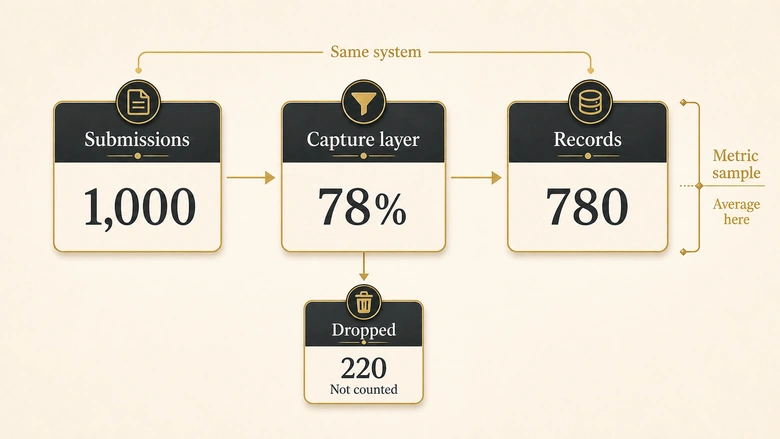
The consequence is counterintuitive enough that most teams get it backwards. Degrading capture does not make the speed-to-lead number worse. It makes the number better, or at minimum leaves it unchanged while the business underneath it gets worse. Nobody investigates a metric that is improving, which is how a capture defect survives a quarterly review that was specifically designed to catch problems.
The published benchmarks carry the same bias
The published research has the same structure, and once you look for it the pattern is everywhere. Harvard Business Review’s 2011 study of online sales leads took its average only among companies that replied within thirty days, excluding entirely the share that never replied. RevenueHero’s 2024 audit requested demos on 1,000 B2B websites and received 365 responses, reporting a mean of one day, five hours and seventeen minutes across those 365. The other 635 are not in the mean. The scoping problems in the speed-to-lead evidence base go further than this one issue, but this is the one that matters for your own reporting, because you reproduce it locally every time you compute an average over CRM records.
Almost every response-time benchmark in circulation is an average among responders. So is yours.
None of this makes speed to lead a bad metric. It makes it a metric with a denominator that has to be defended rather than assumed, which is the part the guide to faster lead response flags and this page takes apart.
Four ways a silent failure distorts the metric
Capture loss reaches the report through four distinct routes, and separating them matters because they do not all bias the same things or respond to the same fix.
| Distortion | What it does | Which metric it hits | Direction of the error |
|---|---|---|---|
| Survivorship | Lost submissions never enter the response-time sample at all | SLA attainment, percentage answered within target | Reported performance improves |
| Clock-start displacement | The timer starts at record creation rather than at submission, so transit delay is invisible | Mean and median response time | Reported performance improves |
| Composition shift | Failures cluster by segment, so the surviving sample is not representative | Channel, campaign and segment comparisons | Systematically biased, direction varies |
| Zero-record blindness | A dead form emits no rows, so alerting that watches rows cannot fire | Every metric downstream | No signal at all |
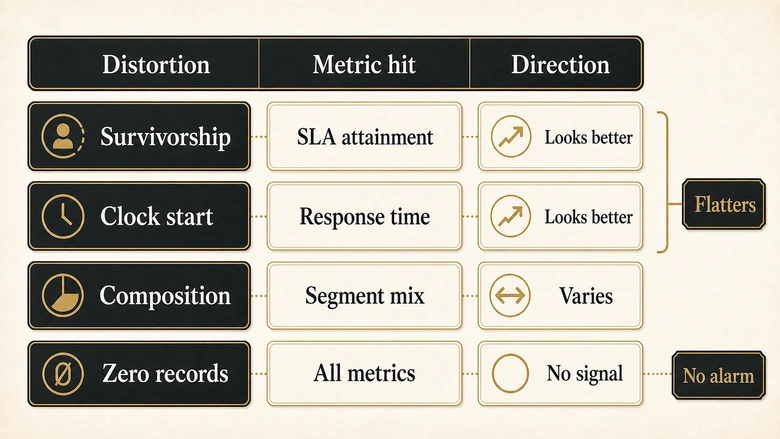
The first two both flatter the report, which is why they are rarely questioned. The third corrupts the comparisons you use to allocate budget. The fourth removes the alarm you were relying on to catch the other three.
Where the response clock actually starts
A response-time measurement is a difference between two timestamps, and the one that causes the most trouble is the start. Most CRM reporting starts the clock at record creation, because that is the first timestamp the CRM owns. The visitor started their clock when they pressed submit.
Everything between those two events is invisible to the report. A form that posts to a middleware queue, retries twice, and writes the record eleven minutes later has consumed eleven minutes of the buyer’s patience and none of the sales team’s measured response time. A nightly batch sync can consume a working day the same way. Neither shows up as slowness. Both show up as a record that was created and then answered promptly.
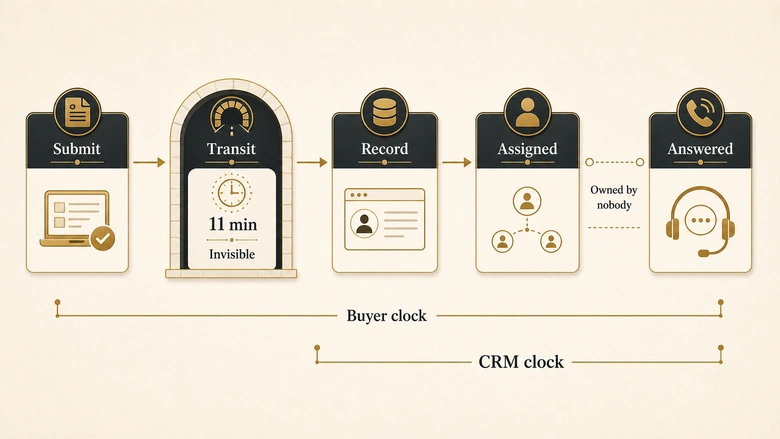
Four timestamps are worth keeping separately, and collapsing them is what produces a number nobody can act on: submission, record creation, assignment to a named owner, and first response attempt. Measuring submission to first response gives you the buyer’s experience. Measuring creation to first response gives you the sales team’s performance. Both are legitimate, and reporting one while calling it the other is where the argument in most pipeline reviews actually comes from. Assignment deserves its own timestamp because a record that exists and belongs to nobody is a slower version of a lost one, which is the mechanic underneath capture through to accepted ownership.
IMPORTANT
If your response-time metric starts at CRM record creation, it structurally cannot detect a capture problem. The measurement begins after the step that fails, so every failure of that step is either invisible or, worse, appears as an improvement.
What gets lost is not a random sample
Whether capture loss distorts your average response time, as opposed to your attainment percentage, depends entirely on whether the losses are random. This is the point where a lazy version of this argument becomes wrong, so it is worth stating carefully.
If broken submissions were scattered evenly across all traffic, the surviving sample would still be representative and the median response time would be unbiased. You would have fewer leads and the same average. Attainment would still be overstated, because that is arithmetic rather than sampling, but the timing figures would survive.
Why capture failures cluster
Losses are rarely scattered evenly. They cluster, because the causes cluster. A consent banner that blocks a tracking script fails for the visitors who decline consent, which skews by region and by regulatory regime. A JavaScript conflict fails on the browser or extension combination that triggers it. A form variant with an extra required field fails only on the campaign using that variant. A mobile layout that hides the submit button below an overlay fails only on the devices affected. Each of these removes a specific, identifiable slice of the audience.
That is what turns a capture problem into a reporting problem with consequences. If the campaign whose UTM values break is also the campaign feeding your fastest-responding segment, its removal drags the surviving average in a direction that has nothing to do with how anyone performed. Channel comparisons built on that sample are comparing capture reliability as much as demand quality, which quietly misallocates budget. Link hygiene is the cheapest place to intervene, and the pre-launch rules for UTM links exist because this class of defect is introduced at launch and is trivially catchable beforehand.
The opposite problem: automated submissions
There is a second population problem running the other way. Automated traffic adds rows rather than removing them. Imperva’s 2025 Bad Bot Report found that automated traffic passed human activity for the first time in a decade, at 51 percent of all web traffic, with bad bots at 37 percent. Spam submissions that reach the CRM inflate the denominator with records nobody will ever work, which pushes attainment down; the ones that get quarantined vanish from the count entirely, which pushes it back up. Both effects are real and they do not cancel out reliably, so bot rows have to be excluded from the counting explicitly rather than left to net themselves out.
The number that never alarms
The most severe capture failure produces the least alarming report, because a form that fails completely writes nothing at all. Zero records means zero rows, and a dashboard built on aggregations over rows renders an empty chart rather than an alert.
Most monitoring in marketing operations watches rates rather than absences. Conversion rate, response time, attainment percentage: all of them are computed from records that exist, and all of them are undefined or simply blank when the stream stops. An anomaly detector trained on the variance of a metric cannot fire on the disappearance of its input. This is why a broken form is routinely discovered by a salesperson wondering why the week has been quiet, rather than by the reporting layer built to catch exactly this.
The fix is to alert on absence directly, and it is unglamorous. Alarm on an absolute zero at the capture step over any window longer than your quietest normal gap, because zero is the one value a working form never produces. Run a scheduled synthetic submission through the real production form and alert if the sentinel record does not appear within a set window, which converts a silent failure into a loud one without waiting for a human to notice. Then hold per-form and per-campaign baselines rather than one site-wide total, since a single dead form inside a healthy site is invisible in an aggregate. Finding the leads that fell out this way after the fact is a reconciliation exercise, and auditing for lost, late and misrouted leads covers the retrospective version of the same hunt.
The correction: measure against submissions, not records
The correction is a change of denominator. Reported SLA attainment divides the leads you answered in time by the leads the CRM created. True attainment divides the same numerator by the submissions that were actually attempted.
True SLA attainment = Reported SLA attainment × capture rateWhere capture rate is CRM records created ÷ form submissions attempted. The relationship is an identity rather than an estimate: answered ÷ submissions equals (answered ÷ records) × (records ÷ submissions), so the reported figure and the capture rate are all you need. Nothing is modelled and there is no error term.
The consequence lands hardest over time, because reported attainment and true attainment can move in opposite directions. The table below holds submissions constant at 1,000 per quarter and lets capture degrade while the team genuinely gets faster at working the records it receives.
| Quarter | Submissions | Records created | Capture rate | Answered in SLA | Reported attainment | True attainment |
|---|---|---|---|---|---|---|
| Q1 | 1,000 | 960 | 96% | 634 | 66% | 63% |
| Q2 | 1,000 | 910 | 91% | 637 | 70% | 64% |
| Q3 | 1,000 | 850 | 85% | 621 | 73% | 62% |
| Q4 | 1,000 | 780 | 78% | 593 | 76% | 59% |
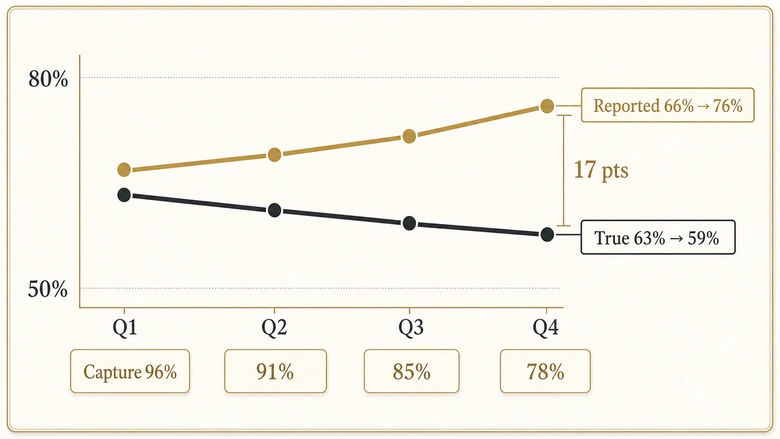
Reported attainment climbs ten points across the year. True attainment falls four. Every quarterly review sees improvement, every quarterly review is looking at a real number, and the business is answering fewer of its buyers each quarter than it did the quarter before. This is a modelled illustration rather than observed data, but the arithmetic is not negotiable: whenever capture degrades faster than response performance improves, the reported figure rises while the real one falls.
What the correction assumes
Five conditions have to hold before the correction means anything, and each one is a way to get it wrong:
- Count submissions independently of the CRM. Use form endpoint logs, server access logs or a tag-manager event. Counting submissions with the system whose reliability you are testing is circular.
- Separate suppressed from lost. Deduplication and known-contact suppression mean records are legitimately fewer than submissions in HubSpot and Salesforce. Net those out first, or working capture will look broken.
- Exclude bots and duplicates from both counts consistently. Filtering spam out of records but not out of submissions understates capture and overstates the problem.
- Treat true attainment as a lower bound. Some lost leads recover themselves by calling, emailing or resubmitting, so the real figure sits somewhere between the reported and the corrected one.
- Use one window and one cohort for all three counts. Submissions near a period boundary otherwise create gaps that look like capture loss.
The same denominator discipline applies further down the funnel, where lead-to-meeting conversion benchmarks are only comparable when both sides agree on what the base population was.
How to measure capture-adjusted speed to lead
The measurement is a counting exercise, and it takes an afternoon rather than a project. Each step produces the number the next step needs.
Workflow · 2 hours
How to calculate capture-adjusted speed to lead
A reconciliation that converts a CRM-only response-time report into a figure measured against the submissions that were actually attempted, and returns the size of the gap between them.
Fix the window and the form set
Pick one closed period and list every form in scope by URL. Use a period that ended at least a week ago so late-arriving records have settled.
Count submissions outside the CRM
Pull the count of successful POSTs from form endpoint or server logs, or from a tag-manager submit event. Record the source you used and its known blind spots.
Count records and net out suppressions
Count CRM records created from those forms in the same window, then subtract deduplicated and deliberately suppressed submissions from the submission count so the gap reflects loss rather than design.
Compute the capture rate
Divide adjusted records by adjusted submissions. Do this per form and per campaign as well as in total, because a single failing form disappears inside a site-wide average.
Multiply your reported attainment by the capture rate
Take the SLA attainment your dashboard reports for the window and multiply it by the capture rate. Report both figures side by side and label which denominator each one uses.
Re-run the capture rate by segment
Split capture by device, browser, consent state and campaign. Any segment that deviates from the total identifies a clustered failure and tells you the timing figures are biased, not just the attainment figure.
Run it once and you have a baseline. Run it quarterly and the capture rate becomes a tracked metric in its own right, which is the point: the number you most need to watch is the one your reporting currently assumes is 100 percent. If you want a faster first read on the form layer before committing to the full count, IVRIS runs a free Web Form Audit against a landing-page URL. It reads the rendered page rather than the payload, so treat it as a way to narrow where to look rather than as a substitute for counting.
Download the speed-to-lead distortion worksheet
The formula and the model table above are the whole method, so nothing here is held back. The worksheet exists because the correction is easier to defend in a pipeline review when the counts, the suppression adjustments and the per-segment split are laid out in one place with the arithmetic visible.
It takes submissions, records, suppressions and answered-in-SLA counts per form and per segment, and returns the capture rate, reported attainment, true attainment and the gap between them, with the per-segment deviation flagged so clustered failures surface on their own.
Cite it as: IVRIS Tech, Speed-to-Lead Distortion Model (2026).
Frequently Asked Questions
The submission was accepted by the browser but lost before the record was written. Common causes are a rejected webhook payload, a JavaScript error after the success message rendered, notification email failing SPF or DMARC alignment, consent scripts blocking field population, or deliberate deduplication suppressing a known contact.
Count submissions outside the CRM, using form endpoint logs or a tag-manager event, then compare that count with records created in the same window. A gap that survives netting out deduplication is capture loss. A scheduled synthetic submission that fails to appear confirms it in real time.
In most reporting it does not, and that is the problem. A lost submission never becomes a record, so it is excluded from the denominator rather than counted as a breach. Measuring attainment against submissions instead of records puts it back where it belongs.
Degrading capture removes leads from the response-time sample, so the average improves while fewer buyers are actually answered. Check the capture rate for the same period. If it fell while reported attainment rose, the improvement is a sampling artefact rather than a performance gain.
Start the clock at submission rather than record creation, keep submission, creation, assignment and first response as four separate timestamps, and calculate attainment against submissions counted outside the CRM. Report the capture rate alongside the response time so the denominator is visible.
Methodology and sources
The 2014 figures come from the InsideSales Lead Response Report, which sent a test web lead to 14,061 companies and disqualified 4,523 before analysis: 309 with no working website, 4,031 with no web form, and 183 whose web form did not function properly. The 47 percent non-response figure is 4,472 of the remaining 9,538. The report is available as a PDF from InsideSales. The 183 broken forms should be read as a floor rather than a rate: they were identified by an external page-level check, and IVRIS’s own testing of live B2B forms in June 2026 found that a read-only page scan detected 8 of 17 payload-confirmed captures, giving it 47 percent sensitivity across 20 definitive cases with a 95 percent Wilson interval of 26 to 69 percent. A method that misses more than half of real failures produces a count that is too low, not too high.
The RevenueHero figures are from its 2024 audit of 1,000 B2B websites, reporting 365 responses at a mean of one day, five hours and seventeen minutes, with 60.27 percent of those responses automated. The Harvard Business Review 2011 study is cited here only for the structure of its sample, an average taken among companies that replied within thirty days, and not for a specific duration. Bot traffic figures are from Imperva’s 2025 Bad Bot Report; a 2026 edition has since been published, so re-check the share before quoting it as current. Response-time benchmarks are deliberately not compiled here, because comparing figures across studies with different clocks and different outcome definitions is its own problem, handled separately in the speed-to-lead evidence audit. Definitional framing for silent failure follows the software-testing usage documented by Ministry of Testing.
The four-distortion taxonomy, the capture-adjusted attainment correction and the worked model table are IVRIS constructions rather than published standards. The correction is an algebraic identity and holds unconditionally for coverage metrics such as SLA attainment. It does not by itself establish that mean or median response times are biased: that conclusion requires the losses to be non-random, which the composition-shift section argues is usual but does not prove for any specific case. The quarterly table is an illustration built on fixed assumptions, not observed data from any company. We looked for a published industry-wide measurement of form capture rates in B2B and found only vendor self-reports with no stated detection method or sample, so no such figure is quoted here.





