
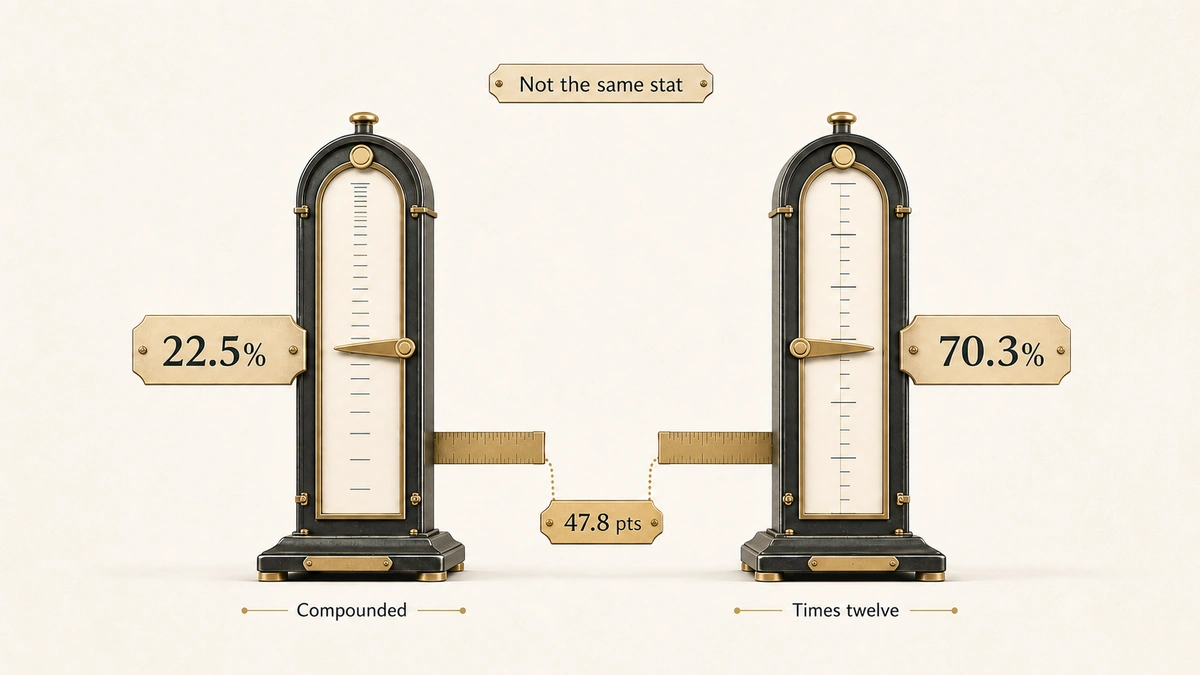
The published range for CRM data decay runs from 22.5% a year to 70.3% a year. That is a spread of nearly 48 percentage points on what is supposed to be the same measurement. A range that wide is not a sign of an unsettled research field. It is a sign that four different things are being counted and quoted as one number.
IVRIS tried to trace every headline decay figure in circulation back to the document that first published it, recorded what each one actually measured, and recomputed the annual rates on a single consistent basis. Several could not be traced to an original at all, and those are marked as such rather than repaired. The result is below: a reconciliation table, the provenance chain for each figure, and the arithmetic that explains roughly two fifths of the spread before you even reach the question of what decayed.
This page is evidence only. If you want the remediation side, our guide to CRM data cleansing services covers scope, pricing and vendor selection, and lead deduplication covers matching rules and merge governance.
Direct answer — What is the real CRM data decay rate?
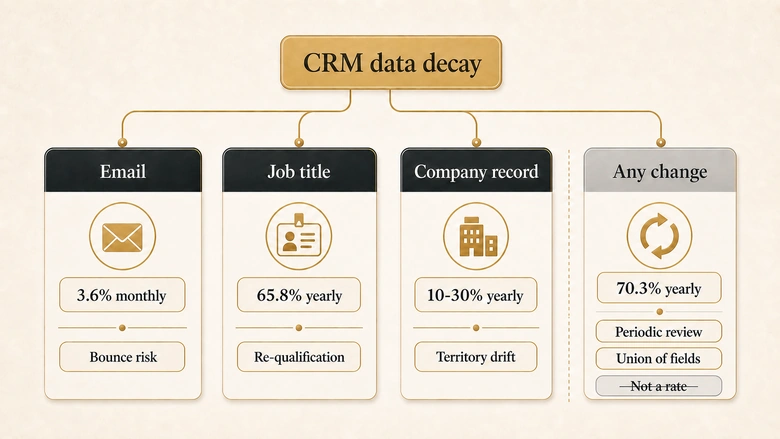
There is no single CRM data decay rate. Published figures from 22.5% to 70.3% a year measure four different things: email deliverability, job title changes, whole-record accuracy, and the share of records with any change at all. They also annualise monthly rates by two incompatible methods. Quote each figure with what it measured, its sample and its year attached, and never average them.
Key Takeaways
- The 22.5% figure and the “2.1% per month” figure are the same claim counted twice. Pages citing both as corroborating sources are double-counting one study.
- The 70.3% figure is not a decay rate. It is the share of business cards reporting at least one changed field in 12 months, from a self-reported survey of over 1,200 cards run in 2002 and updated in 2009.
- 22.5% is compounded from a monthly rate. 70.3% is the same kind of monthly rate multiplied by 12. Put both on a compounding basis and the range narrows from 47.8 points to 29.1 points.
- Roughly 39% of the headline spread is annualisation arithmetic, not any difference in how fast data actually goes stale.
- Two vendor pages take the identical input of 3.6% a month and publish 35.6% and 43% for the same year, a 7.6-point gap created entirely by choice of formula.
- Job-title and phone figures presented as 2026 vendor research trace to the same 2002 business-card survey, divided by 12 to manufacture a monthly rate.
The decay statistics in circulation, with their scope attached
CRM data decay is the loss of accuracy in stored contact and account records as people change jobs, companies restructure, and systems drift out of sync with reality. The disagreement is not about whether it happens. It is about what gets counted.
Nine figures do most of the work across the pages ranking for this topic. Every one of them is quoted somewhere as “the” decay rate:
- 2.1% per month, attributed to MarketingSherpa, for unspecified B2B contact data.
- 22.5% per year, the same MarketingSherpa figure annualised, popularised by HubSpot’s Database Decay Simulation.
- 22.5% per year, attributed instead to a Dun & Bradstreet benchmark by at least one vendor, for the same metric.
- 30% or more per year, presented as a “commonly cited industry figure” with no publisher named.
- 30% to 40% per year, widely attributed to Dun & Bradstreet.
- 3.6% per month for email addresses, annualised as both 35% and 43% by different publishers.
- 65.8% per year for job titles and 42.9% for phone numbers.
- 70.3% per year for B2B data overall, frequently credited to Dun & Bradstreet or Gartner.
- 70.8% of contacts experiencing at least one change in 12 months.
Read as a list, that looks like a field with noisy measurement. Read with the definitions attached, it is four distinct objects and two incompatible formulas.
Four different things are all called CRM data decay
Data decay claims measure one of four objects, and the objects are not interchangeable. A record can have a dead email address and a perfectly current job title, or a current email and an employer that no longer exists. Counting either as “decayed” is defensible. Counting them as the same measurement is not.
| What is being counted | What it actually measures | Typical published figure | Use it when | Do not use it for |
|---|---|---|---|---|
| Email deliverability decay | Share of addresses that stop accepting mail | 3.5% to 3.6% per month | Sizing list hygiene and bounce risk | Estimating how much of the CRM is wrong |
| Job title and role decay | Share of contacts whose title or function changed | 25% to 65.8% per year | Sizing re-qualification and routing risk | Estimating deliverability |
| Company record decay | Share of firmographic and technographic fields that changed | 10% to 30% per year | Sizing segmentation and territory drift | Contact-level outreach planning |
| Any-change incidence | Share of records with at least one changed field | 70.3% to 70.8% per year | Arguing that records need periodic review | Any rate calculation, because it is a union across fields |
The fourth row is where most of the confusion originates. Any-change incidence is a union across every field on the record, so it rises as you add fields to the definition. A ten-field record will always show a higher any-change percentage than a three-field record, holding the underlying churn constant. That number can climb toward 100% without a single email address going dead.
IMPORTANT
A union across fields is not a rate. “70% of records changed in some way” and “70% of your database is unusable” are different claims, and only the first one has evidence behind it.
The decay-rate reconciliation table
Below is every circulating figure with what it measured, how it was annualised, its sample and population, its original publisher and year, whether the publisher sells a remediation product, and a verdict on whether the claim can be traced to an original document. Every source was retrieved and read on 1 August 2026.
| Figure as quoted | What actually decayed | Window and annualisation method | Sample and population | Publisher and year | Sells remediation | Provenance verdict |
|---|---|---|---|---|---|---|
| 2.1% per month | “B2B contact data”, fields unspecified | Monthly, as measured | Not published | MarketingSherpa, B2B Marketing Benchmark Report, 2012 | No | Report named; sample size and measurement method not published in any source we could retrieve |
| 22.5% per year | Same as above | 2.1% monthly compounded over 12 months, which returns 22.48% | Same as above | HubSpot, Database Decay Simulation, undated | Yes | Not an independent data point. It is the 2012 monthly figure restated |
| 22.5% per year | “B2B data” | Annual, method not stated | Not published | Cleanlist, 2026, attributing to a Dun & Bradstreet B2B Data Benchmark | Yes | Contested attribution. The identical number is credited to MarketingSherpa by HubSpot and to Dun & Bradstreet here |
| 30%+ per year | “B2B and CRM data” | Annual | None given | RevenueBase, June 2026, described as a “commonly cited industry figure” | Yes | No publisher named. Not traceable |
| 30% to 40% per year | B2B data | Annual | Not published | Attributed to Dun & Bradstreet across many pages | Yes | Could not verify against any Dun & Bradstreet primary document |
| 3.6% per month, email | Email addresses | Monthly, but back-derived by dividing an annual figure by 12 | Inherited, not measured | Landbase, SMARTe and Saleshandy, 2026 | Yes | Derived, not observed. Close to 42.9 divided by 12 |
| “35%+ per year”, email | Email addresses | 3.6% monthly compounded, which returns 35.6% | Inherited | Landbase, April 2026 | Yes | Arithmetic is internally consistent |
| “~43% per year”, email | Email addresses | 3.6% monthly multiplied by 12, which returns 43.2% | Inherited | ZoomInfo, June 2026 | Yes | Same input as the row above, different formula, 7.6-point difference |
| 65.8% per year, job titles | Job title or function | Annual, as surveyed | Over 1,200 self-reported business cards | John Coe, study 2002, updated 2009, published on Biznology 2015 | No | Traceable, but re-presented as 2026 vendor research by later pages |
| 42.9% per year, phone | Phone numbers | Annual, as surveyed | Same business-card sample | Same as above | No | Same mis-dating |
| 70.3% per year | Share of cards with at least one changed field | “Just over 5% per month” is 70.3 divided by 12, not compounded | Over 1,200 self-reported business cards | John Coe, 2002, updated 2009 | No | Traceable to origin, but it is an any-change incidence, not a decay rate |
| 70.8% of contacts | Same any-change measure, earlier version | Annual | Approximately 1,025 cards | Same research programme | No | Quoted interchangeably with 70.3% despite a different sample |
| “22.5% to 70.3%” | Two different objects presented as one range | Two different formulas | Two unrelated samples | Landbase, April 2026, presented as original analysis with no source | Yes | The merge itself. The endpoints do not measure the same thing |
Suggested citation: IVRIS Tech, “CRM Data Decay Statistics: The Reconciliation Table”, ivristech.com, August 2026.
How one monthly rate becomes 22.5% or 70.3%
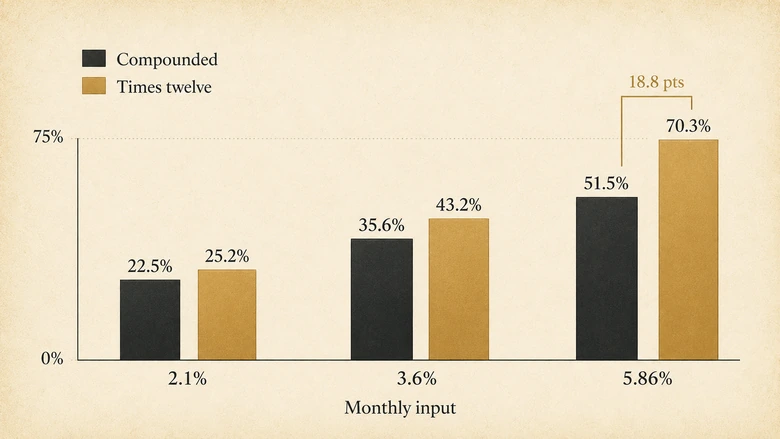
Annualising a monthly decay rate has two common methods, and they diverge sharply as the rate rises. Compounding applies the rate to the shrinking pool of still-accurate records. Multiplying by 12 assumes every month removes the same absolute quantity, which double-counts records that already went stale.
Annual decay (compounded) = 1 − (1 − monthly rate)¹²Applied to the three monthly rates in circulation, the choice of formula moves the answer by up to 19 percentage points:
| Published claim | Monthly rate | Annualised by compounding | Annualised by multiplying by 12 | Which one the publisher used |
|---|---|---|---|---|
| MarketingSherpa, via HubSpot | 2.1% | 22.5% | 25.2% | Compounding |
| Email decay, Landbase | 3.6% | 35.6% | 43.2% | Compounding |
| Email decay, ZoomInfo | 3.6% | 35.6% | 43.2% | Multiplying by 12 |
| Business-card survey | 5.86% | 51.5% | 70.3% | Multiplying by 12 |
The consequence is the headline finding of this page. The published range of 22.5% to 70.3% is a spread of 47.8 percentage points. Put both endpoints on a compounding basis and the range becomes 22.5% to 51.5%, a spread of 29.1 points. That 51.5% is not a decay rate we are asserting: it is what the same publisher’s own monthly figure produces when compounded the way the lower figure is, shown only to isolate how much of the headline gap is arithmetic convention. The underlying business-card number is an any-change incidence, and as the table above says, an incidence is not a rate and should not be applied to a record count. Roughly 39% of the gap between the two most-quoted decay figures is created by the annualisation formula alone, before you account for the fact that the two endpoints measure different things.
The ZoomInfo and Landbase rows make the point without any interpretation. Both pages start from 3.6% a month for email. One publishes 35.6% for the year and the other publishes 43.2%. Nothing about email deliverability differs between them. Only the formula does.
Where the 70.3% figure actually comes from
The 70.3% figure originates in a self-reported survey of business cards, not in any database audit. Its provenance is documented and short.
The research was run in 2002 and updated in 2009. Over 1,200 people handed in a business card and were asked what had changed on it in the last 12 months. Job title or function had changed for 65.8% of them. Phone numbers had changed for 42.9%. Taken together, just over 70% of cards showed at least one change. The author, John Coe, published the summary on Biznology in February 2015, and noted there that the work had been cited by Dun & Bradstreet, Zoom and Jigsaw.
That last detail resolves a puzzle. “Dun & Bradstreet says B2B data decays at 70% a year” and “the business-card study found 70.3%” are not two independent confirmations. They are one survey and its most prominent citer. Treating them as corroborating sources is the same double-count that affects the 22.5% figure at the other end of the range.
Three properties of that survey matter for anyone quoting the number in 2026:
- It is self-reported. Respondents recalled what changed rather than a system observing it, which is a different instrument from bounce telemetry or a database refresh log.
- It measures any change, so it is a union across fields rather than a rate, and cannot be applied to a record count.
- Its fieldwork is from 2002 and 2009. Presenting it as a current benchmark makes a claim about 2026 conditions that the study cannot support in either direction.
Two of those fields, 65.8% for titles and 42.9% for phones, reappear in 2026 vendor tables attributed to present-day analysis. The give-away is the accompanying monthly rate. Divide 65.8 by 12 and you get 5.48, published as “~5.5% per month”. Divide 42.9 by 12 and you get 3.58, published as “~3.6% per month”. The monthly figures were reverse-engineered from a twenty-year-old annual survey, not measured.
Decay statistics that do not survive an audit
Four claims failed verification against an original document. They are listed here rather than dropped, because knowing a number cannot be traced is more useful than silently omitting it.
| Claim | Where it appears | What we could verify | Verdict |
|---|---|---|---|
| “B2B data decays 30% to 40% per year, per Dun & Bradstreet” | Numerous vendor blogs | Widely repeated in secondary sources only | No primary Dun & Bradstreet document located. Do not cite as a D&B finding |
| “70.3% per year, per Gartner” | Several vendor pages | The figure traces to the 2002 business-card survey | Mis-attributed. Gartner is not the source |
| “30%+ per year” | RevenueBase, June 2026 | Described on-page as a “commonly cited industry figure” | No publisher, sample or year given anywhere on the page |
| “2.1% per month” sample and method | MarketingSherpa via dozens of citers | The 2012 benchmark report is named | The underlying sample size and measurement method are not published in any retrievable source |
The pattern here matches what we found auditing an adjacent field in our speed to lead statistics review: the figures that travel furthest are usually the ones that shed their methodology earliest. A number with no denominator attached is easier to reprint than one that comes with caveats.
PRO TIP
Before citing any decay figure, search for the phrase plus the word “study” or “report”. If every result is a vendor blog citing another vendor blog, you are looking at a claim with no floor under it.
Why these figures cannot be averaged into one benchmark
Averaging requires that the inputs measure the same quantity over the same population using the same instrument. The decay literature fails all three tests at once, which is why publishing a range like “22.5% to 70.3%” implies a distribution that does not exist.
The endpoints of that range differ on every axis that matters. One is a compounded contact-data rate from a 2012 benchmark report of unpublished sample size. The other is a linear projection of an any-change incidence from a self-reported business-card survey run in 2002. They share neither a definition, nor a population, nor a measurement method, nor a decade. There is no meaningful midpoint between them, and a reader who takes 46% as “the average” has computed a number that describes nothing.
This is the same failure mode that shows up whenever firmographic and technographic data quality gets discussed as a single score. Firmographic fields and technographic fields decay at different speeds for different reasons, and blending them into one accuracy percentage hides the only distinction that would tell you what to re-verify first.
What you can do instead is state the figure with its scope attached. “Job titles changed for 65.8% of respondents in a 2002 self-reported survey of over 1,200 business cards” is a defensible sentence. “B2B data decays at 70% a year” is not, because there is no population for which that sentence has been demonstrated.
Set your own re-verification interval instead of borrowing one
Your own bounce and connect data is a better input than any published rate, because it measures your list, your industries and your acquisition sources. The method below returns a defensible refresh cadence from numbers your CRM and sending platform already hold.
Workflow · 30 min
How to calculate your own CRM re-verification interval
Derives a refresh cadence from your own hard-bounce rate and record-age distribution rather than from a published industry figure.
Pull hard bounces by record age
Export the last 90 days of sends from your sending platform. Join each hard bounce to the record’s created or last-verified date in the CRM. Group into 0 to 6, 7 to 12, 13 to 24 and 25+ month buckets.
Compute the observed monthly decay rate
Divide the bucket’s hard-bounce count by the records sent to in that bucket, then divide by the bucket’s midpoint age in months. This is your measured monthly rate for email deliverability only.
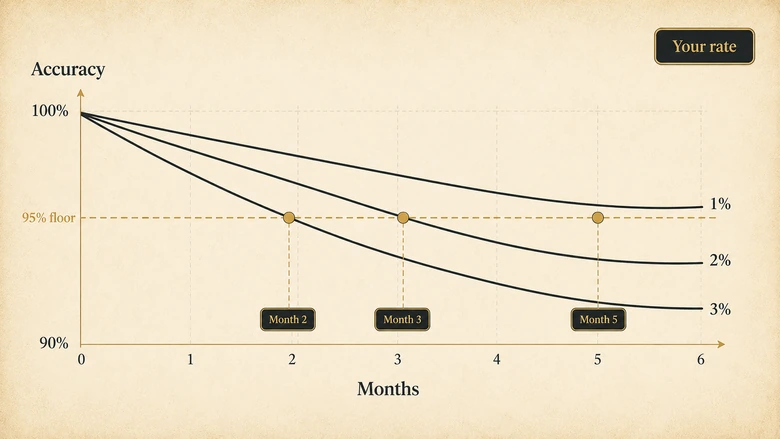
Set your accuracy floor
Decide the lowest share of reachable records you will tolerate before a segment is refreshed. Outbound sequences usually sit near 95% to protect sender reputation; a long-cycle newsletter list can run lower.
Solve for the interval
Find the number of months at which compounding your measured rate crosses the floor. At 3% a month, a 95% floor is breached before month two; at 1% a month it holds past month five.
Repeat per field, not per database
Run the same calculation separately for job title using connect-rate or reply-bounce signals. Titles and emails decay at different speeds, so one database-wide cadence over-refreshes one field and under-refreshes the other.
Months to floor = log(accuracy floor) ÷ log(1 − monthly rate)Two cautions apply. Hard-bounce data measures deliverability, so it tells you nothing about whether a still-deliverable contact has changed roles. And a record that never receives a send generates no signal at all, which means quiet segments decay invisibly. Pair the interval with a sampled manual check on the segments you rarely mail.
What each statistic can and cannot support
Each figure has a narrow set of claims it can carry. Used inside that set it is solid evidence, and used outside it the number is doing work the study never did.
| Figure | It can support | It cannot support |
|---|---|---|
| 2.1% per month / 22.5% per year | A rough order of magnitude for contact-record staleness in B2B | Any field-level claim, or any claim about 2026 conditions, since the report is from 2012 |
| 3.6% per month, email | List hygiene planning and bounce-risk budgeting | The share of your CRM that is wrong, because a live address can sit on an outdated record |
| 65.8% job titles, 42.9% phones | The argument that role and contact fields move faster than company fields | A current benchmark, and not a monthly rate under any circumstances |
| 70.3% or 70.8% | The argument that most records need periodic review | A decay rate, a record-loss estimate, or an accuracy percentage |
For the practical follow-on, matching and merge quality usually matters more than raw decay rate, because a database with a 20% decay rate and clean matching outperforms one at 10% with duplicates fanning out across records. Our guides to fuzzy string matching for company names and B2B data enrichment cover those mechanics.
Methodology and revision history
IVRIS retrieved and read each source page in full on 1 August 2026, including ZoomInfo’s B2B data decay page, Landbase’s decay article, Saleshandy’s data decay guide and HubSpot’s Database Decay Simulation. Where a page cited an upstream source, we followed the citation to the earliest retrievable document and recorded what that document itself claimed.
The compounding and multiplication columns are IVRIS calculations applied to the monthly rates as published. They are arithmetic on other people’s inputs, not new measurement. IVRIS did not run a decay study, did not commission one, and does not hold proprietary decay data. Where a claim could not be traced, the table says so rather than substituting an estimate.
One limitation is worth stating plainly. Absence of a retrievable original does not prove a study never existed. The MarketingSherpa 2012 report is named consistently enough that the figure probably does rest on real fieldwork; what is missing is the published sample and method that would let anyone check it. Our verdicts describe what can be verified today, not what is true.
This page will be re-audited when any of the four primary sources publishes new fieldwork, and at minimum every six months. Revision history is maintained at the foot of the reconciliation table on each update.
DOWNLOAD THE CALCULATOR
Set your own re-verification interval instead of borrowing a published one: IVRIS CRM Re-Verification Interval Calculator v1.0 (XLSX). Enter your own hard-bounce rate by record-age bucket and it returns months-to-floor, showing the compounded and multiply-by-twelve answers side by side. Free, no email required.
Suggested citation: IVRIS Tech. “CRM Data Decay Statistics: Reconciliation Table and Re-Verification Calculator.” ivristech.com, 2026. https://ivristech.com/crm-data-decay-statistics/
Frequently Asked Questions
Data decay is the loss of accuracy in stored records over time as people change jobs, companies restructure, and contact details stop working. In a CRM it shows up as bounced emails, disconnected phone numbers, outdated job titles and company records that no longer match reality.
There is no single rate. Published figures run from 22.5% to 70.3%, but they measure different objects and use different annualisation formulas. Email deliverability, job titles and any-change incidence each produce a different number. Measure your own list rather than adopting a published figure.
It is MarketingSherpa’s 2.1% monthly figure, from a 2012 benchmark report, compounded across twelve months to give 22.48%. HubSpot’s Database Decay Simulation popularised it. At least one vendor attributes the same 22.5% to Dun & Bradstreet instead, so the attribution is genuinely contested.
It is accurately reported but widely misused. The figure is the share of business cards showing at least one changed field in 12 months, from a self-reported survey run in 2002 and updated in 2009. It is an any-change incidence, not a decay rate, and not a 2026 measurement.
The recurring four are decayed contact details, duplicate records created by inconsistent entry, incomplete fields that break segmentation, and company records that fail to match across systems. Decay is the only one of the four that worsens without anyone touching the database.
Set the interval from your own measured monthly bounce rate and an accuracy floor you choose, rather than a published cadence. At 3% monthly decay a 95% floor is breached inside two months; at 1% it holds past five. Run the calculation per field, not per database.





