Most speed to lead statistics in circulation trace back to four studies, and two of them are older than the iPhone. IVRIS reviewed 14 public source documents and 39 individual statistics on lead response time, checked each one against the original publication, and recorded what the source actually measured. This page is the record of that audit.
The problem with this topic is not that the research is bad. The problem is that the numbers travel without their definitions. A figure about the odds of reaching someone by phone gets reprinted as a conversion rate. An average calculated only among companies that replied gets quoted as a market average. A 2011 result gets labelled a 2026 benchmark.
Below you will find every headline figure with its sample, its clock, its denominator and its year attached, a list of the claims that could not be traced to any original study, and the reasons these numbers cannot be averaged into a single benchmark. If you want the operating side rather than the evidence side, our speed to lead guide covers definitions, response-time targets and implementation.
Direct answer — What do the speed-to-lead statistics show?
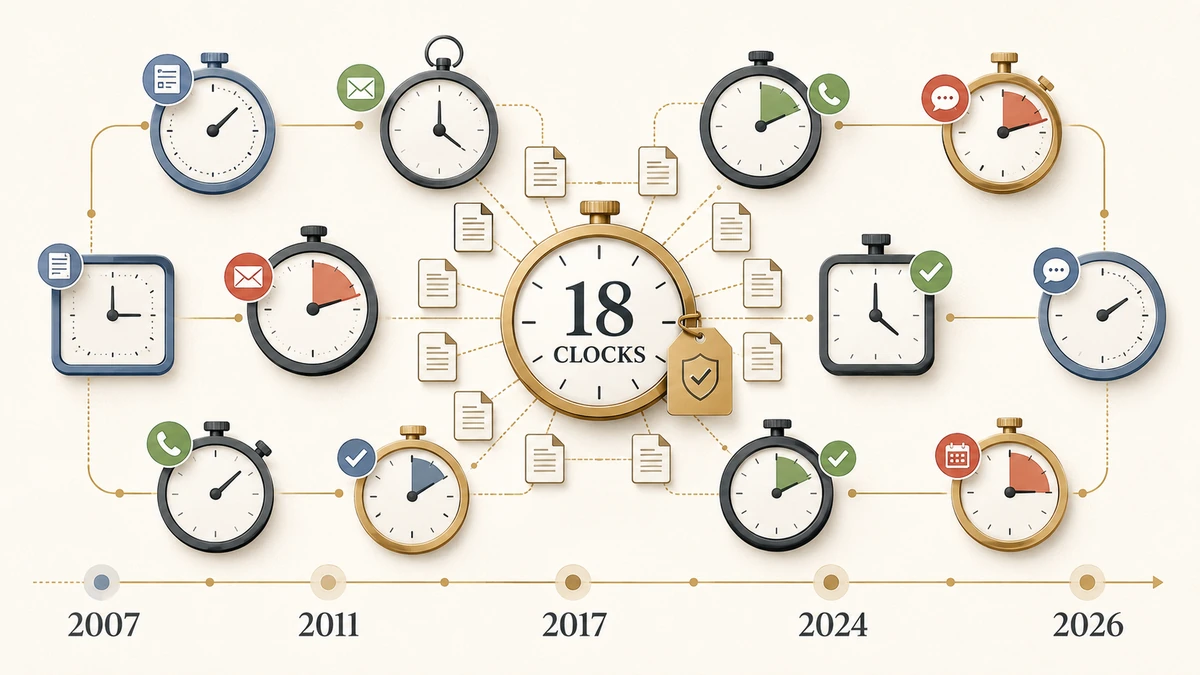
Across 14 public studies published between 2007 and 2026, there is no single current average B2B lead response time. The sources use 18 different clock definitions, two thirds of the statistics are more than five years old, and no two studies share a population, channel and outcome definition closely enough to be averaged together. Quote each figure with its own denominator attached.
Key Takeaways
- IVRIS reviewed 14 public source documents and 39 individual statistics, each verified against the original publication on 24 July 2026.
- Those 14 sources use 18 distinct clocks. Some measure a first response, others a live phone contact, a company-defined qualification, or a booked meeting.
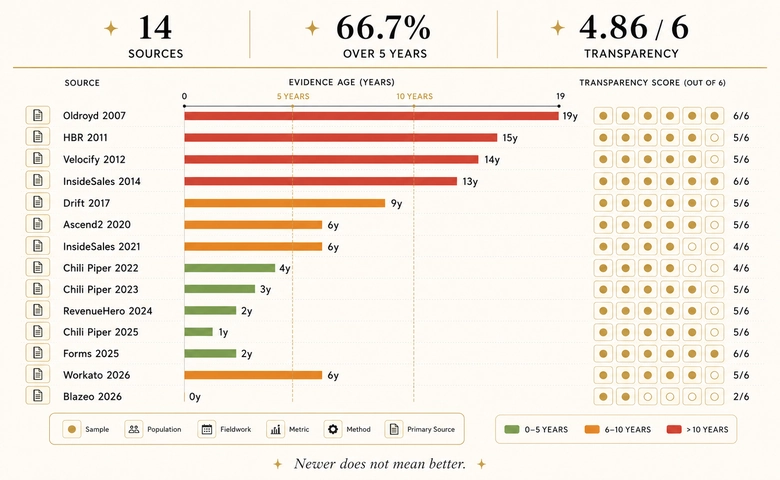
- Two thirds of the statistics (66.7%) are more than five years old and 38.5% are more than a decade old, yet only 28.6% of the sources disclose when their fieldwork took place.
- None of the six candidate comparison groups passes every compatibility test, so there is no defensible pooled average or median to publish.
- The 2007 study behind the five-minute rule states in its own text that it “did not address close ratios,” so the 21x and 100x figures cannot support any claim about sales conversion.
The speed-to-lead statistics that matter, with their scope attached
A speed-to-lead statistic is only usable when four things travel with it: who was measured, what event started and stopped the clock, what counted as the outcome, and which companies were left in the denominator. The table below carries those fields for the figures that appear most often in B2B content.
| Statistic | Source and year | Sample and denominator | What it actually measures |
|---|---|---|---|
| 100x higher odds at 5 minutes vs 30 minutes | InsideSales.com / MIT, Oldroyd, 2007 | Over 15,000 web leads, 100,000 dial attempts, 6 companies | Odds of contact, meaning a call that reached a live person |
| 21x higher odds at 5 minutes vs 30 minutes | InsideSales.com / MIT, 2007 | Same six-company dataset | Odds of qualification, defined separately by each participating company |
| 42-hour average response time | Harvard Business Review, 2011 | 2,241 US companies; average taken only among those that replied within 30 days | Time to any response, excluding the 23% that never replied |
| 391% conversion improvement at one minute | Velocify / Leads360, 2012 | Nearly 3.5 million leads, 400+ companies, leads generated in H1 2012 | Improvement against the dataset average, not against the next time band |
| 47% of companies did not respond at all | InsideSales.com / XANT, 2014 | 4,472 of 9,538 companies that received a test web lead | Non-response across all channels within the observation window |
| 7% responded within five minutes | Drift, now hosted by Salesloft, 2017 | 433 B2B SaaS companies | Response inside a five-business-day observation window |
| 17% make first contact within five minutes | Ascend2 / Verse, 2020 | 277 marketing and sales professionals | Self-reported behaviour, not observed response |
| 77% of leads not responded to at all | InsideSales.com / XANT, 2021 | 5.7 million marketing leads, 400+ companies, three years | Vendor-system data; the document defines no methodology |
| Average 4 hours 50 minutes | Chili Piper, 2022 | Sample size never disclosed; average excludes non-repliers | Time to any response among companies that replied |
| 35% of the top 100 SaaS companies did not respond | Chili Piper, 2023 | Top 100 SaaS companies by size, averaging ~13,000 employees | Email response to a demo request; phone excluded |
| Average 1 day 5 hours 17 minutes | RevenueHero, 2024 | 365 replies received from 1,000 B2B SaaS sites | Any response including automated replies, responders only |
| Average 11 hours 54 minutes | Workato, 2026 | 114 B2B companies; fieldwork dates not disclosed | Personalised email only; automated acknowledgements excluded |
Read down the fourth column and the core issue becomes obvious. These rows are not twelve measurements of one thing. They are twelve measurements of different things that share a label.
Eighteen different clocks are all called speed to lead
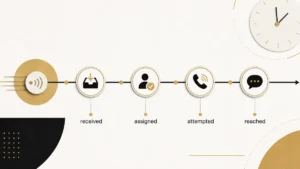
A clock is the pair of events that a study starts and stops on. Across the 14 sources, IVRIS identified 18 distinct clock definitions published under the same two labels. Grouping them by what they end on produces five outcome families, and figures from different families should never be compared.
| Outcome family | What the clock stops on | Example sources |
|---|---|---|
| Response or attempt | The company takes an outbound action. It may be automated and need not reach anyone. | HBR 2011, InsideSales 2014, Drift 2017, Chili Piper 2022, RevenueHero 2024, Workato 2026 |
| Contact | A live person is reached, under the source’s own duration rule. | InsideSales / MIT 2007 |
| Conversation or qualification | A meaningful sales conversation, or the prospect agreeing to enter the sales process. | InsideSales / MIT 2007, HBR 2011 |
| Conversion | A source-specific milestone such as a meeting, opportunity or customer. | Velocify 2012, InsideSales 2021 |
| Automation or scheduling | Routing, acknowledgement or calendar-booking behaviour, not a human response. | Chili Piper 2023 and 2025, RevenueHero 2024, Workato 2026 |
The qualification family carries an extra warning. The 2007 study’s own footnote says that “each company involved in the study had their own way to indicate a qualified lead.” Qualification was whatever each of the six participating companies said it was. That is the same definitional drift that makes MQL and SQL thresholds impossible to benchmark across companies, and it is why a qualification odds ratio cannot be read as a conversion rate.
How old is the speed-to-lead evidence?
Evidence age matters here because the two most-quoted figures predate the tools, channels and buying behaviour they are now used to describe. IVRIS scored every source on evidence age and on transparency, defined as one point each for disclosing sample, population, field period, metric definition, methodology and an accessible primary document.
| Measure | Result | How it was calculated |
|---|---|---|
| Statistics more than five years old | 66.7% | Audit year minus best available evidence year, across 39 statistics |
| Statistics more than ten years old | 38.5% | Same rule, same 39 statistics |
| Sources disclosing explicit fieldwork dates | 28.6% (4 of 14) | A publication date alone does not count |
| Sources disclosing sample size | 92.9% (13 of 14) | Exact or clearly bounded counts |
| Sources defining the metric | 78.6% (11 of 14) | Start event, end event and outcome sufficiently clear |
| Mean transparency score | 4.86 out of 6 | Average across the 14 source documents |
Only four of the fourteen sources say when their data was collected. Workato’s study, published in March 2026 and widely quoted as current, discloses no fieldwork dates anywhere, and the same findings appeared in earlier Workato material. It is accurate to call it published in 2026. It is not accurate to call it 2026 data.
IMPORTANT
A high transparency score measures how auditable a study is, not whether it is true or how strong its causal claim is. The 2007 study scores 6 out of 6 because it publishes its sample, population, definitions and method. It is still a 19-year-old observational dataset from six companies.
Response-time statistics, study by study
Response-time studies split into two designs: secret-shopper audits that submit real forms and observe what happens, and surveys that ask practitioners what they do. The two produce very different pictures, and the gap between them is itself a finding. Neither design separates leads that warrant an immediate call from leads that do not, which is a lead scoring decision rather than a response-time one.
Observed audits
In 2014, InsideSales submitted test web leads to 14,061 companies. Of the 9,538 that received a submission successfully, 4,472 (47%) never responded. Among companies that did respond by phone, the median first response was 3 hours 8 minutes while the mean was 61 hours 1 minute. The report is unusually candid about why those two numbers differ so much, noting that “the median is more informative than the average because outlying response times pull the average time much higher.”
RevenueHero’s 2024 audit submitted demo requests to 1,000 B2B SaaS sites and received 365 replies, a mean of 1 day 5 hours 17 minutes among those responders. The breakdown matters more than the mean: 172 replies arrived in under two minutes, while 12 took longer than a week. A single average across that distribution describes almost nobody. Automated replies accounted for 60.27% of responses and were faster than manual ones, at 17 hours 20 minutes against 2 days 3 hours 11 minutes.
Workato’s 2026 study of 114 companies measured something narrower again: personalised email only, with automated acknowledgements excluded. On that clock the average was 11 hours 54 minutes, and exactly one company replied within five minutes. Because the clock excludes automation, this figure is not comparable with RevenueHero’s.
One vendor’s testing is the closest thing this topic has to a trend line. Chili Piper has run the same demo-request test against the top 100 B2B SaaS companies for three consecutive years, and non-response fell from 35% in 2023 to 16% in its 2025 report. The company list was re-sourced between those years, from PeerSignal to Keyplay, so read it as indicative rather than a controlled panel. It is still the only repeated measurement in this set, and it points the opposite way from the common claim that response times are getting worse.
Self-reported surveys
Ascend2 and Verse surveyed 277 marketing and sales professionals in 2020. Seventeen percent said their first follow-up attempt happens within five minutes, and 55% said it takes more than 30 minutes. Respondents also estimated that 44% of leads arrive outside business hours, which is the practical reason a business-hours average and a wall-clock average diverge so sharply.
Self-reported speed runs consistently faster than observed speed. That is a normal survey artefact rather than a contradiction, and it is one more reason not to average the two designs together. If your own reporting depends on wall-clock accuracy, the owner of that definition is usually revenue operations rather than any individual rep.
What the conversion-effect studies actually measured
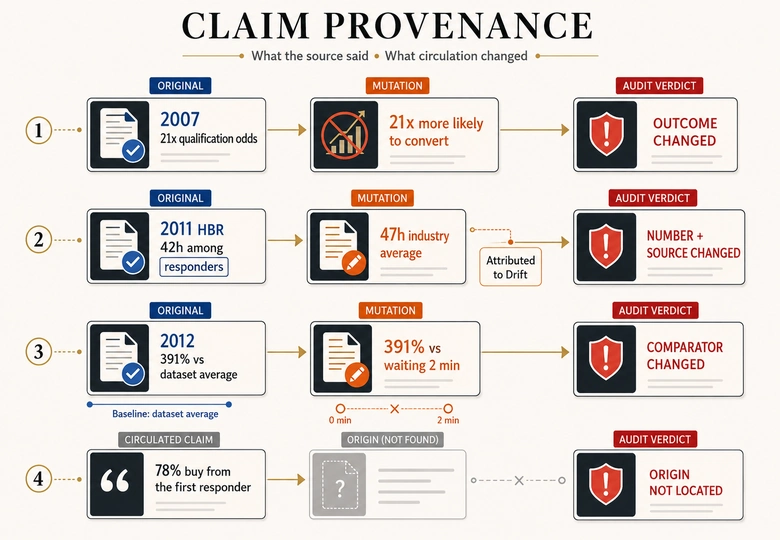
Three studies are the source of nearly every “respond faster and convert more” claim in B2B content. None of them measured what the claim says they measured.
The 2007 InsideSales.com and MIT study reported that “the odds of contacting a lead if called in 5 minutes versus 30 minutes drop 100 times” and that “the odds of qualifying a lead if called in 5 minutes versus 30 minutes drop 21 times.” Its own scope statement is explicit: the study “did not address close ratios.” Contact and qualification were the outcomes. Sales were not measured at all. The commercial logic for acting fast still holds, since a warm lead converts several times better than a cold one, but that is an argument for speed rather than a finding from this study.
The 2012 Velocify study plotted improvement in conversion rate against call speed, reaching 391% at one minute. The comparator is the part that gets lost. Every point on that chart is measured against the dataset average, not against the adjacent time band. Two minutes is itself a 160% improvement on the same baseline. Writing “391% better than waiting two minutes” misstates the chart by comparing one improvement figure to another.
The 2021 InsideSales infographic is frequently described as a modern replication of the 2007 work. It is not. It reports conversion rates 8x higher within five minutes than at six minutes or later, across 5.7 million leads and 400-plus companies, but the document never defines what conversion means, contains no methodology section, and closes with a product call to action. It is a later vendor-system result from a different dataset, which is a reasonable thing to cite as long as it is labelled that way.
Speed-to-lead statistics that do not survive an audit
Six widely repeated claims failed verification. Three could not be traced to any original study, and three are traceable but consistently misquoted. The provenance column records what changed between the original and the version now in circulation.
| Claim in circulation | Status | What the record shows |
|---|---|---|
| 78% of customers buy from the first company to respond | Untraceable | Repeated as “Lead Connect” with no accessible original study. IVRIS could not locate a defined sample, method or purchase outcome. |
| 35-50% of sales go to the vendor that responds first | Untraceable | Circulates across vendor blogs with no accessible original dataset behind it. |
| The average B2B response time is 47 hours | Misquoted | HBR reported 42 hours among companies that replied within 30 days. No primary source reports 47. |
| Drift found companies take 47 hours on average | Wrong attribution | The Drift report gives 7% within five minutes and 55% with no reply in five business days. It publishes no mean. |
| HBR studied 15,000 leads and 100,000 calls | Two studies merged | Those figures belong to the 2007 InsideSales report. HBR describes an audit of 2,241 companies. |
| 55% of companies never respond | Overstated | Drift observed no response inside a five-business-day window, which is not the same as never. |
One 2026 source deserves its own note. Blazeo’s speed-to-lead benchmark report is promoted with public claims such as “the top 25% of companies respond within 5 minutes,” but the underlying numbers and method sit behind a registration form. IVRIS could not verify those figures against a public document, so they are recorded in the ledger as not publicly verifiable and are not used as evidence anywhere on this page.
Why these statistics cannot be averaged into one benchmark
Pooling is only legitimate when studies share a population, a lead source, a channel, a start event, an end event, an outcome definition, a denominator and a time band. IVRIS tested six candidate groupings against those dimensions. None passed.
| Candidate grouping | Why it fails | Verdict |
|---|---|---|
| Historical phone-outcome studies (2007, 2012, 2021) | Different outcomes and comparators; conversion is defined differently or not at all | No pooled multiplier |
| Broad response audits (2011, 2014, 2017, 2022, 2024) | Different populations, channels, automated-response rules and observation windows | Side by side only |
| Recent personalised-response audits (2023, 2026) | Different samples and channel treatment; likely different fieldwork years | No combined median |
| Automation and routing comparisons | Observed versus self-reported; selection confounding; subgroup sizes often absent | Directional context only |
| Non-response rates | Observation windows and response definitions differ across every source | Never average |
| Scheduling and form conversion | Measures meeting booking, not first response; vendor-customer selection | Separate metric family |
This is the finding that most statistics pages skip, because a page built on a pooled “industry average” needs that average to exist. It does not. Any article presenting one number as the current B2B benchmark has either combined incompatible studies or is quoting a figure whose method is not public.
What each statistic can and cannot support
The practical output of a provenance audit is wording. Each row below gives the safe form of a claim and the inference the source does not license.
| Statistic | Safe wording | What it cannot support |
|---|---|---|
| 100x / 21x at five minutes | “In the 2007 InsideSales six-company dataset, calling at five minutes rather than 30 was associated with 100-fold higher odds of contact and 21-fold higher odds of qualification.” | Sales conversion, revenue lift, or a current universal benchmark |
| 42 hours | “HBR’s 2011 audit of 2,241 US companies found an average of 42 hours among those that responded within 30 days, while 23% did not respond.” | A 2026 market average, or a figure that includes non-responders |
| 391% at one minute | “Velocify’s 2012 analysis of nearly 3.5 million leads reported a 391% improvement on the dataset average conversion rate for calls placed within one minute.” | A comparison against the two-minute or five-minute band |
| 1 day 5 hours 17 minutes | “RevenueHero’s 2024 audit of 1,000 B2B SaaS sites recorded this mean across the 365 replies received, including automated responses.” | An all-company average, or a human-response time |
| 11 hours 54 minutes | “Workato’s study of 114 companies, published in 2026 with no fieldwork dates disclosed, reported this average for personalised email responses.” | Comparison with studies that count automated replies |
| Routing tools at 3h32m versus 13h | “Companies Workato identified as using a lead-routing tool averaged 3 hours 32 minutes against nearly 13 hours for those without one.” | That routing tools caused the difference |
Two general rules cover most cases. Never convert an odds ratio about contact or qualification into a statement about sales, and never quote an average without saying who was left in the denominator. Both errors are visible in the top results for this topic today.
What the automation and SLA statistics show
Automation statistics on this topic are associations rather than experiments, and they should be quoted that way. Workato found that companies it identified as using a lead-routing tool averaged 3 hours 32 minutes against nearly 13 hours for those without one. Chili Piper’s 2023 study found that 97% of the companies that never responded had no calendar scheduler in place.
Both patterns are real and both are confounded. Companies that buy routing software are already the companies that have decided response speed matters, staffed for it and measured it. No public study on this topic randomises tool adoption, so none of them can separate the tool from the team that chose it.
Scheduling figures belong in their own family. Chili Piper’s 2025 analysis of nearly four million form submissions from its own customer base found 14.1% disqualified and 66.7% of qualified submissions booking a meeting. That measures meeting booking inside a vendor’s install base, not first response across the market, so it cannot sit in a response-time table.
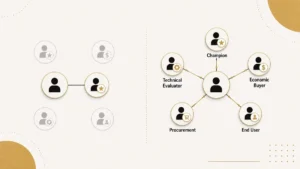
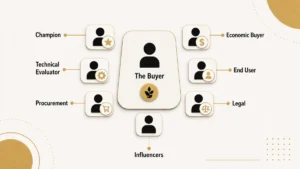
One structural limitation applies to every source here. Buying is rarely a single-person act, so a fast reply to one form filler is not the same as reaching the group that makes the decision, and no study in this set records whether the response reached anyone with authority to buy.
Response speed also cannot be measured at all if inquiries never arrive in the CRM. Reconciling forms submitted against leads created is worth doing with a form and UTM audit before you benchmark your number against anyone else’s.
CITE THIS PAGE
Key finding to quote: across 14 public sources and 39 statistics, speed-to-lead research uses 18 different clock definitions, 66.7% of the statistics are more than five years old, and none of the six candidate comparison groups passes every compatibility test, so no defensible pooled average exists.
Copy-paste citation: IVRIS Tech. “Speed-to-Lead Statistics: What 14 Public Studies Actually Measured.” ivristech.com, 2026. https://ivristech.com/speed-to-lead-statistics/
Download the full ledger: XLSX · CSV — 39 claims with sample, clock, denominator, transparency score and safe wording.
Methodology and revision history
IVRIS compiled this page from public source documents only. IVRIS did not conduct any of the underlying studies, and each original organisation retains ownership of its research. What IVRIS contributes is the classification layer: clock normalisation, outcome-family tagging, compatibility testing, transparency scoring, provenance tracing and safe wording.
Every statistic was checked against its original publication rather than a secondary summary. Where a figure appears only in a recap article, it was excluded. Transparency scores award one point each for a disclosed sample, a defined population, a disclosed field period, a defined metric, available methodology and an accessible primary document. Evidence age uses the best available data-end year, falling back to publication year where fieldwork dates are not stated, and those cases are labelled.
Cite the original organisation for any individual figure. Cite IVRIS for the comparison, classification, age analysis or provenance finding.
| Version | Date | Change |
|---|---|---|
| 1.0 | 24 July 2026 | First publication. 14 sources and 39 statistics verified against original documents. Three Blazeo figures recorded as not publicly verifiable. |
Last reviewed: 24 July 2026. Next scheduled review: January 2027.
Frequently Asked Questions
Of the 39 statistics IVRIS reviewed, 36 trace to an accessible primary document. Three come from a 2026 report whose numbers sit behind a registration form. Separately, two widely quoted claims, the 78% first-responder figure and the 35-50% range, could not be traced to any original study at all.
No. IVRIS tested six candidate groupings against population, channel, start event, end event, outcome and denominator, and none passed. Studies differ on whether automated replies count, whether non-responders stay in the denominator, and whether the clock stops at a reply or at a live conversation.
Qualification. The 2007 InsideSales and MIT study reported 21 times higher odds of qualifying a lead at five minutes versus 30 minutes, where qualification meant the prospect agreeing to enter the sales process. The same study states that it did not address close ratios, so it cannot support a conversion claim.
Two thirds of the statistics are more than five years old and 38.5% are more than ten years old. The two most-quoted figures date from 2007 and 2011. Only four of the fourteen sources disclose when their fieldwork actually took place, so several apparently recent reports may rest on older data.
Any figure is safe to cite with its scope attached: the year, the sample, the clock and the denominator. The unsafe move is quoting a number as a current universal benchmark. Prefer recent observed audits for response times, and treat the 2007 and 2011 studies as historical evidence rather than live benchmarks.