
Ask three B2B teams for their speed to lead and you will get three numbers that cannot be compared, because each one is timing a different thing. One counts from the form submission to the auto-reply. One counts from the CRM record to the rep’s first call. One counts from the form submission to the moment a buyer actually picked up the phone. All three call the result “response time,” and then everyone argues about whose benchmark is right.
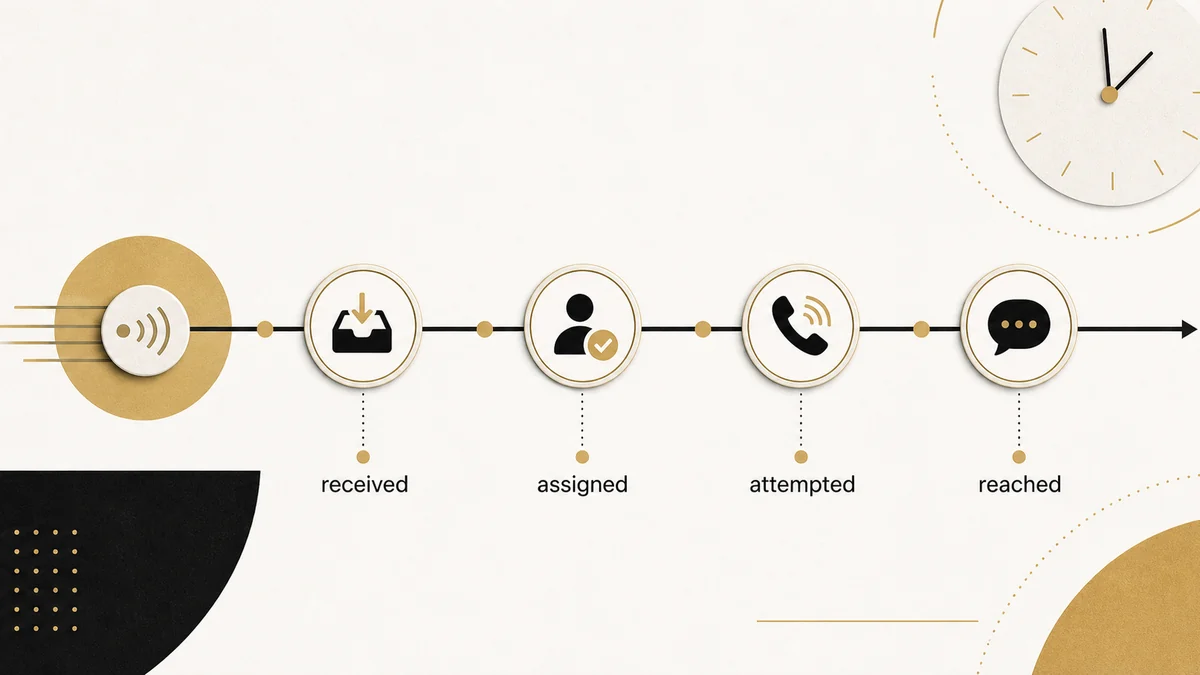
Speed to lead is not one clock. It is four, running back to back: the lead is received, then assigned, then someone makes a first attempt, and eventually there is successful contact. Almost every page on this topic collapses those four into a single number, which is exactly why the published benchmarks contradict each other and why “respond in five minutes” is such unhelpful advice when your real delay sits in the second clock.
This guide is the measurement and implementation side of the topic. You will get the four clocks with their start and stop events, the wall-clock versus working-time rule, a way to set targets per clock instead of one blanket SLA, a diagnostic for working out which clock is actually broken, and a worksheet to fill in for your own segments. The full provenance audit of the circulating statistics lives on a separate page, linked below.
Direct answer — What is speed to lead in B2B?
Speed to lead is the elapsed time from a defined inbound event to a defined sales response. For high-intent B2B demand, measure four separate clocks rather than one: received, assigned, first human attempt, and successful contact. Five minutes is a defensible aggressive target for staffed demo and contact-sales flows, but it comes from a 2007 six-company study of web forms followed by phone calls, not from a current universal benchmark.
Key Takeaways
- Speed to lead is four clocks: received, assigned, first attempt, successful contact. Publishing one blended number hides which of the four is broken.
- You can set an SLA on the first three clocks. You cannot set one on the fourth, because whether the buyer answers is not something your team controls.
- Report wall-clock and working time together. A team can hit a 22-minute staffed-hours average while a Friday evening lead waits until Monday.
- Leads with no human attempt stay in the denominator and get reported separately. Filtering them out is how a broken process starts looking fast.
- An automated acknowledgement does not stop the first-attempt clock, and a booked meeting is not the same event as a human conversation.
What is speed to lead, and what actually stops the clock?
Speed to lead is the time between a prospect’s inbound action and the first genuine sales response that reaches them. The clock starts when someone submits a demo request, a pricing inquiry, or another high-value form. What it stops on is the part every team defines differently, and that definition is where reporting goes wrong.
Three terms get used as if they mean the same thing. They are close, but each measures a slightly different clock.
| Term | What it measures | Best used for |
|---|---|---|
| Speed to lead | Time from an inbound action to the first sales response | High-intent inbound: demo, pricing, contact sales |
| Lead response time | The same clock, applied to any lead on any channel | Reporting across all lead types |
| First response time | Time to the first reply inside a conversation or ticket | Live chat and support contexts |
Two events get mistaken for a response and should not stop the clock. An autoresponder that says “we got your message” is a receipt, not a reply. A meeting booked through a scheduler is a fulfilment outcome, and a useful one, but the buyer still has not spoken to anyone. Both deserve their own timestamps, reported beside the human clocks rather than inside them.
There is a boundary worth stating plainly, because it trips up a lot of teams. Generating the lead is a separate job from responding to it: inbound lead generation is the work of getting the form filled, while speed to lead starts the second it is. Keep the two jobs separate and both your process and your reporting get cleaner.
Speed to lead is four clocks, not one
A response chain has four measurable stages, and each one has a different owner, a different failure mode, and a different fix. Timing only the whole chain tells you that you are slow. Timing the four stages tells you where.
The four clocks, defined
| Clock | Starts on | Stops on | Instrumentation you need | Common failure that inflates it | Can you set an SLA? |
|---|---|---|---|---|---|
| 1. Received | Buyer completes the qualifying action | CRM record is committed | Endpoint receipt timestamp stored separately from the CRM created date | Webhook retry, batch sync, API throttling, a validation rule rejecting the payload | Yes. Under a minute is achievable on a real-time integration. |
| 2. Assigned | CRM record committed | Owner or queue assignment written | A first-owner-assigned field kept separate from latest-owner-assigned | Enrichment with no timeout, account-matching conflict, routing rules with no fallback | Yes. This is a systems clock, not a people clock. |
| 3. First attempt | Owner assignment written | First logged human outreach | Activity records flagged human or automated at write time; notification delivered, not sent | Alert dispatched but never delivered; no claim step, so nobody owns it | Yes. This is the clock your SLA should govern. |
| 4. Successful contact | First human attempt | First two-way human exchange | Channel-specific connection evidence: answered call, buyer reply, chat exchange | Wrong channel, invalid number, time-zone mismatch, no context in the first touch | No. Measure it, report the distribution, and do not commit to it. |
Why the fourth clock gets no SLA
That last row is the one most teams get wrong, and it is worth being blunt about. Whether a buyer picks up the phone is not inside your control, so putting a target on it does not make anyone faster. It makes reps optimise for the cheapest thing that counts as contact. Measure clock four, publish its distribution, and hold the team to clocks one through three. The same control test applies to the quota sitting on top of these clocks, where whether a meeting is counted booked or held decides the same question and moves attainment by the whole no-show rate without any rep working differently.
Separating the stages also settles most benchmark arguments before they start. A vendor audit that counts an automated reply is measuring something adjacent to clock three. A CRM report built on the created date has already discarded clock one. Neither is wrong on its own terms, and neither can be compared with the other.
PRO TIP
Before you compare your speed to lead with anyone else’s, write down which of the four clocks your number starts and stops on. Most of the time the disagreement disappears at that point, because the two figures were never measuring the same interval.
One clarification on scope, because our own cluster splits this deliberately. This page defines the four operating stages inside your funnel so you can instrument and set targets against them. Our companion statistics audit takes the opposite view and catalogues how published studies define their own start and stop events, which is why their headline numbers cannot be pooled. Different objects, and the evidence section below links across to it.
Wall clock or working time, and who stays in the denominator
Two clock conventions are both legitimate, and neither should quietly replace the other. Wall-clock time measures the buyer’s total elapsed wait. Working time counts only the minutes that fall inside your declared coverage calendar for the eligible team.
Working time = staffed minutes between start and stop, using the versioned coverage calendarHere is why the pair matters. A demo request lands Friday at 17:55. The first meaningful human response goes out Monday at 09:05. Coverage is Monday to Friday, 09:00 to 17:00. Wall-clock response is 63 hours and 10 minutes. Working-time response is 10 minutes. The same event can meet an internal staffed-hours SLA and still produce a three-day silence from the buyer’s side.
Report both, and publish the share of leads arriving outside coverage alongside them. A fast working-time median can happily coexist with a poor after-hours experience, and only the pair makes that visible. One practical detail: store the calendar version used at calculation time, or editing a schedule six months from now will silently rewrite your historical results.
Denominators do as much damage as clocks. A lead that received no eligible human attempt by the observation cut-off is not a missing data point, it is the worst result in the set. Keep it in the coverage and SLA denominators, and report the no-response count beside the response-time figures rather than inside them. Routing changes deserve the same reconciliation before they ship, because testing every rule, overlap and fallback path is what stops a new rule quietly dropping leads out of the denominator.
IMPORTANT
Averages hide the tail, and the tail is where lost pipeline sits. Report p50, p90 and p95 with the no-response count next to them. A mean calculated on responders only is the single most flattering number in revenue reporting.
What the evidence supports, and what it doesn’t
The famous figures on this topic are real studies read too loosely. Two are worth knowing before you set any target, and both need their dates attached.
Where the five-minute and 42-hour figures come from
The five-minute rule comes from the 2007 Lead Response Management analysis produced by Dr. James Oldroyd while at MIT with InsideSales.com, which examined more than 15,000 web-generated leads and 100,000 dial attempts across six companies. It reported contact odds 100 times higher and qualification odds 21 times higher at five minutes than at 30. Those are contact and qualification odds from a phone-based six-company dataset, not a sales-conversion multiplier, and IVRIS did not identify a modern replication using the same design. The 42-hour figure comes from Harvard Business Review’s 2011 audit of 2,241 U.S. companies: 37 percent responded within an hour, 23 percent never responded at all, and the 42-hour average was calculated only among companies that answered within 30 days.
What the modern audits do and don’t show
Later vendor-run secret shops keep documenting delay without reproducing that original design. RevenueHero submitted demo requests to 1,000 B2B websites in 2024 and averaged 1 day, 5 hours and 17 minutes across the 365 replies it received, automated responses included. Workato tested 114 B2B companies in 2026 and found one company that sent a personalised email within five minutes. These are descriptive audits of operational delay. None of them is a market benchmark, and none of them measures an outcome.
One number deserves retiring outright. “78 percent of buyers purchase from the first responder” could not be traced to a primary study with a defined sample, method and purchase outcome during our audit, and it should not be cited as evidence. It is still circulating: on the US-English results we captured for this query on 1 August 2026, Google’s AI Overview presented the 78 percent claim as fact alongside the 21-times figure, attributed to a page that provides no original source. If you want the full provenance trail, sample sizes and compatibility rules for every circulating figure, that audit is a separate page: the speed-to-lead statistics ledger scores each source rather than restating it here.
How to set response-time targets per clock
A useful SLA sets different targets for different intent, and sets them against clock three rather than the whole chain. Work down these questions in order and stop at the first yes.
- Did the buyer ask for a synchronous conversation? A live call or staffed chat goes to an immediate queue with a service-level target and an abandonment rate, not a response-time SLA.
- Did they explicitly request sales contact, pricing or a demo? That is the high-intent tier and it earns your fastest staffed target.
- Is the signal product-qualified or trial-based? Rapid human follow-up or in-product booking, usually a looser band than the demo tier.
- Is it a high-fit marketing hand-raise with no conversation requested? Use a business-hour target based on fit, deal value and capacity.
- Is it passive content or newsletter activity? Acknowledge it and let scoring do its job. Do not impose a human-response SLA.
- Did it arrive outside staffed coverage? Send an accurate acknowledgement, preserve the wall clock, and start the operating clock at the next staffed opening only if that policy is written down.
Target bands by lead type
| Lead type | Clock 2 assigned | Clock 3 first attempt | Clock used | After-hours handling |
|---|---|---|---|---|
| Live inbound call or staffed chat | Immediate queue placement | Queue pickup within the staffed service level | Working time | Accurate message, callback option, next staffed opening |
| Demo, pricing or contact-sales form | Under 2 minutes | 5 to 15 minutes where staffing supports it | Both | Acknowledge and offer scheduling; human clock starts next staffed window, wall clock preserved |
| Product-qualified hand-raise or trial | Under 2 minutes | 15 minutes to 1 business hour | Both | In-product scheduler plus next staffed response |
| High-fit MQL | Under 5 minutes | 1 business hour to same business day | Working time, after-hours share published | Next local staffed window |
| Referral, partner or event lead | Same business day | Same day or next local staffed window | Working time | Do not backdate the clock to the badge scan if upload happened later |
| Content download or newsletter | Route to scoring, not to a rep | No mandatory human response | Not applicable | Not applicable |
Every band in that table is an IVRIS operating default for framework design. None of them is a public benchmark or a measured market figure. Treat them as starting targets and validate each one against your own contact, opportunity and win rates, then overwrite it.
Who owns the number
Applying a five-minute target to a newsletter signup is theatre. It burns rep time on someone months from buying and it trains the team to ignore the SLA on the leads where it counts. Which tier a lead lands in is a scoring decision, so lead scoring is what decides which clock starts, and the qualification thresholds behind it live in the MQL and SQL definitions your team already argues about. Reserving speed for genuine intent also protects the economics, because a warm lead converts several times better than a cold one and a slow response throws away the advantage you paid to create.
Ownership is the other half. The response-time standard is set and policed by revenue operations, not by individual reps, because it depends on routing rules, alerts and reporting that sit above any one seller’s inbox. If nobody owns the number, the number drifts.
How to instrument the four clocks
Most of this work is plumbing, not persuasion. The teams that report honest response times have made each of the four transitions leave a timestamp behind, so a slow number points at a stage instead of starting an argument. Those same timestamps are what let a written commitment become enforceable rather than aspirational, since a clause with no field behind it never appears in a report and never gets held to.
Workflow · six steps
How to instrument the four speed-to-lead clocks
Set up the event log that lets you report each clock separately instead of one blended response-time average.
Write the event dictionary first
Name the exact start and stop event for each of the four clocks, and the system whose timestamp is authoritative. Do this before you pull a single report, or you will measure whatever your CRM happens to expose.
Reconcile submissions against records daily
Compare form submissions to CRM records created for the same window. Any gap is clock one failing, and it corrupts every figure downstream.
Preserve the first owner assignment
Add a first-owner-assigned field that reassignment cannot overwrite. Most CRMs update the current-owner field in place, which silently resets clock two.
Log notifications delivered, not sent
Capture delivery telemetry from Slack, email or push, and alert on undelivered alerts. A dispatched notification is not proof the owner saw it.
Flag every activity as human or automated
Stamp the source on each activity record at write time. Without the flag a bot acknowledgement can stop clock three and your reporting will call a receipt a conversation.
Report the four clocks with percentiles and no-response
Publish p50, p90 and p95 per clock, per segment, with the unworked count beside them. Treat any lead with no attempt as a routing defect to fix, not a lead to write off.
Two of those steps depend on how leads are distributed in the first place, which is a topic in its own right. Our lead routing guide covers the assignment logic that clock two is measuring, and the routing audit walks through testing it before you trust the numbers. If the handoff itself is the sticking point, the accepted-lead event sits between assignment and attempt, and sales-accepted-lead mechanics define when ownership genuinely transfers.
Which clock is broken? A diagnostic
A slow blended number has at least ten plausible causes, and the timestamp pair you compare tells you which one you have. Work down this table until a symptom matches what your reporting shows.
Symptom to root cause
| Symptom | Likely cause | Timestamp test | What to do |
|---|---|---|---|
| Form submissions exceed CRM records | Capture failure, blocked integration, validation reject, duplicate suppression | Submission receipts vs records created | Instrument the endpoint, add a dead-letter queue, reconcile daily |
| Long form-to-record time | Webhook retry, batch sync, API throttling | Inbound event to CRM created | Move the critical path to real time, alert on retry age |
| Long record-to-assignment time | Enrichment wait, match complexity, rule conflict with no fallback | CRM created to owner assigned | Set a per-stage timeout and a deterministic fallback owner |
| Assigned quickly, notified slowly | Broken Slack or email integration, permissions, mobile delivery | Owner assigned to notification delivered | Use redundant channels and read delivery telemetry |
| Notified, but unworked | Rep capacity, cherry-picking, unclear ownership, weak escalation | Notification delivered to first human attempt | Add a claim step, availability-aware routing and a timed reroute |
| Fast attempt, low connection | Wrong channel, invalid contact data, time-zone mismatch | First attempt to first connected response | Change channel and local-time rules, validate contact data |
| Fast auto-email, slow human contact | Automation is masking the real handoff | First agent response minus first bot response | Publish the two clocks separately; never stop an SLA on a bot receipt |
| Strong average, unhappy buyers | Long-tail incidents hidden by the mean | Full distribution, not a single figure | Manage the p95 and the breach cohort, not the average |
Which tools compress which clock
Tooling maps onto this diagnostic stage by stage, which is a more useful way to buy than a generic list. Routing and scheduling platforms compress clock two by matching, qualifying and assigning in real time. Dialers and SMS tools compress clock three by removing the tool-switching between the alert and the call. Visitor identification sits before clock one entirely, surfacing in-market accounts that never submitted anything, which is outbound prospecting rather than a faster response to the same inbound event. Keep those clocks separate or a pre-form touch will make your speed-to-lead metric look artificially good. The routing job hides a second decision: which of the four rotation models routes it decides whether the least-loaded rep or simply the next rep in line picks up the phone.
Instant scheduling deserves one caveat, because it is often sold as removing the delay entirely. A booked meeting stops a different clock than a human conversation, and the booking still has to be attended: how far ahead a meeting is booked tracks with whether it gets attended, and one vendor’s analysis of 2,900 of its own demos found same-day meetings no-showed at 6.9 percent against 23.0 percent for meetings set eight or more days out. Speed that produces an unattended calendar invite has not produced a conversation.
No single tool fixes speed to lead, because the four clocks fail for unrelated reasons. Routing without a delivered alert still leaves the lead waiting, and an alert without a playbook just makes reps anxious. If you are assembling a stack, our rundown of sales automation tools by the job they do maps which category solves which delay.
When the lead never arrives at all
Every tool in the last section assumes the lead arrives intact, with a clean email, a matched account and its campaign data attached. When that assumption fails, the lead vanishes quietly and your response time improves, because the slowest cases were the ones that never entered the sample.
A form that silently fails validation, a hidden field that does not populate, or a webhook that rejects a payload produces an inquiry nobody works. If it never reaches the CRM, it is absent from a CRM-only average by construction. That failure mode has its own page: how silent form failures distort speed-to-lead reporting covers the correction formula, and the capture side of it sits in form attribution and capture integrity. Removing that manual dependency is precisely what automating the capture-and-routing steps does, which is why speed to lead improves the moment the handoff stops waiting on a person to notice a form.
This is the audit worth running before you buy anything. Confirm that every form submits, that campaign and UTM values land in the CRM, and that every handoff completes before you spend a dollar shaving seconds off the response. IVRIS’s free web form and UTM audit tools check exactly that.
Automation, AI SDRs and the automation-human gap
Automation can acknowledge an inquiry, enrich it and route it within seconds, which genuinely compresses clocks one and two. What it does not do is convert a receipt into a conversation, so the useful measurement is the distance between the two.
Automation-human gap = first human response − first automated responseThat gap is the number to watch as AI handles more of the front end. A wide gap means instant acknowledgement is masking a slow handoff, and buyers experience it as being answered by nobody. Salesforce’s 2026 State of Sales findings, based on a double-anonymous survey of 4,050 sales professionals, report that the average seller spends 40 percent of their time selling and that 54 percent of sales organisations have used AI agents. That supports testing automation on the mechanical clocks. It does not prove an AI first response improves inbound conversion.
Be sceptical of the “2026 benchmark” numbers now flooding this topic. Several of the response-time and conversion figures making the rounds are labelled, in their own fine print, as illustrative or directional rather than measured. A directional guess dressed as a benchmark is worse than no number at all, because teams set real SLAs against it. Anchor to the dated studies, then measure your own four clocks. Your numbers are the only benchmark that governs your pipeline. The same discipline is missing across most buyer research, where four separate studies get quoted as one journey benchmark despite measuring four different things.
Methodology and revision history
This page is a framework and implementation reference, not a study. IVRIS did not run any of the response-time research cited here, and does not publish a proprietary response-time benchmark.
The four-clock model, the target bands and the diagnostic table are IVRIS synthesis. Timestamp definitions were informed by official HubSpot and Salesforce field documentation for lead creation, owner assignment and activity logging. Historical statistics were used only where the original document was accessible, with sample, population, channel and outcome attached; the full source-by-source audit, including transparency scoring and the claims that failed it, is published separately in the speed-to-lead statistics ledger linked in the evidence section above.
Two limitations are worth stating outright. No modern public study replicates the 2007 design across contemporary multichannel B2B workflows, so nobody can currently say whether that effect size persists. And every target band on this page is an operating default chosen for framework design, not a measured market figure. If you hold a primary source that corrects anything here, we would rather update the page than defend it.
Version 2.0, reviewed 1 August 2026. This revision rebuilt the page around the four-clock model, moved the statistics provenance audit to its own page, added the wall-clock and working-time rule, the per-clock target framework, the diagnostic table and this methodology note. Next source check scheduled for November 2026.
CITE THIS PAGE
Finding to quote: speed to lead is four clocks, not one. Received, assigned, first attempt and successful contact each have distinct start and stop events, and only the first three can carry an SLA. Response-time figures are comparable only when their start event, end event, clock convention and denominator match.
Copy-paste citation: IVRIS Tech. “Speed to Lead: The Four Clocks Behind Your Response Time.” ivristech.com, 2026. https://ivristech.com/speed-to-lead/
Download the free Speed-to-Lead SLA Worksheet (ungated): XLSX · CSV — per-clock target bands, the wall-clock versus working-time switch, and a segment-by-segment SLA sheet you fill in for your own funnel.
Frequently Asked Questions
Speed to lead is the elapsed time between a defined inbound action, such as a demo request, and a defined sales response. For high-intent B2B demand, measure four separate clocks rather than one blended figure: received, assigned, first human attempt, and successful contact.
The clock starts when the buyer completes a qualifying action such as a demo or pricing form. What stops it depends on which clock you are timing: a committed CRM record, a written owner assignment, a first logged human outreach, or a genuine two-way exchange. Name the pair before publishing a number.
No. An automated acknowledgement is a receipt and belongs on its own clock. Track the automation-human gap, meaning first human response minus first automated response, so an instant auto-reply cannot hide a slow handoff to an actual person.
Five minutes is a defensible aggressive target for staffed, high-intent flows, and it applies to the first-attempt clock rather than the whole chain. It traces to a 2007 six-company study of web forms followed by phone calls, so the reported 21-times and 100-times odds are not current universal conversion multipliers.
Both, reported side by side. Wall clock answers what the buyer experienced; working time answers how the staffed process performed. Publish the share of leads arriving outside coverage too, because a strong working-time median can coexist with a poor after-hours experience.
Keep them in the denominator and report them separately as a no-response count. Excluding leads that never got a human attempt is the most common way a broken process produces a flattering average, because the slowest cases are the ones removed.
A first attempt is any logged human outreach, such as a call placed or a one-to-one email sent. Meaningful contact requires a two-way exchange that addresses the buyer’s request. Attempts are inside your control and can carry an SLA; whether the buyer answers is not.
No. A booked meeting is a fulfilment outcome, not a human response, and it deserves its own timestamp. Records that never reach a booking are the ones that quietly sit in a queue nobody watches, which is precisely what a blended response-time average will not show you.





