
Search b2b buyer behavior statistics today and Google answers before the results load. Its AI Overview opens with a confident line: 81% of buyers define their requirements and shortlist vendors before contacting a sales rep. It credits a vendor blog.
That figure is two different numbers fused into one. 6sense’s 2024 research reported that 81% of buyers had a preferred vendor at first contact, and separately that 85% had established their requirements. Neither says what the AI Overview says. And 6sense has since published a 2025 edition where the equivalent finding is 94%.
So the answer sitting above the search results is a merge of two constructs, sourced to a page that didn’t run the study, one edition out of date. That is not a Google problem. It is what happens when a statistic travels far enough from its own methodology, and it is the reason this page exists.
We pulled 50 claims from 13 original studies, checked every one against the publisher’s own release, and recorded what each actually measured. Ten more claims are listed here specifically so you know not to use them.
Direct answer — What do B2B buyer behaviour statistics actually show?
B2B buyer behaviour statistics describe how business buyers research, shortlist, validate and purchase. Current public research shows buyers form narrow vendor preferences early, use AI alongside search rather than instead of it, verify claims through peers, reviews and trials, and involve sellers selectively rather than not at all. There is no defensible universal figure for how much of the journey happens before sales contact. The four studies usually quoted for that number measure four different things.
Key Takeaways
- Preference forms early and narrowly. 6sense reports 94% of buying groups rank their shortlist before contacting anyone, and the vendor ranked first wins roughly four out of five deals.
- AI has been added to research, not substituted for search. In G2’s March 2026 sample, 51% start with an AI chatbot more often than Google while 80% still use Google somewhere.
- Buyers verify more, not less. 94% of TrustRadius’s 2026 buyers fact-check AI output at least some of the time, and 69% of Gartner’s buyers take AI-generated insights to a sales rep for validation.
- The famous “% of the journey before sales” benchmark does not exist. 61%, 62%, 67% and 17% are four separate constructs with four separate denominators.
- Three different studies in this evidence set all report 69%, and all three are answering different questions. Always check which one a page means.
- Ten widely quoted claims failed verification and are listed with the reason, including the 22-person committee, the 57-to-70% journey rule and the $50,000 remote-purchase threshold.
What a B2B buyer behaviour statistic actually measures
A buyer behaviour statistic is a measurement of a specific population answering a specific question about a specific purchase, inside a specific time window. Strip any of those away and the number stops meaning anything, even though it still reads fine in a sentence.
Most of the disagreement between published figures is not disagreement at all. It is three separate kinds of evidence being quoted as though they were interchangeable.
| Evidence type | What it records | Strongest for | Main weakness | The unsafe leap |
|---|---|---|---|---|
| Reported preference | What a respondent says they want | Experience design, positioning | Stated preference often diverges from action | Treating a preference as a description of what happened |
| Recalled behaviour | What a respondent remembers doing | Sequence, roles, decision context | Recall error, and only completed purchases get remembered | Treating a recollection as a timestamped record |
| Observed platform behaviour | A logged action on one vendor’s platform | Timing, duration, sharing, actual use | Describes that platform’s users, not the market | Treating a platform event as a representative buyer |
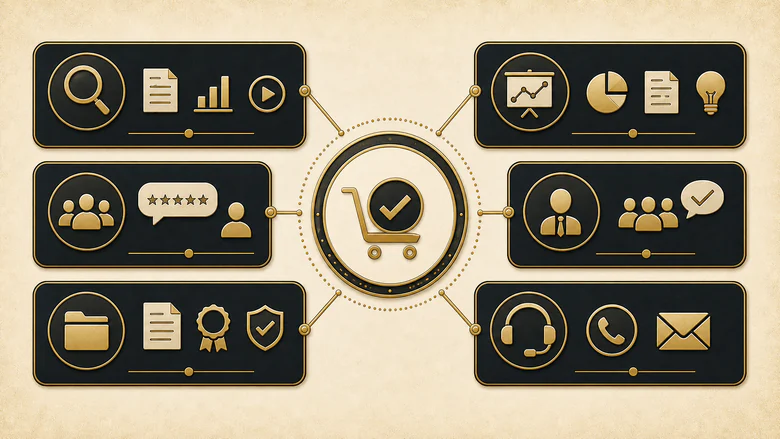
Gartner’s 67% rep-free figure is a preference. 6sense’s 61% first-contact figure is a recollection. Consensus’s five-minute demo view is an observation. Averaging them, or citing one to argue against another, produces a sentence that no underlying study supports.
The words that do the most damage
Four words carry more weight in this literature than they can hold. Buyer may mean the person who chose, influenced, approved or simply used a product, and the studies rarely agree. Journey is defined by each survey’s own question, not by a shared model, which is why journey percentages cannot be compared across studies. A useful check is whether the figure fits the stage model on our breakdown of how B2B buying journeys are actually structured, because a number quoted against the wrong stage boundary is already wrong before anyone repeats it.
Participant is not the same as decision-maker, which is why influence-network counts get misread as committee sizes. And trusted is almost never what was measured. TrustRadius asked whether buyers consulted reviews, not whether they trusted them. Those are different questions with different answers.
IMPORTANT
Two figures can only be compared when the construct, population, geography, numerator, denominator, start and end events, collection channel and inclusion rules all match. If any one of those differs, the figures can sit side by side as a contrast. They cannot be averaged, and neither one corrects the other.
The 2026 B2B buyer behaviour evidence map
The evidence map lists each verified claim with the population it describes and the date it was collected. Thirty of the 50 claims appear below, organised by buying stage. The full set, including the ten exclusions and every denominator, sits in the downloadable ledger.
| Stage | Finding | Who was measured, and when | Type |
|---|---|---|---|
| Pre-market familiarity | 79% had heard of the tool they bought before they started researching | 1,862 technology buyers, TrustRadius, fieldwork January 2026 | Recalled |
| Pre-market familiarity | Rises to 89% among enterprise buyers | 2,058 technology buyers, TrustRadius, fieldwork January 2025 | Recalled |
| Research | 51% start research with an AI chatbot more often than with Google | 1,076 software decision-makers, G2, fieldwork March 2026 | Reported use |
| Research | 71% used AI chatbots somewhere in the research process | 1,076 software decision-makers, G2, fieldwork March 2026 | Reported use |
| Research | 80% still used Google somewhere in the journey | 1,076 software decision-makers, G2, fieldwork March 2026 | Reported use |
| Research | 94% used large language models somewhere in the purchase | Nearly 4,000 buyers of purchases over US$25,000, 6sense, 2025 | Reported use |
| Research | 45% used AI during a recent purchase | 646 B2B buyers, Gartner, fieldwork Aug to Sep 2025 | Reported use |
| Research | 72% encountered Google’s AI Overviews | 2,058 technology buyers, TrustRadius, fieldwork January 2025 | Reported exposure |
| Research | 90% click through the sources cited in AI Overviews | 2,058 technology buyers, TrustRadius, fieldwork January 2025 | Reported behaviour |
| Vendor set | 5.1 vendors evaluated on average, with prior experience of about 3.8 | Nearly 4,000 buyers of purchases over US$25,000, 6sense, 2025 | Recalled |
| Vendor set | 83% shortlisted three or fewer products; mean 2.7, rising to 3.2 for high-value buys | 1,862 technology buyers, TrustRadius, fieldwork January 2026 | Recalled |
| Vendor set | 95% of the time the winner was already on the Day One shortlist | Nearly 4,000 buyers of purchases over US$25,000, 6sense, 2025 | Recalled |
| Vendor set | 94% of buying groups ranked that shortlist before contacting any seller | Nearly 4,000 buyers of purchases over US$25,000, 6sense, 2025 | Recalled |
| Vendor set | The vendor ranked first won roughly four out of five deals | Nearly 4,000 buyers of purchases over US$25,000, 6sense, 2025 | Recalled |
| Vendor set | 33% bought from a vendor they had never previously heard of | 1,076 software decision-makers, G2, fieldwork March 2026 | Recalled |
| Trust and validation | 74% consulted user reviews during the process | 1,862 technology buyers, TrustRadius, fieldwork January 2026 | Reported use |
| Trust and validation | 54% spoke with a current user; only 23% used a vendor-supplied reference | 2,058 technology buyers, TrustRadius, fieldwork January 2025 | Recalled |
| Trust and validation | 94% fact-check AI output at least some of the time; 72% very often or always | 1,862 technology buyers, TrustRadius, fieldwork January 2026 | Reported behaviour |
| Trust and validation | More than 60% purchased some form of trial | Nearly 18,000 business buyers, Forrester, published January 2026 | Recalled |
| Trust and validation | 69% found inconsistencies between the supplier’s website and its sellers | 632 B2B buyers, Gartner, fieldwork Aug to Sep 2024 | Reported perception |
| Trust and validation | “I feel safe signing a contract with them” ranked first for a third year | 6,107 decision-maker interviews across 21 markets, dentsu, 2025 | Index ranking |
| Seller interaction | First seller contact placed at 61% of the survey-defined journey, from 69% | Nearly 4,000 buyers of purchases over US$25,000, 6sense, 2025 | Recalled |
| Seller interaction | 62% do not want to talk to sales until evaluation or decision, up 17 points | 1,169 software decision-makers, G2, fieldwork April 2025 | Preference |
| Seller interaction | 67% preferred an overall rep-free experience, from 61% the prior wave | 646 B2B buyers, Gartner, fieldwork Aug to Sep 2025 | Preference |
| Seller interaction | 69% turn to sales reps to validate AI-generated insights before acting | 645 B2B buyers, Gartner, fieldwork Aug to Sep 2025 | Reported behaviour |
| Buying group | 13 internal stakeholders and nine external participants influence decisions | Nearly 18,000 business buyers, Forrester, published January 2026 | Reported structure |
| Channels | 10.2 channels used across the journey, up from five in 2016 | Nearly 4,000 decision-makers in 13 countries, McKinsey, fieldwork April 2024 | Reported use |
| Channels | 39% willing to spend over US$500,000 per order remotely, up from 28% | Nearly 4,000 decision-makers in 13 countries, McKinsey, fieldwork April 2024 | Reported willingness |
| Content attention | 47.7 hours between requesting gated content and opening it, up 23.9% | 7.2m registration events on the NetLine platform, calendar 2025 | Observed |
| Product attention | Average demo view 5 minutes 14 seconds; 45% of views within 60 minutes | 6m+ interactions on the Consensus platform, 2024 to Q4 2025 | Observed |
The full ledger carries all 50 verified claims and the ten exclusions, each with its numerator, denominator, geography, product scope, transparency score, known limitation and the exact wording we consider safe to publish. Both files are versioned and dated.
IVRIS did not run any of these studies, and the publishers retain ownership of their research. What we contribute is the classification, the compatibility testing, the transparency scoring and the exclusions. Quote the original when you quote a figure. Quote this page when you quote the comparison.
How B2B buyers research now
B2B research in 2026 runs through AI and search at the same time, not through one at the expense of the other. The single most repeated error in this category is reading AI adoption figures as search replacement figures.
G2’s March 2026 survey of 1,076 software decision-makers found 51% start research with an AI chatbot more often than with Google, 71% use chatbots somewhere in the process, and 80% still use Google somewhere. Those three figures come from the same sample. Any page quoting the first without the third is describing a market that the study did not find.
6sense puts LLM use at 94% across a broader, cross-category population of purchases above US$25,000. Gartner’s 646 buyers put AI use in a recent purchase at 45%. Both are correct. They ask different questions of different people over different recall windows, so the gap between 94% and 45% is a measurement gap, not a contradiction. The mechanics of how buyers actually run those sessions are covered in our work on what changes when buyers research with AI instead of a search box.
More AI means more verification, not less
The verification data is the part most trend pieces skip. TrustRadius’s January 2026 fieldwork found 94% of technology buyers fact-check AI output at least some of the time, with 72% doing it very often or always. That qualifier matters: a page quoting a flat “94% fact-check AI” is overstating a finding that was deliberately graduated.
Gartner reaches the same place from a different direction. Its May 2026 release reports that 69% of buyers take AI-generated insights to a sales rep to validate them, with more than half saying they had received misleading information from AI tools during research. Our news desk covered why that survey undercuts the agentic-buying forecasts when it landed.
Read together, these figures describe a buying process where AI expands the top of the funnel and simultaneously raises the evidence burden on whoever is being recommended.
How shortlists form, and how narrow they are
A B2B shortlist is small, it forms early, and it is usually populated from vendors the buyer already knew. Three independent studies converge here, which is rare enough in this literature to be worth stating plainly.
TrustRadius’s January 2026 survey of 1,862 technology buyers found 83% shortlisted three or fewer products, at a mean of 2.7 and 3.2 for high-value purchases. 6sense’s 2025 report found the eventual winner was already on the Day One shortlist 95% of the time, that 94% of groups ranked that list before contacting anyone, and that the vendor ranked first went on to win roughly four out of five deals.
Prior familiarity explains a lot of that. 79% of TrustRadius’s 2026 buyers had heard of the tool they bought before research started, rising to 89% for enterprise buyers in the 2025 wave. Active research is often a narrowing exercise applied to a set that memory supplied, which is the case for treating pre-intent brand presence as an account-experience problem rather than a demand-generation one.
PRO TIP
Do not compare 6sense’s 5.1 vendors with TrustRadius’s 2.7. One counts vendors evaluated, the other counts products shortlisted, across different populations and price bands. Quoting them as a decline is one of the most common errors in this category.
There is a counterweight. G2 found 33% of software buyers purchased from a vendor they had never previously heard of. Familiarity dominates, but the door is not shut, and AI-assisted discovery is the most plausible current reason it stays open.
What buyers do to reduce risk
Risk reduction, not information gathering, is what most of the middle of a B2B purchase is for. The evidence separates cleanly into four mechanisms, and they are not substitutes for one another.
Peer evidence. TrustRadius’s 2025 wave of 2,058 buyers found 54% spoke with a current user before purchasing, against just 23% who used a vendor-supplied reference. Vendors in the same study estimated the peer figure at 38%, so sellers systematically underestimate how much independent checking happens. Reviews. 74% consulted user reviews. The study measured consultation, not trust, and the difference is not pedantic.
Product experience. Forrester’s State of Business Buying, 2026, built on nearly 18,000 buyers, reports more than 60% purchased some form of trial. Contract confidence. In dentsu’s Superpowers Index 2025, drawn from 6,107 interviews across 21 markets, “I feel safe signing a contract with them” was the top-ranked decision driver for the third consecutive year.
Consistency is the connective tissue. Gartner’s survey of 632 buyers found 69% hit inconsistencies between what a supplier’s website said and what its sellers said, and 73% actively avoid suppliers that send irrelevant outreach. When a buyer is cross-checking an AI answer against a review against a website against a rep, every contradiction is a cost. The gap between what vendors think buyers trust and what buyers say they trust shows up in survey after survey.
That verification chain is also why AI citation has become a trust question rather than a traffic question. TrustRadius found 72% of buyers encountered AI Overviews and 90% said they click the sources cited in them, so being the cited source is now part of the evidence trail. We keep the platform-level numbers behind that in a separate ledger of B2B AI search citation statistics, because those figures expire far faster than the ones on this page.
When buyers actually talk to sales
There is no defensible universal answer to how much of a B2B purchase happens before sales contact. The four figures usually offered for it measure four different things, and only one of them is a timing measure at all.
| Figure | What it actually measures | What it is not | Source and base |
|---|---|---|---|
| 61% | Respondent-estimated position of first seller contact within a journey the survey itself defined | Not a share of time, and not comparable to any other study’s journey | 6sense, 2025, nearly 4,000 buyers of purchases above US$25,000 |
| 62% | Preference to delay seller contact until the evaluation or decision stage | Not an elapsed share, and software buying only | G2, fieldwork April 2025, 1,169 software decision-makers |
| 67% | Preference for an overall rep-free buying experience | Not evidence that no seller was involved | Gartner, fieldwork Aug to Sep 2025, 646 B2B buyers |
| 17% | Share of total buying-task time spent meeting all potential suppliers | Not chronology, so it does not imply 83% happens before contact | Historical Gartner and CEB research; original instrument not publicly retrievable |
| Rule of thirds | Roughly equal preference for in-person, remote and self-service at each stage | Not a seller-contact clock | McKinsey B2B Pulse, fieldwork April 2024, nearly 4,000 decision-makers |
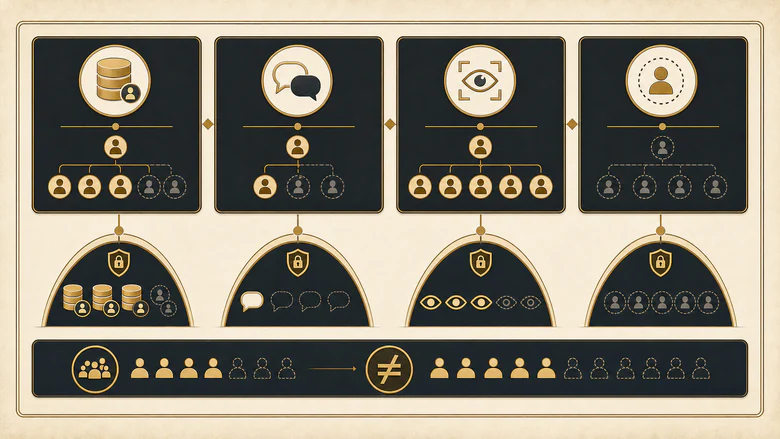
The two preference figures deserve a closer look, because they point in opposite directions. Gartner’s 67% is a wish for the whole experience to be rep-free. G2’s 62% of software buyers is narrower: they want to defer the rep until evaluation or decision, which assumes a rep eventually shows up.
Put the constructs side by side and the apparent conflict dissolves. Buyers form preferences early, initiate contact themselves, compress the seller’s involvement, and still want a human for fit, risk and commercial questions. That is selective human interaction, not a sellerless journey.
The operational consequence is about readiness rather than speed alone. If 94% of groups arrive with a ranked list, a first conversation that opens with discovery is starting three steps behind. It should be diagnostic, and it should happen fast, because the response-time evidence is unusually consistent about what delay costs once a buyer has actually raised a hand.
What sellers do inside that compressed window is a separate discipline from measuring it, and we keep the tactics on our guide to running a deal across a group that has already made up most of its mind.
Why three different studies all report 69%
Three separate findings in this evidence set land on 69%, and they answer three unrelated questions. This is the clearest available demonstration of why a percentage without a question attached is not information.
- 69% report inconsistencies between a supplier’s website and its sellers. Gartner, 632 buyers, fieldwork August to September 2024.
- 69% turn to sales reps to validate AI-generated insights before acting on them. Gartner, 645 buyers, fieldwork August to September 2025.
- 69% chose a different vendor than expected because of AI chatbot guidance. G2, 1,076 software decision-makers, fieldwork March 2026.
Two of those come from the same research programme one year apart. The third comes from a different firm surveying a different population about a different product category. A page that writes “69% of B2B buyers” without saying which is not quoting research, it is quoting a coincidence.
The Gartner pair carries a second lesson. Its rep-free release reports a base of 646 buyers and its AI-validation release reports 645, both fielded August to September 2025. Same wave, different question bases. Precision at that level is a good sign in a publisher, and it is exactly the detail that gets rounded away by the time a figure reaches its fourth citation.
Content and product attention run on different clocks
A registration event and an attention event are different units, and the two observed datasets in this set prove it by disagreeing on timing by three orders of magnitude.
NetLine’s platform data puts the gap between requesting gated content and actually opening it at 47.7 hours across calendar 2025, up 23.9% year on year, against 7.2 million registration events. Consensus, observing demo activity from 2024 through Q4 2025, found 45% of demo views happen within the first 60 minutes and that the average view lasts 5 minutes 14 seconds.

Two days for an eBook. One hour for a demo. Same buyer, different intent, and a single follow-up rule applied across both will be wrong for at least one of them. Both datasets describe platform events rather than people, which is the same distinction that separates a declared signal from an observed one in how intent data is actually generated and where it misleads.
Consensus also reports that demoboards shared with seven or more stakeholders are tied to opportunities 36% of the time, against 19% for demoboards shared with nobody. That is an association with opportunity status, and it is frequently repeated as a doubled win rate. It is neither a win rate nor evidence of causation, since larger deals plausibly drive both the wider sharing and the opportunity.
Enterprise and SMB buyers are not one benchmark
Company size and deal value change the evidence path enough that a blended “average B2B buyer” hides the thing most readers came for. Four of the studies here publish size or value cuts, and every one of them moves.
Prior familiarity rises from 79% of all buyers to 89% of enterprise buyers. Shortlists widen from a mean of 2.7 to 3.2 once the purchase is high value. Trial use rises with deal size in Forrester’s data. And the two largest samples on this page do not even overlap in scope: 48% of TrustRadius’s purchases were under US$10,000, while 6sense required a US$25,000 floor and reported a median between US$200,000 and US$300,000.
That last point is worth sitting with. Those two studies describe almost entirely different purchases, and quoting a TrustRadius shortlist figure next to a 6sense journey figure implies a single market that neither one sampled. Group structure moves with size too, which we handle separately in our comparison of what each buying group study actually counted.
Forrester’s 13 internal stakeholders and nine external participants describe an influence network rather than an approval body, and the distinction changes what the number is good for. Participation carries no decision authority, which is why the roles inside a buying committee matter more than its headcount when you are deciding who needs which proof.
McKinsey’s B2B Pulse shows the same spread at the transaction end: 39% of decision-makers are willing to spend over US$500,000 per order through remote or self-service channels, up from 28%, and 20% would go above US$1 million. Those are stated willingness figures rather than completed transactions, and they supersede the US$50,000 threshold still circulating from the 2020 to 2021 research era.
Ten statistics we will not repeat
Excluding a claim is an editorial decision that deserves to be published rather than hidden. Each of these fails on construct, provenance or currency, and several are still ranking on page one.
| Claim | Why it fails | Use instead |
|---|---|---|
| Buyers complete 57% to 70% of the journey before contacting sales | Traces to a 2015-era CEB study and a separate Forrester figure measuring different things. Neither is current | A named current measure, with the study’s own journey definition attached |
| 17% of time with suppliers means 83% happens before contact | Time allocation across a whole purchase is not chronology | The 17% with its own definition, or 6sense’s 61% for a timing measure |
| The average buying committee has 22 decision-makers | Adds Forrester’s 13 internal stakeholders to its nine external participants. Participation is not decision authority | The two components reported separately |
| 86% or 91% of B2B purchases stall | Two public Forrester summaries give different values and the construct is not publicly defined | Nothing, until the metric is defined or the full report is retrievable |
| Seven demo shares doubles your win rate | Consensus reports an association with opportunity status, not a win rate, and not causally | 36% against 19%, described as an association |
| Nine or more demos means a 55% close rate, an 8 to 10 times increase | Platform association written in causal language; deal size plausibly drives both | Nothing at this framing |
| 87% of buyers want to self-serve part or all of the journey | Circulates undated, with no retrievable base or question wording | Gartner’s 67% rep-free preference, with its base and field dates |
| 70% are open to remote purchases over US$50,000 | A 2020 to 2021 era figure quoted as current; the threshold and the base have both moved | McKinsey’s 39% above US$500,000 and 20% above US$1 million |
| 78% of buyers above US$10 million used a trial | Not present in Forrester’s public 2026 release | More than 60% purchased some form of trial |
| AI has replaced Google in B2B research | Contradicted inside the same G2 sample, where 80% still use Google somewhere | 51% AI-first and 80% still using Google, quoted together |
The first two are the ones that matter most, because they are the load-bearing claims in a decade of B2B content strategy. Neither survives being traced.
How we scored and verified this evidence
Every figure on this page was re-checked against the publisher’s own release on 24 July 2026, not against a secondary summary. Where a publisher blocked automated access, verification ran through the same release as indexed elsewhere, and that is recorded in the ledger.
Each source family carries a transparency score out of six, with one point each for a disclosed sample, population, data period, metric definition, methodology and an accessible primary source. The score measures public disclosure. It says nothing about whether a study is true, prestigious or representative, and a commercially sponsored study can score six.
T = Sample + Population + Data period + Metric definition + Methodology + Accessible sourceWhat the source pool looks like
Thirteen source families cleared selection. Ten are surveys of what people report, and three are observed platform datasets, so roughly 77% of the public evidence in this category records what buyers say rather than what they did. Every one of the thirteen discloses a sample size. Nine disclose an exact fieldwork window, which is the weakest disclosure field and the reason annual trend claims in this category should be treated carefully.
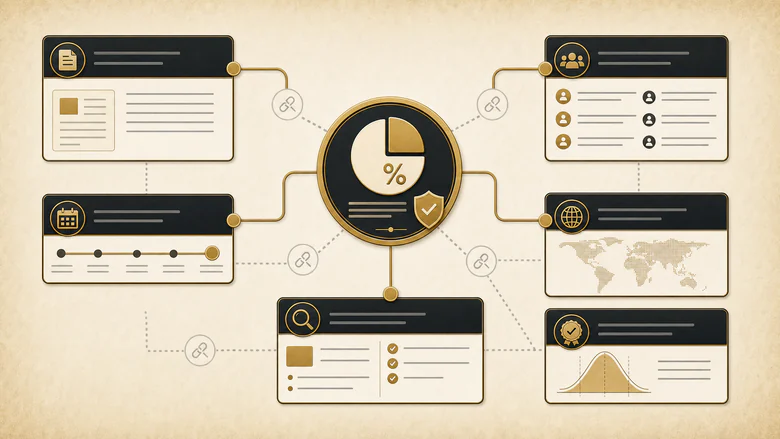
Status follows a fixed rule. Current means published within 18 months and scoring five or six. Monitor means older than 18 months or scoring below five. Historical means older than 36 months, and nothing marked historical is quoted as a present-tense fact on this page.
Revision history
Version 1.0, 24 July 2026. First publication. Fifty claims verified across thirteen source families, ten claims excluded with reasons recorded. Six figures were corrected against our own research brief during verification, including a first-mover-wins figure that was circulating internally as 77% and is actually reported by 6sense as roughly four out of five, and a Consensus observation window that turned out to be published after all.
Review cadence is quarterly, with an immediate review whenever an original publisher corrects a figure, a source becomes inaccessible, or one of the annual programmes here changes its sample or questionnaire.
Suggested citation: IVRIS, B2B Buyer Behaviour Statistics 2026, public-evidence ledger v1.0, updated 24 July 2026.
Frequently Asked Questions
There is no defensible universal figure. 6sense’s 2025 respondents placed first seller contact at 61% of a journey that survey defined itself. Gartner’s 67% is a preference for a rep-free experience, not a timing measure. The historical 17% is a share of total buying time. Each answers a different question.
Both, by task. Gartner found 67% prefer an overall rep-free experience, while G2 found 62% simply want to defer sales until evaluation or decision. Gartner separately found 69% take AI-generated insights to a rep for validation. Self-service is a mode buyers select by stage and risk, not a fixed persona.
TrustRadius found 83% of technology buyers shortlist three or fewer products, at a mean of 2.7, rising to 3.2 for high-value purchases. 6sense reports 5.1 vendors evaluated, but that counts an evaluation set rather than a shortlist, so the two figures should never be compared directly.
Alongside search, not instead of it. In G2’s March 2026 sample, 51% start with an AI chatbot more often than Google while 80% still use Google somewhere. Verification rises with adoption: 94% of TrustRadius buyers fact-check AI output at least some of the time, and 72% do so very often or always.
Surveys record what a respondent says or remembers, and the unit is a person. Observed platform data records a logged action, and the unit is an event. Surveys explain why something happened but suffer recall bias. Platform data proves an action happened but only describes that platform’s users.





