

Search for how many people sit in a B2B buying group and you’ll get four confident answers: 4.8, about 10, 13 plus nine more, and somewhere between five and 16. All four are published. All four come from real research. None of them are measuring the same thing.
That’s the actual problem with B2B buying group statistics. There’s no shortage of numbers. What’s missing is any page that tells you which number belongs in your sentence, and which ones fall apart when you trace them back to the source.
So we traced all of them. This page reports what each study counted, scores how auditable it is, and follows the most-quoted figures back to the documents they came from. Two of the numbers currently sitting at the top of Google’s results don’t say what the pages quoting them say they say.
Direct answer — How many people are in a B2B buying group?
There is no single defensible average. Published estimates range from 4.8 people in TrustRadius’s technology survey to 13 internal stakeholders plus nine external influencers in Forrester’s 2026 research, with Gartner reporting a five-to-16 range. The figures differ because each study surveyed a different population, used a different rule for who counts as a member, and reported a different kind of statistic. Choose the figure whose purchase context matches yours, and quote it with that scope attached.
Key Takeaways
- Published buying group sizes span 4.8 to 17 people. The spread is not disagreement between researchers, it is six different measurement frames being quoted as if they were one.
- Forrester’s January 2026 release reports 13 internal stakeholders and nine external influencers per decision. These are two separate counts and should never be added into a single committee size.
- None of the six size studies we reviewed publishes an operational rule for who counts as a member, which is why the headcounts move so much.
- The widely repeated “19 external stakeholders on deals over $250,000” traces to a 2020 vendor product-launch quote with no published method, and it was never a buying group measurement.
- CRM contact counts are a floor, not a measure. Edelman and LinkedIn found 71% of hidden buyers have little or no contact with sales.
- Group size correlates with cycle length, but no public study demonstrates that it causes it. Use association language.
The published buying group numbers, side by side
Six studies report a size figure. Below is each one with the population it surveyed, the boundary it used, and the kind of statistic it produced. The right-hand column answers the only question that matters when you’re deciding whether two numbers can be combined.
| Source | Published figure | Population and purchase frame | Sample | Statistic type | Who was counted | Pool with others? |
|---|---|---|---|---|---|---|
| TrustRadius, Jan 2025 | 4.8 average; 79% five or fewer | Software and hardware buyers from a product-review network | 2,058 buyers | Mean plus distribution | Whatever the respondent called their buying group | No |
| 6sense, 2025 | 10+ people | Minimum $25,000 spend; median purchase $200,000–$300,000 | ~4,000 responses | Approximate mean | Not explicitly bounded in the public report | No |
| Forrester, Jan 2026 | 13 internal + 9 external | Broad global business buying, all categories | ~18,000 buyers | Two means, reported separately | Internal and external counted apart | No |
| Gartner, 2024 fieldwork | Five to 16, up to four functions | Scope not disclosed publicly | 632 buyers | Range, from an analyst quote | “Buyer team”, not defined | No |
| Demandbase, 2026 | 13–17 stakeholders | Demandbase customer accounts, ~1 year of data | Not disclosed | Modelled range | Platform-modelled group | No |
| Dreamdata, Mar 2026 | 10 observed (up from 6.8) | Dreamdata customer accounts | 3.5M+ journeys | Observed mean | Only people visible in tracking data | No |
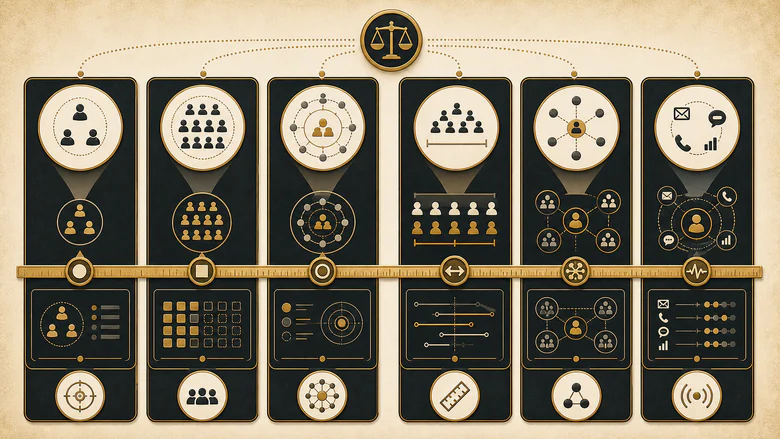
Read down the “who was counted” column and the contradiction mostly dissolves. Forrester’s 13 covers everyone inside the organisation who shapes the decision. TrustRadius’s 4.8 is whoever the respondent thought of as their group, in a sample of software and hardware purchases where enterprise deals are a separately reported subset. Those are different objects, and the gap between them is a definition, not an error.
IMPORTANT
No two of these point estimates match on purchase category, value band, geography, membership boundary and statistic type at once. That means a pooled average or median across them is not calculable. Any page publishing a single cross-study “typical” figure has invented it.
Why the published numbers disagree
Five things move a buying group headcount, and every one of them varies across the studies above.
Purchase value. 6sense required a minimum $25,000 spend and reports a median purchase cost between $200,000 and $300,000. TrustRadius surveyed software and hardware buyers from a review network, treating enterprise purchases of $100,000 a year or more as a distinct subgroup. More money invites more scrutiny, so a lower-value sample produces a smaller group.
Who’s allowed in the count. This is the big one. Forrester separates internal stakeholders from external influencers and publishes both. Gartner’s figure covers a “buyer team” it never operationally defines. TrustRadius lets the respondent decide. When the inclusion rule changes, the number changes, and the study is still correct.
The type of statistic. Gartner published a range. TrustRadius published a mean and a distribution. Forrester published two means. A range cannot be averaged with a mean, and a five-to-16 span does not have a midpoint of 10.5 that anyone measured.
Who was asked. Survey respondents recall their group. Attribution platforms observe whoever their tracking can see. Those two methods answer different questions, and the second one is bounded by tooling rather than by the decision itself.
How many vendors were evaluated. 6sense reports group size as strongly related to the number of vendors a buyer considers. Evaluation breadth, not deal value alone, is what pulls more people into the room.
Where the most-quoted numbers actually came from
Some widely circulated figures survive a trace back to source. Others change meaning along the way. We followed four of the most repeated claims to their original documents.
| The claim as you’ll meet it | What the original says | Original source and date | What changed | Verdict |
|---|---|---|---|---|
| Enterprise deals over $250K involve an average of 19 external and internal stakeholders | “Deals over $250k require an average of 19 external stakeholders to close successfully” — a CEO quote in a product-launch release, attributed only to “our data”, with no sample, field period or definition. Context indicates contacts at the buying organisation that the seller has relationships with. | Clari, Relationship Insights press release, 3 December 2020 | Restated inside a buying-group size list, so “external” began reading as external to the buyer. It later became “external and internal stakeholders”, now a headcount. | Don’t use as a group size |
| There are 27 engagements with seller-related content across a buying group | “B2B buyers engage in an average of 27 interactions over the course of a buying journey (up 93% since 2015).” Interactions across a whole journey include research the seller never touches. | Forrester blog, 11 March 2022 | Two shifts. The unit narrowed from all buying interactions to engagements with seller content, and the frame moved from one buyer’s journey to a whole buying group. | Use the original unit |
| The typical decision has 13 internal plus nine external influencers | “The typical buying decision now includes 13 internal stakeholders and nine external influencers, with that number rising for more complex or strategic purchases.” | Forrester, The State Of Business Buying, 2026, published 21 January 2026 | Nothing. This one is accurate and traceable. The common mistake is adding the two into a committee of 22. | Safe to cite, never sum |
| Gartner says the average buying group is six to 10 people | The figure appears on a Gartner insights page with no published sample, field period or survey reference. Gartner’s dated survey release instead describes five to 16 people across up to four functions. | Gartner, B2B buying journey insights page, undated | No mutation, but no methodology either. The undated figure and the dated range get used interchangeably. | Prefer the dated range |
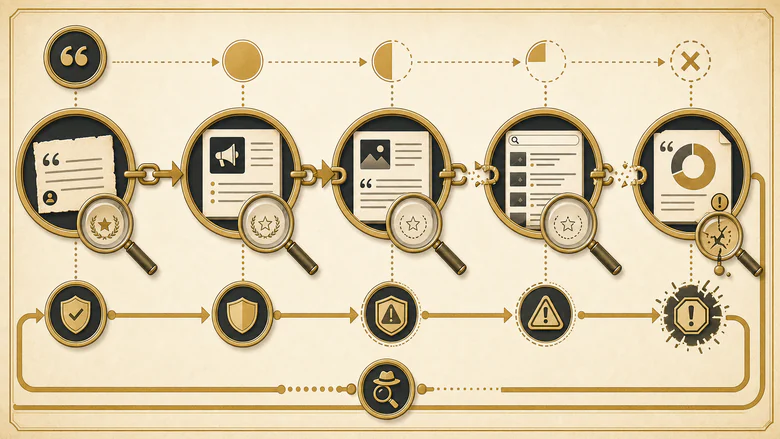
The Clari chain is worth sitting with, because it shows how a number ages badly without anyone lying. A 2020 sales-software launch said its data showed 19 external stakeholders on large deals, meaning buyer-side contacts a seller needs relationships with. Quoted inside a list of buying group statistics, that sentence quietly became a description of the buying group itself. It’s now nearly six years old, has never had a published method, and the word “external” has flipped meaning.
The number is not the claim. The counting rule is the claim, and most pages drop it.
Which buying group statistics are safe to quote
These figures survive a source check. Each one is written the way we’d recommend quoting it, with the scope that has to travel alongside it.
| Statistic | Recommended wording | Scope that must stay attached |
|---|---|---|
| Group size, technology | TrustRadius’s January 2025 survey of 2,058 technology buyers found an average buying group of 4.8 people, with 79% reporting five or fewer. | Software and hardware only; review-network panel; group defined by the respondent |
| Group size, high value | 6sense reports typical purchases involving more than 10 people. | Minimum $25,000 spend; median purchase $200,000–$300,000 |
| Internal and external | Forrester’s January 2026 release reports 13 internal stakeholders and nine external influencers on a typical buying decision. | Two separate counts; full methodology is not public |
| Team range | Gartner’s survey of 632 buyers describes buying groups ranging from five to 16 people across as many as four functions. | A range, not a mean; August–September 2024 fieldwork |
| Conflict | Gartner found unhealthy conflict in 74% of buyer teams, and that groups reaching consensus were 2.5 times more likely to call the deal high quality. | Gartner’s specific definition of unhealthy conflict |
| Executive involvement | TrustRadius reports VP- or C-level involvement in 66% of technology purchase decisions. | Involvement, not final authority |
| Procurement | Forrester reports procurement acting as a decision-maker in 53% of business buying cycles. | Decision-maker status, not mere presence |
| Hidden participants | Edelman and LinkedIn found 71% of hidden buyers report little or no interaction with sales teams. | Hidden buyers are internal colleagues in finance, legal, compliance, procurement or operations |
| Group benefit | Forrester reports 94% of buyers in groups of six or more saying the larger group delivers clear benefits. | Denominator is the six-or-more subgroup only |
| AI research | 6sense reports 94% of buyers using large language models, while Gartner reports 45% using AI during a recent purchase. | Different questions and samples; not a contradiction |
What the research says about who is in the group
The studies agree more about composition than about headcount. Forrester puts procurement in a decision-making role in 53% of buying cycles, engaging from the start of the process, which is a stronger claim than the usual “procurement gets involved late.” Gartner counts up to four functions on a single buyer team.
The most useful finding on composition comes from Edelman and LinkedIn, who define hidden buyers as unseen stakeholders in finance, legal, compliance, procurement or operations. That definition matters for a reason people often miss: hidden buyers are internal. They’re colleagues, not outside consultants. And 71% of them report little or no interaction with sales, which means your CRM has no record of the people who can stall the deal.
For the full anatomy of each role and how the group assembles, our guide to the B2B buying committee covers the roles one at a time. This page stays on the evidence rather than repeating the role map.
Consensus, conflict, and the cost of a divided group
Gartner’s 2024 fieldwork, a survey of 632 B2B buyers, found unhealthy conflict in 74% of buyer teams, where unhealthy conflict means members hold conflicting objectives, disagree on the right course of action, or get overruled by external decision-makers. Groups that reached consensus were 2.5 times more likely to report a high-quality deal.
The content finding attached to that survey is the one worth acting on. Tailoring for buying group relevance improved consensus by 20%, while content tailored to individual relevance had a 59% negative impact on consensus. Arming one champion with material that speaks only to their priorities can make the group harder to align, not easier.
PRO TIP
If you’re building content for a multi-threaded deal, write at least one asset addressed to the group’s shared decision rather than to any single role. Gartner’s data suggests role-specific content alone works against consensus.
Turning that into a working motion is a different job, covered in our guide to selling to B2B buying committees.
How buying groups research now: AI, self-service, and validation
The headline numbers here look contradictory until you check which task each one describes, and which year each was measured in. Gartner reports 67% of buyers preferring a rep-free experience, from August–September 2025 fieldwork. Its release a year earlier, drawing on August–September 2024 fieldwork, put the same preference at 61% and found buyers wanting to complete an average of 3.0 activities using both digital self-service and supplier reps, against 2.3 with reps alone and 1.8 through self-service alone.
Read together, that’s not a rejection of salespeople. It’s a preference for self-service on general information and human help on judgment. Note that the activity counts come from the earlier fieldwork year, so they sit alongside the 61% rather than the 67%. The preference itself is rising rather than reversing.
On AI, 6sense reports 94% of buyers using large language models while still averaging 16 interactions per person with the winning vendor. TrustRadius found 72% of technology buyers encountering Google’s AI Overviews, and 90% of those surveyed saying they click the cited sources to fact-check them. AI has changed where the research starts, not whether buyers verify it.
Anonymous research is the practical consequence. If most of the group is reading before anyone fills in a form, your visible pipeline is trailing the real one, which is the case for treating B2B intent data as a coverage signal rather than a lead source.
What group size does and doesn’t predict
6sense reports group size as the strongest measured correlate of buying cycle length, explaining close to a quarter of the variation. That is an association in one dataset, not proof that adding people slows a deal. The same report notes average cycle length falling from 11.3 months in 2024 to 10.1 months in 2025, and warns that changes in sample mix explain part of that movement. There is a second layer to that caution, which is that the published cycle-length benchmarks themselves do not survive a provenance check, so the variable being correlated here is defined differently by every source that reports it.
Forrester states its data shows buying groups larger than in prior years, and reports that groups roughly double in size when the purchase includes generative AI features, at 14 members against seven. No comparable public series exists that would let anyone plot a trend line across studies, so treat growth as something Forrester reports rather than something the field has demonstrated.
One benchmark in circulation deserves a warning. Demandbase’s Labs research observes that buying groups receiving 180 to 190 coordinated touches approach 94% conversion. Deals that progress accumulate touches because they progress, so reading that as a target inverts the likely direction of causation. The same research reports win rates peaking around 29% when teams focus on three buying groups and falling to roughly 12% at six, which is a more useful finding: focus beats spread.
Both platform figures come with the same caveat, and it’s the reason account-based marketing attribution is hard: a tool can only count the people it can identify. External influencers rarely share the buyer’s email domain, so they fall outside domain-based matching entirely, and the group looks smaller than it is.
IMPORTANT
Dreamdata reports observed stakeholders rising from 6.8 to 10 per journey. That is the closest thing to a longitudinal series in this evidence base, and it measures what attribution tooling can see. Improved tracking coverage would produce the same rise with no change in buying group size.
How to use this evidence in account planning
Four things follow from the record above, and none of them require picking a universal number.
Treat your contact count as a floor. Between hidden buyers who avoid sales and research that happens before any form fill, the people you can name are a subset of the people deciding. Counting known contacts as coverage is the most common error we see in account plans.
Plan around functions, not headcount. Gartner’s up-to-four-functions finding and Forrester’s procurement figure are more actionable than any average. Ask which functions must sign off on this specific purchase, then check whether each is represented.
Separate the internal group from the external influence network. Forrester’s decision to report 13 and nine separately is the right model to copy. They need different plays: internal stakeholders need enablement, while external influencers respond to credible public evidence you don’t control.
Scale coverage to evaluation breadth. If 6sense is right that vendor count drives group size, then a deal where the buyer is comparing five vendors needs wider coverage than one where you’re the only option, at the same contract value. That thinking belongs in an account-based experience plan rather than in a lead-scoring rule.
How we scored the evidence
Every study here received a transparency score out of six, one point each for a disclosed sample, a defined population, a disclosed field period, a defined metric, available methodology, and an accessible primary source. The score measures whether you can audit the claim, not whether the research is good. A transparent vendor survey can still be commercially selected, and a strong analyst study can score low simply because its methodology sits behind a paywall.
| Study | Sample | Population | Period | Metric | Method | Primary | Score |
|---|---|---|---|---|---|---|---|
| TrustRadius 2025 | Yes | Yes | Yes | Yes | Yes | Yes | 6/6 |
| 6sense 2025 | Yes | Yes | No | Yes | Yes | Yes | 5/6 |
| Gartner 2024 fieldwork | Yes | Yes | Yes | Yes | No | Yes | 5/6 |
| Forrester 2026 | Yes | Yes | No | Yes | No | Yes | 4/6 |
| Edelman & LinkedIn 2025 | Yes | Yes | Yes | Yes | No | Yes | 5/6 |
| Dreamdata 2026 | Yes | No | No | No | No | Yes | 2/6 |
| Demandbase 2026 | No | No | Partial | No | No | Yes | 2/6 |
| Clari 2020 | No | No | No | No | No | Yes | 1/6 |
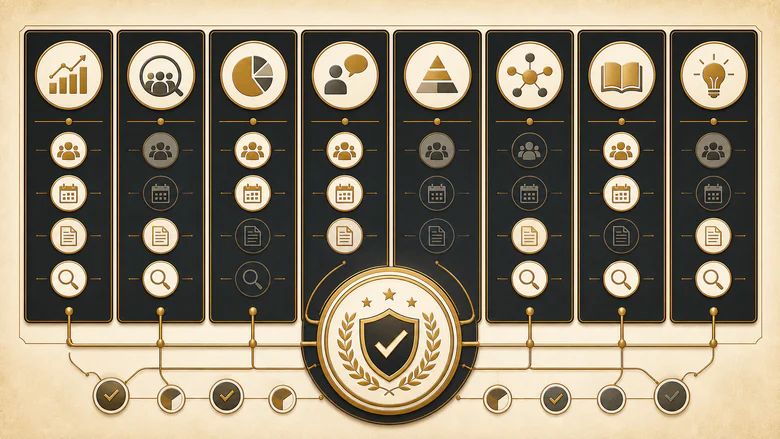
Two audit results came out of that scoring. None of the six size studies publishes an operational rule for who counts as a member, so the boundary is doing work that nobody documents. And no pair of point estimates passes all six compatibility tests, which is why this page reports a compatible-sample median as not calculable rather than averaging anyway.
Limitations. We could not verify one figure we expected to publish. The TrustRadius report includes a purchase-price distribution chart, but its labels are embedded as font glyphs rather than text, so we couldn’t extract the percentages and left them out rather than quote a number we hadn’t read. Forrester’s and Gartner’s full methodologies sit behind paywalls, so both are scored on their public releases. Vendor-run studies carry selection effects we’ve labelled but cannot correct for.
Sources and how to cite this page
The full evidence ledger is public. It carries 38 claim-level records with the exact wording, organisation, publication date, fieldwork period, sample, population, boundary, statistic type, transparency score, recommended wording and compatibility note for each, plus the size-frame comparison, the provenance chains and the claim register.
Original organisations retain ownership of their studies. IVRIS did not conduct any of the underlying research. What we contribute is the classification, the compatibility analysis, the transparency scoring and the provenance tracing. When you quote a figure, cite the original source. When you quote the comparison or the provenance finding, cite this page.
Suggested citation: IVRIS, B2B Buying Group Statistics: source ledger and evidence comparison, version 1.1, verified 24 July 2026, https://ivristech.com/b2b-buying-group-statistics/
Version 1.1 — evidence verified 24 July 2026. Every source above was checked against its original document on that date. We review this page quarterly, and immediately when a new annual study publishes from Forrester, Gartner, 6sense, TrustRadius or Edelman and LinkedIn, when an original source releases a member definition or segmented table that was previously unavailable, or when a primary URL breaks or moves behind a paywall.
Revision history. v1.1 (24 July 2026): re-verified all eleven primary sources; corrected the Edelman and LinkedIn transparency score from 3/6 to 5/6 after confirming its sample of 1,934 and its 17 March to 3 April 2025 field period are both public; separated Gartner’s self-service activity counts, which come from August–September 2024 fieldwork, from the 67% rep-free figure measured a year later; added the 14-against-seven detail to Forrester’s AI-purchase finding. v1.0 (23 July 2026): first publication.
Frequently Asked Questions
There is no defensible single average. TrustRadius reports 4.8 people among technology buyers, 6sense reports more than 10 on higher-value purchases, and Forrester reports 13 internal stakeholders plus nine external influencers. The studies surveyed different populations and used different membership rules, so averaging them produces a number nobody measured.
Mainly because they count different people. Forrester separates internal stakeholders from external influencers, Gartner describes an undefined “buyer team”, and TrustRadius lets respondents define their own group. Purchase value differs too: 6sense required a minimum $25,000 spend, while TrustRadius surveyed a broader technology-purchase panel.
Thirteen. Forrester’s January 2026 release reports 13 internal stakeholders and, counted separately, nine external influencers such as consultants and analysts. Adding them to reach 22 merges two different populations. Use 22 only when you genuinely mean everyone who touches the decision, inside and outside the company.
No. That figure comes from a December 2020 Clari product-launch press release, quoted from the CEO and attributed only to “our data” with no sample or method published. In context it described buyer-side contacts a seller needs relationships with, not people external to the buying company.
They move together, but no public study shows one causes the other. 6sense reports group size as the strongest measured correlate of cycle length in its data. Vendor count and evaluation complexity rise alongside group size, so any of them could be driving the delay.
Because much of the group never identifies itself. Edelman and LinkedIn found 71% of hidden buyers in finance, legal, compliance, procurement and operations have little or no interaction with sales. Treat known contacts as a lower bound on the decision network, never as a measure of it.





