
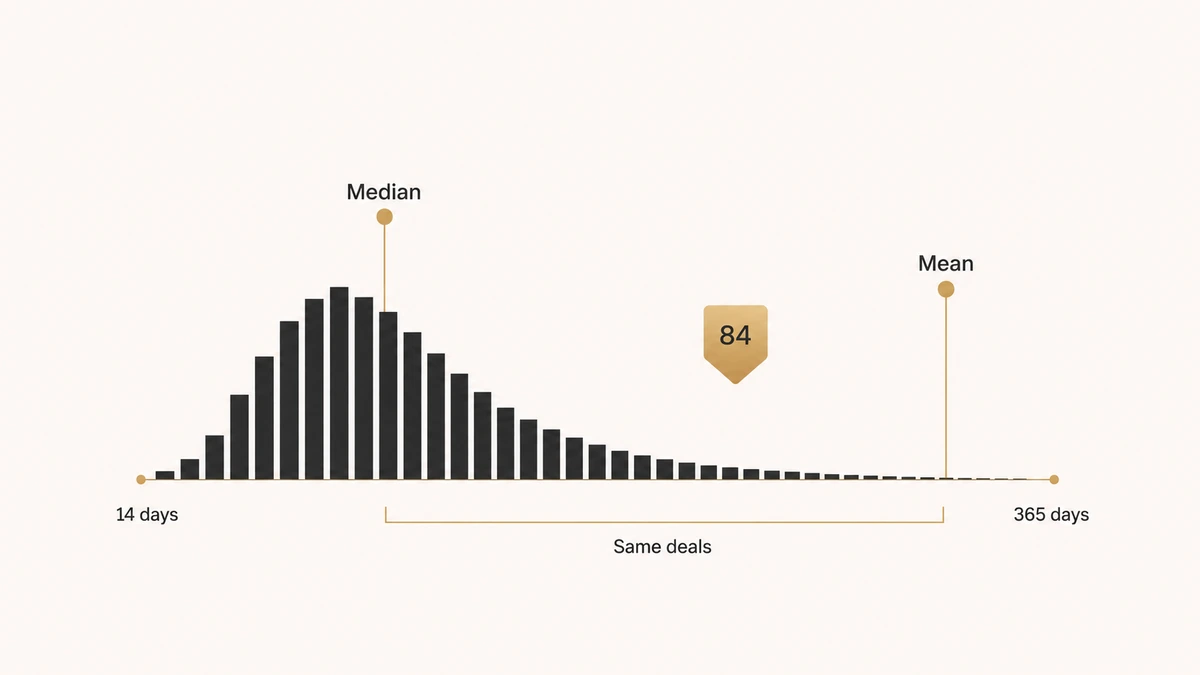
Three pages on the first page of Google will tell you the median B2B sales cycle length is 84 days. One of them is ours, and it means something completely different by it.
That is not a gotcha. It is the whole problem with this metric. The number circulates without the population attached, so a figure measured on one stage transition in 2014 sits alongside a figure measured on whole deals in 2026, and both get quoted into the same board deck as if they answered the same question.
We went looking for the study behind the 84-day benchmark. What we found instead was a citation chain that loops back on itself, a research firm that turns out to be a marketing agency, and five published benchmark tables that disagree with each other about what a $100,000 deal should take.
Direct answer — what is the average B2B sales cycle length?
Sales cycle length is the number of days between a defined start event, usually opportunity creation, and a closed-won outcome. There is no verified cross-industry benchmark. The widely quoted 84-day median traces to a single vendor study with no published methodology, and the published bands by deal size disagree with each other by 50 to 100 percent. Measure your own cohort instead.
Key Takeaways
- The “84-day median B2B sales cycle” has one identifiable origin: Optifai’s own pipeline study. No methodology page, no sample definition, no independent replication.
- Google’s AI Overview builds its entire benchmark section from a page that cites six sources and links to none of them.
- Five published band tables disagree. For a $100,000 deal they variously say 60 to 90, 90 to 180, 120 to 180, 120 to 210, and 170 days.
- Three unrelated figures all land on 84 days while measuring different populations and different stage transitions, twelve years apart.
- The “22% longer since 2022” claim is credited to a B2B marketing agency that has published no such study.
- Cycle length is only comparable inside one segment with one stated clock. Cross-company benchmarks for this metric are not currently defensible.
What sales cycle length actually measures
Sales cycle length is the elapsed time between a stated start event and a stated end event on a deal, expressed in days and aggregated across a cohort. The start is usually opportunity creation and the end is usually closed-won.
Those two words, “usually” and “stated”, carry all the weight. Move the start from opportunity creation to first qualified contact and the same deals get 20 days longer. Count won deals only and the number gets shorter, because the deals that dragged are the ones that died.
We have already published the argument for how to hold that clock still. Our breakdown of the sales velocity formula sets out which start and end pairs survive scrutiny and why measuring won deals alone is survivorship-biased. This page takes that as settled and asks the question that comes after it: once your clock is defined, what can you legitimately compare it against?
The answer, based on what is actually published, is less than the internet implies.
Where the 84-day benchmark actually comes from
The 84-day figure is the most-quoted number in this topic, so we traced it. The chain is short and it ends in a place worth knowing about.
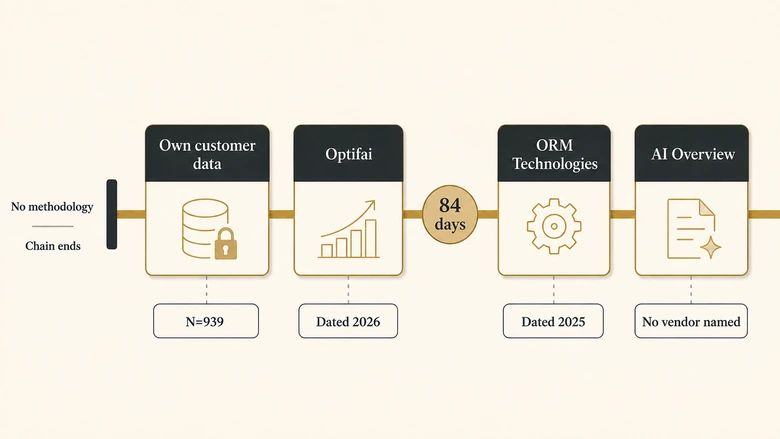
Google’s AI Overview for “sales cycle length” cites ORM Technologies three times, more than any other source, and lifts its benchmark bands more or less wholesale. ORM’s article states: “The median B2B SaaS sales cycle is 84 days (Optifai, 2025).”
Follow that to Optifai’s own page and the study is dated 2026, not 2025, and described as the “Optifai Pipeline Study, N=939 B2B SaaS companies with stage-level CRM data.” There is no methodology page, no definition of which stage transition was measured, no industry mix, and no way to see the data. Optifai is a vendor publishing its own customer base.
That is the entire provenance. One vendor’s unpublished analysis, re-dated by the page that quotes it, then absorbed into an AI Overview as settled fact with no vendor named at all.
| Claim | Credited to | What we could verify | Verdict |
|---|---|---|---|
| Median B2B SaaS cycle = 84 days | Optifai, dated 2025 by ORM and 2026 by Optifai | Vendor’s own N=939 customer data; no methodology published | Single origin, unverifiable |
| Cycles lengthened 22% since 2022 | “Digital Bloom, 2025” per ORM; claimed as its own finding by Optifai; unattributed by Focus Digital | The Digital Bloom is a B2B SaaS marketing agency. Its published 2025 research covers lead-stage marketing, GTM channels and sales messaging. No sales cycle study located | Attribution does not resolve |
| 84-day median for deals over $100K ACV | Ebsta and Pavilion, “n=9,338 sales teams” | We extracted the full 2024 B2B Sales Benchmarks report. It contains no 84, no ACV segmentation, no per-day cycle benchmark. The 2025 GTM benchmarks page carries no cycle-length-in-days figure. The phrase “9,338 sales teams” appears in neither | Could not verify in the cited source |
| Mean B2B cycle = 134 days | Stated without citation by ziellab.com | No source located. 134 days does appear as an industry row in Focus Digital’s table, for construction and agriculture | No source located |
| Lead to opportunity = 84 days | Implisit via Salesforce, Nov 2014 | Real study, real figure, but it measures lead to opportunity, not a sales cycle | Genuine, different metric |
IMPORTANT
A number quoted by five pages is not corroborated by five sources. Check whether they cite each other. On this topic, they mostly do.
Three different 84-day figures, three different populations
The strangest thing we found is that 84 days shows up three separate times in this literature, attached to three different measurements. Two of them are real. None of them are the same number.
Optifai’s 84 days is a median across 939 B2B SaaS companies, all deal sizes pooled, stage transition unstated. The Ebsta attribution’s 84 days is presented as a median for enterprise deals above $100,000 ACV, which we could not find in either Ebsta report. Implisit’s 84 days is the average time from lead creation to opportunity creation, measured across hundreds of companies in 2014.
That third one is ours. Our audit of B2B lead conversion rate benchmarks documents the Implisit figure in full, including the detail that its original publication has been removed from the web and that it is routinely misattributed to Forrester. It is a lead-to-opportunity duration. It is not a sales cycle, and we do not present it as one.
| The “84 days” | Population | Stage measured | Year | Status |
|---|---|---|---|---|
| Optifai | 939 B2B SaaS companies, all deal sizes pooled | Not stated | 2026 | Vendor’s own data, no methodology published |
| As attributed to Ebsta and Pavilion | Enterprise deals above $100K ACV | Not stated | 2025 | Not found in either cited report |
| Implisit via Salesforce | Hundreds of companies, all CRM leads | Lead created to opportunity created | 2014 | Genuine, but not a sales cycle |
Put them side by side and the coincidence stops being charming. A reader who quotes “84 days” has a two-in-three chance of meaning something other than what their audience will assume, and no way to tell which.
The Implisit case is the instructive one, because it shows how this happens. A real figure gets separated from its stage definition, travels for a decade, and arrives somewhere it was never measured. The number never changed. The label did.
Sales cycle length by deal size: five tables that disagree
Benchmarks by ACV are the most useful form of this metric, because deal size genuinely predicts duration. They are also where the published numbers fall apart most visibly.
Below is every band set we could find on the first page of results, reproduced as published. Read down the columns rather than across the rows.
| Deal size | Optifai (N=939, 2026) | ORM Technologies (Mar 2026) | GrowthSpree | Focus Digital (June 2026) | Google AI Overview |
|---|---|---|---|---|---|
| Under $10K | 14–30 (under $15K) | 14–30 (under $15K) | 14–45 | 25–55 | 1–30 |
| $10K–$30K | 30–60 | 30–90 | 45–90 | 75 | 30–60 |
| $30K–$100K | 60–90 | 30–90 | 45–150 | 75–120 | 60–120 |
| $100K–$500K | 90–180+ | 90–180 | 120–210 | 170–220 | 120–180+ |
| Over $500K | Not published | 180–365 | 180–365+ | 270 | Not published |
| Sample disclosed | N=939 | None | None | None | N/A |
| Source per row | Own study | None | None | “Own research study” | None |
For a $100,000 deal the published answer is 60 to 90 days, or 90 to 180, or 120 to 210, or 170 to 220, depending which page you opened. That is not a range. That is disagreement about what is being counted.
Three things stand out. Only Optifai discloses a sample size at all. Only Optifai and Focus Digital claim the data is theirs, and Focus Digital discloses no sample. And Google’s AI Overview, which presents the cleanest-looking table of the five, uses band boundaries that match none of the sources it cites.
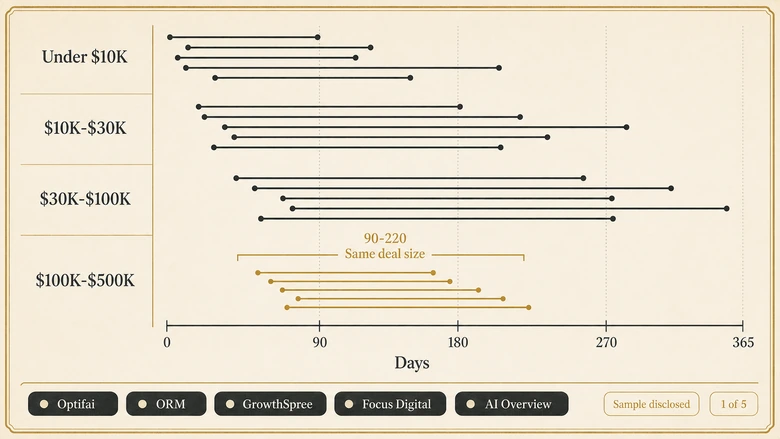
Focus Digital’s table carries one more problem worth naming. The page is dated 31 August 2025 and credits a “Focus Digital Research Study” dated June 2026. A page cannot cite a study published ten months after it. Either the date is wrong or the page has been revised without its date being updated, and there is no way for a reader to tell which.
Sales cycle length by industry: the same problem, one level down
Industry benchmarks inherit every flaw in the ACV tables and add one of their own, which is that the industry labels are not standardised either.
Focus Digital publishes point estimates for 20 industries, from retail at 70 days to non-profit at 162. ORM publishes five categories as ranges, splitting SaaS into horizontal at 60 to 90 days and vertical at 90 to 120. The two sets cannot be reconciled, because one reports single numbers and the other reports ranges, and neither says whether “software” and “horizontal SaaS” describe the same companies.
Where they do agree is directionally, and that agreement is the only part worth carrying: regulated sectors run long. Healthcare technology lands at 150 to 240 days on ORM’s table and 125 on Focus Digital’s, and while those figures are 90 days apart, both sit above their respective all-industry midpoints. Security review and compliance sign-off are real gates that add real weeks.
Treat industry tables as a ranking, not as a set of targets. The ordering of sectors is roughly consistent across sources. The values attached to that ordering are not.
Why the published bands disagree
Four differences explain almost all of the spread, and none of them are visible in the tables themselves.
The clock is set differently. Opportunity creation to closed-won is a much shorter window than first contact to signature. Neither Optifai, ORM, GrowthSpree nor Focus Digital states which one it used. Of the top-ranking pages, only upcell.io defines its start and end events explicitly, and it publishes no benchmark numbers at all. Those two facts are related.
Won deals only, or all resolved deals. Excluding lost deals removes the slowest outcomes and shortens the average. This is the survivorship problem covered in our sales velocity breakdown, and it alone can account for a 20 to 30 percent gap.
The population is different. “B2B” and “B2B SaaS” are not the same universe. Horizontal SaaS and regulated healthcare software do not belong in one median, and a median across a range that wide describes nobody.
Median or mean. Salesforce and upcell.io both recommend the median, correctly, because a handful of 400-day enterprise deals drags a mean upward. Klipfolio’s calculation guidance uses a straight average. When a page quotes a benchmark without saying which it used, the two can differ by a third.
PRO TIP
Before quoting any external cycle-length figure, ask four questions: which stage transition, won-only or all resolved, which segment, median or mean. If the source answers fewer than three, it is not a benchmark you can compare against.
Have B2B sales cycles actually got longer?
Probably yes, and the honest answer is that the specific numbers in circulation do not establish it.
The “22% since 2022” figure is the one everybody quotes. ORM Technologies credits it to “Digital Bloom, 2025.” The Digital Bloom is a Portugal-based B2B SaaS marketing agency, and its published 2025 research covers lead-stage marketing, go-to-market channel benchmarks and sales messaging. We found no sales cycle study. Optifai presents the same 22% as a finding of its own study. Focus Digital states it with no attribution at all. One figure, three incompatible origin stories.
The directional claim still has better support than the number does. Buying committees have grown, and larger committees correlate with longer cycles. Our analysis of B2B buying group statistics is careful about what that correlation licenses: 6sense reports group size as the strongest measured correlate of cycle length, but vendor count and evaluation complexity rise alongside group size, so no public study isolates the cause. Anyone telling you committees are the reason cycles lengthened is reporting a correlation as a mechanism.
There is also a measurement artefact hiding here. Better attribution tooling sees more stakeholders and more touchpoints than it did in 2020. Some of the observed increase in both committee size and cycle length is improved visibility rather than changed behaviour, and none of the published figures separate the two.
Where cycles have genuinely stretched, the effect concentrates in large deals. Security review, procurement and legal are step functions that fire above a spend threshold, which is why the gap between a $15,000 deal and a $500,000 deal has widened more than either has moved on its own. Our guide to the enterprise sales funnel covers what those gates do to a deal above that threshold.
How to benchmark your own sales cycle length
Since the external benchmarks do not survive inspection, the useful comparison is internal: your segments against each other, and this quarter against last. That comparison is valid because both sides came out of the same CRM with the same definitions.
Workflow · 45 min
How to measure sales cycle length you can actually defend
Produces a segmented cycle-length baseline with a stated clock, so the number survives a question from your board.
Write down your start and end events
Pick one pair and record it in your reporting spec. Opportunity created to closed-won is the most common defensible pair. Do not change it between periods.
Pick a cohort that has fully resolved
Select opportunities created in a window at least as long as your longest expected deal. A 90-day window on a 200-day motion counts only the fast deals.
Include lost and disqualified deals
Compute the figure on all resolved outcomes, then again on won deals only. Report both. The gap between them is your survivorship bias, measured rather than assumed.
Split by ACV band before you average anything
Compute cycle length separately per deal-size band and per motion, such as new business against expansion. A single company-wide figure hides the mix shift that drives most quarter-on-quarter movement.
Report the median and the spread, never the mean alone
Publish the median plus the 25th and 75th percentiles for each band. The percentile spread is the number that tells you whether your process is consistent.
Attach the definition to the number
Every time the figure appears in a deck, carry the clock, the cohort window and the segment with it. This is the step that stops your own number becoming somebody else’s zombie stat.
Run that and you will have something none of the five published tables offers: a cycle length whose population you can name. That is worth more than a benchmark you cannot audit.
What to do with external benchmarks instead
They are still useful, as long as you demote them from targets to sanity checks. If your $50,000 deals close in 300 days, every published table agrees you are an outlier, and that agreement is informative even though the tables disagree with each other about the middle.
What they cannot do is set a goal. “We should be at 84 days” is a sentence with no referent, because there is no verified population where 84 is the answer. Replace it with your own prior-period median for the same segment, which is a target you can actually move and actually verify. Cycle length at least holds still while you argue about it; quota attainment is where that mistake gets expensive, because the median SDR quota behind those published percentages has itself fallen 40% since 2018.
The pattern here is not specific to cycle length. It is what happens to any metric that is quoted more often than it is measured, and the defence is always the same: carry the denominator with the number.
Frequently Asked Questions
There is no verified cross-industry figure. Published bands put deals under $15,000 at roughly two to six weeks and deals above $100,000 at roughly three to seven months, but the five sources we checked disagree by 50 to 100 percent on the same deal size and none discloses its clock definition.
It is a median, not an average, and it traces to a single vendor study with no published methodology. Two other unrelated figures also equal 84 days while measuring different things, including a 2014 lead-to-opportunity duration. Treat the number as unsourced until a population is attached.
Use the median, and publish the 25th and 75th percentiles alongside it. A small number of very long enterprise deals pulls a mean upward, so the average describes no real deal. Salesforce and upcell.io both recommend the median for this reason.
The direction is plausible but that specific figure does not resolve to a source. It is credited to a marketing agency with no such study, claimed by a vendor as its own finding, and stated elsewhere with no attribution at all. Cite it only with those caveats attached.
It is a prospecting time-management heuristic: spend three hours prospecting, contact three new accounts and follow up with three existing opportunities daily. It is a rep activity guideline, not a cycle-length benchmark, and it has no bearing on how long deals take to close.





