
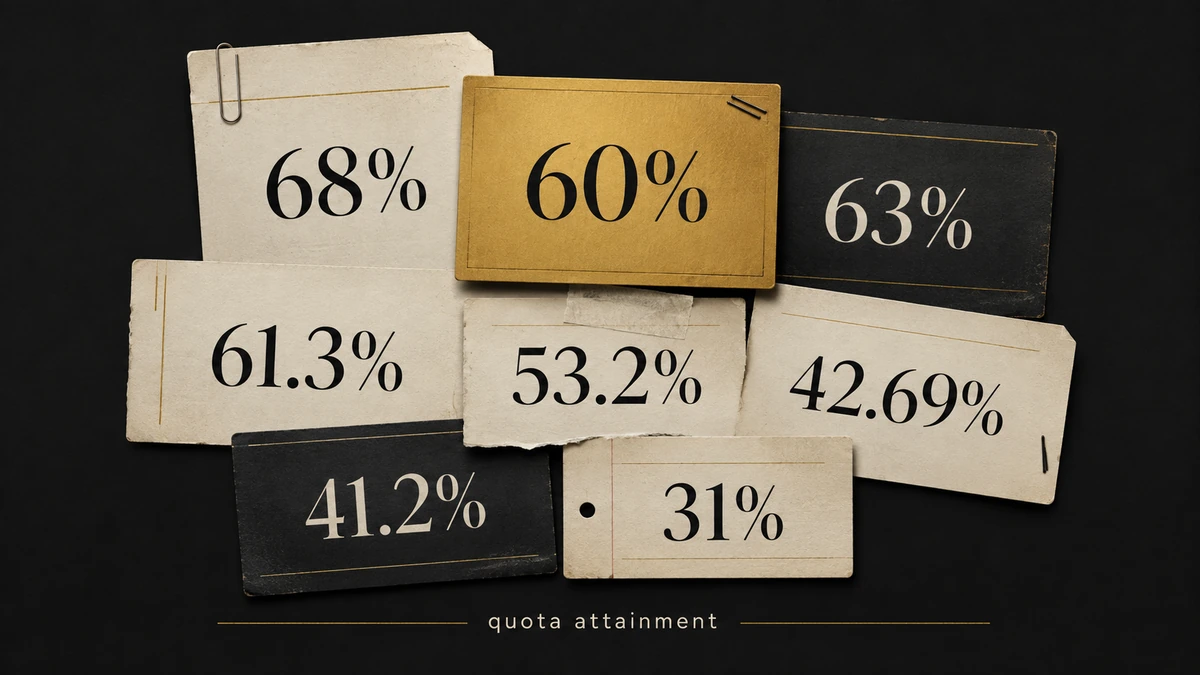
Search “SDR quota attainment” and Google’s AI Overview will tell you the average sits between 58% and 68%, with top teams reaching 70% to 80%. Scroll two inches down the same page and you land in a Reddit thread where sales development reps insist nobody on their team has cleared 50% in two years. Same query, same screen, same job, two irreconcilable answers.
The figures in circulation right now include 41%, 53.2%, 57%, 45% to 60%, 61.3% and 68%. They are not six estimates of one quantity. They are at least four different measurements wearing the same label, taken from different populations, in different years, against quotas that have themselves dropped by 40% since 2018.
This page traces each number back to its original. The figure Google currently serves as the top of the range turns out to come from a 2019 write-up of a survey of 434 companies with median revenue of USD 24M. The current edition of that same research series reports 60% and calls it the lowest reading in its history.
Direct answer — What is the average SDR quota attainment rate?
SDR quota attainment is the share of a sales development rep’s target actually delivered, usually counted in meetings held. The most current primary source, The Bridge Group’s 2025 report covering 351 B2B companies, puts 60% of SDRs at or above quota, the lowest in that study’s history, against a median monthly quota of 10 held meetings that has fallen 40% since 2018. Higher figures still circulating in 2026 are older editions or different populations entirely.
Key Takeaways
- The widely quoted 68% figure traces to an October 2019 write-up of a Bridge Group survey of 434 companies with median revenue of USD 24M. It is roughly seven years old and still appears in Google’s AI Overview as a current benchmark.
- The current primary source, Bridge Group’s 10th edition (351 companies, 2025), reports 60% of SDRs at quota and labels it the lowest in study history.
- The “57%” and “41%” figures come from RepVue’s Cloud Sales Index, which covers roughly 47,000 quota carriers across 246 cloud and software companies. That population is all sales roles, not SDRs, and 57.31% is the share who missed, not hit.
- Median SDR quota has fallen 40% since 2018 while attainment hit a record low. Ebsta and Pavilion separately found quota targets cut 19% year over year. Attainment measured against a shrinking target cannot be compared across years.
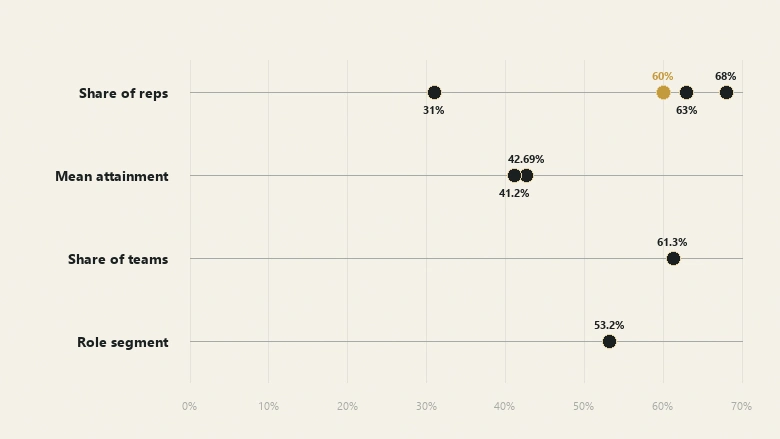
- At least four distinct metrics are printed as “quota attainment”: share of reps at quota, mean attainment as a percentage of quota, share of teams below a threshold, and role-segment attainment. Only the first two are ever the same shape.
What SDR quota attainment actually measures
SDR quota attainment is the percentage of an assigned target that a sales development rep delivers in a period. For most sales development teams the target is counted in meetings held rather than revenue closed, because the SDR hands the deal off long before it books.
Quota attainment % = Actual output ÷ Assigned quota × 100That formula is not in dispute. What breaks every benchmark comparison is the two very different questions people answer with it, and then report under one name.
Share of reps at quota versus mean attainment
The first question is what share of reps reached 100%. It is a headcount statistic, and it produces sentences like “60% of SDRs hit quota.” The second is what the average rep delivered as a percentage of target. That is a performance statistic, and it produces sentences like “average attainment was 42.7%.”
A team where every rep lands at 95% has 0% of reps at quota and 95% mean attainment. A team where six reps hit 110% and four deliver nothing has 60% of reps at quota and 66% mean attainment. The two numbers move independently, and a benchmark that mixes them is not a benchmark.
Salesforce’s own definition page, which ranks on page one for this query, gives the formula as revenue from a rep’s closed deals divided by the rep’s quota. That is correct for an account executive and structurally wrong for an SDR, who does not close the deals in the numerator.
Why published SDR attainment runs from 28% to 68%
Once you attach each figure to its actual denominator, the spread stops looking like disagreement and starts looking like a labelling problem. Here is what the circulating numbers count.
| Figure | Original source | What it counts | Population |
|---|---|---|---|
| 68% | QuotaPath write-up, Oct 2019, of a Bridge Group report | Share of reps at quota | 434 companies, median revenue USD 24M |
| 63% | Blossom Street Ventures, May 2023, reviewing the same series | Share of reps at quota | Not restated in the summary |
| 60% | Bridge Group, 2025, 10th edition | Share of SDRs at quota | 351 B2B companies, 83% SaaS |
| 53.2% | RepVue role-level data | SDR-specific attainment | Self-reported SDR ratings |
| 42.69% / “57.31% missed” | RepVue Cloud Sales Index, Q2 2025 | Mean attainment, reported both ways | ~47,000 quota carriers, 246 companies |
| 41.2% | RepVue Cloud Sales Index, Q1 2025 | Software segment only | Same index, filtered |
| 61.3% | Orum, via School of SDR, Apr 2026 | Share of teams below 70% attainment | 300 sales leaders |
| 31% (69% “fell short”) | Ebsta and Pavilion, 2024 | Share of reps at quota, CRM-derived | 530 companies, 4.2M opportunities |
Four of those rows are share-of-reps statistics. Two are mean-attainment statistics. One counts teams, not people. One is a segment filter applied to a broader population. Averaging them, which is what a range like “45% to 60%” quietly does, produces a number that describes nothing.
The Bridge Group series is the number everyone paraphrases
The Bridge Group has run its sales development benchmarking study for more than a decade, and it is the origin most listicles are reaching for when they say “research shows.” Very few of them name the edition, and almost none name the year.
The current release is SDR Models, Motions & Metrics: 2025 Research Report, the 10th edition, built on responses from 351 B2B companies surveyed across 2024 and 2025. The sample skews 78% North America and 83% B2B SaaS, with median company revenue of USD 47M and a median ASP of USD 50K.
Its headline attainment figure is 60% of SDRs at quota, described as the lowest reported in study history. Underneath that, 67% of companies report between 50% and 89% of reps at quota, and 21% report the 70% to 89% band.
Where 68% actually comes from
Now trace the number Google prefers. The clearest surviving statement of it is a QuotaPath study overview published in October 2019, summarising a Bridge Group report drawn from 434 companies with a median annual revenue of USD 24M. Its wording: “on average, 68% of reps achieve quota in a given group.”
By May 2023, Blossom Street Ventures reviewed the same research series on Medium and reported the sentence almost verbatim, with one change: “On average, 63% of reps in a given group achieve quota. There has been remarkable consistency around this metric over the years.”
Same sentence structure, same claim of consistency, different number. Then 60% in the 2025 primary. The template survived three editions while the figure fell eight points, and the pages quoting 68% in 2026 are quoting a survey population half the size, by revenue, of the current one.
IMPORTANT
If a page gives you an SDR attainment figure without naming the edition and the survey year, you cannot tell whether it is describing 2019 or 2025. On this metric those are eight percentage points and a 40% change in quota size apart.
RepVue, Ebsta and Salesforce measure three different populations
The other three sources most often cited alongside Bridge Group are not measuring the same thing as Bridge Group, or as each other.
RepVue: self-reported, software-wide, and frequently inverted
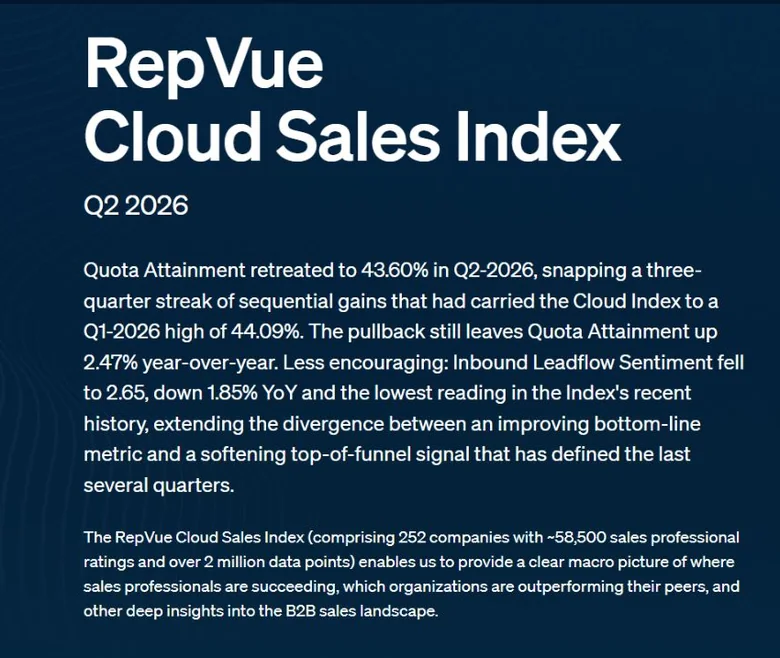
RepVue’s Cloud Sales Index draws on roughly 47,000 quota-carrying sales professionals across 246 cloud and software companies. For Q2 2025 it produced the pair of figures that has caused the most damage downstream: 57.31% of reps missed quota, with average quota attainment reported at 42.69%.
Those two numbers sum to exactly 100, which is the tell. Share-of-reps-who-missed and mean-attainment-as-a-percentage are different measurements and have no arithmetic reason to be complements. Somewhere in the reporting chain, one was derived from the other by subtraction.
The consequence shows up everywhere. “57% of SDRs hit quota” is now a common claim. The underlying figure is 57.31% of software sales reps who missed, and they were not SDRs.
Ebsta and Pavilion: CRM-derived, and the target moved
The 2024 B2B Sales Benchmarks report from Ebsta and Pavilion is built differently: 4.2 million opportunities from 530 companies representing USD 54B in revenue, read out of CRM rather than surveyed. It found 69% of reps falling short of quota, improved from 73% missing in the second half of 2023.
That looks like recovery until you read the next finding. Quota targets were cut by 19% year over year. Attainment improved against a target that had been lowered, which is not the same as reps producing more.
Salesforce: the right formula for the wrong role
Salesforce’s quota attainment explainer defines the metric in closed revenue. For the account executive population it surveys, that is the correct unit. Applied to sales development it measures something the SDR has no control over, since the meetings an SDR books in March close, or fail to close, in someone else’s quarter.
The 41% software-only figure and what a segment filter does
The 41% number in circulation is RepVue’s Cloud Sales Index reading for Q1 2025, covering software reps specifically, which recovered to around 43% by Q3 2025. It is the lowest headline figure in general circulation, and it gets quoted as though it were the SDR number.
It is not. It is every quota-carrying role at cloud and software companies, filtered to one industry. Enterprise account executives dragging a 38% attainment rate sit in that denominator alongside SDRs. RepVue’s own role-level view puts SDRs nearer 53%, above the blended software figure, because SDR quotas are set in meetings and reset monthly rather than in annual revenue.
Segment filters cut both ways, and neither direction is an error as long as the filter is stated. “41% of software sales reps hit their number in Q1 2025” is a defensible sentence. “41% of SDRs hit quota” is not the same sentence, and it is the one that travels.
Quotas fell 40%, and attainment still fell with them
This is the finding that invalidates most year-over-year comparisons on this metric, and almost nobody quoting attainment mentions it.
Bridge Group’s 2025 edition reports a global median monthly quota of 10 Stage 0 meetings held, down 40% since 2018. Split by qualification bar, the medians run 16.0 meetings for an introductory model, 10.4 for semi-qualified and 9.0 for fully qualified. Over the same period the share of reps clearing that reduced number fell to a record low.
Ebsta and Pavilion found the same pattern in a completely different dataset, with targets cut 19% in a single year while two thirds of reps still missed.
So the honest version of the trend is not “attainment is down.” It is: targets were cut substantially, and attainment fell anyway. A 60% attainment rate in 2025 represents materially less output than a 68% rate did in 2019, because the quota behind it is smaller. Anyone plotting those two points on one line is drawing a chart with a moving y-axis.
PRO TIP
Before you compare your attainment to any published figure, write down your median monthly meeting quota next to theirs. If the quotas differ by more than about 20%, the attainment percentages are not comparable and the quota number is the more useful benchmark.
Ramp, tenure and the survivorship problem
Attainment is an average over whoever was employed long enough to be counted, and sales development has unusually heavy turnover at the bottom of the distribution.
Bridge Group’s 2025 figures put average ramp at 3.0 months, the lowest since 2010, and average SDR tenure at 1.9 years, the highest since the early 2010s, with 58% of companies reporting average tenure in the 12 to 23 month band. Annual attrition for 2024 ran at a 40% median, with an interquartile range of 21% to 57%. That splits into 13% involuntary, 11% voluntary and 16% promotions.
A 40% median attrition rate means a meaningful slice of the reps who would have pulled the average down were not there at year end to be measured. Involuntary exits at 13% are, by definition, concentrated among low performers. Reported attainment is therefore a survivor statistic, and it flatters teams that manage out quickly.
The Orum survey behind the widely shared “61% of SDRs aren’t hitting quota” headline sidesteps the rep-level problem by measuring teams instead. Its finding, as reported by School of SDR in April 2026 from a survey of 300 sales leaders, is that 61.3% of SDR teams are falling below 70% quota attainment. That is a third metric shape again, and the headline converts it into a rep-level pass or fail it was never measuring.
Which benchmark applies to your team
The useful question is not which figure is correct. It is which one shares your denominator.
- Use Bridge Group’s 60% when you run a dedicated SDR function at a B2B SaaS company of roughly USD 20M to 100M in revenue, with quota set in meetings held. That is the sample it was drawn from.
- Use RepVue’s role-level SDR figure when you want a directional read that updates continuously and you accept self-reported data from reps rather than reported data from leadership.
- Use Ebsta and Pavilion’s CRM-derived numbers when your quota is denominated in pipeline or closed revenue and you want opportunity-level evidence rather than survey recall.
- Avoid the range figures entirely, including 45% to 60% and 58% to 68%. Every one of them is an average across populations that measure different things, and none states a denominator you can match.
- Avoid any figure without an edition year, because on this metric the difference between 2019 and 2025 is larger than the difference between a good team and a bad one.
None of these substitutes for your own number. Published benchmarks tell you whether your target is unusual; only your own data tells you whether your team is.
How to calculate an attainment number you can defend
The version worth reporting to a board states its own denominator, so nobody has to guess which of the four metrics you used.
Workflow · 20 min
How to calculate SDR quota attainment you can compare against a benchmark
Produces a single attainment figure with a stated denominator, a stated population and a stated quota unit, so it can be matched to a published benchmark or defended in a board pack.
Fix the quota unit in writing
State whether quota is meetings booked, meetings held, or opportunities accepted by an AE. Held and booked differ by your no-show rate, which is frequently 20% or more.
Decide which reps enter the denominator
Include or exclude reps still in ramp, and reps who left mid-period. Write the rule down. Excluding both is defensible; excluding only leavers is not.
Pull actual output per rep for the period
Export from the CRM at the object that matches your unit. Reconcile against the calendar or meeting object rather than trusting a rep-updated field.
Compute both metrics, not one
Calculate the share of reps at or above 100%, and separately the mean attainment percentage. Report them side by side and label each.
Record the median quota alongside the percentage
Log the median monthly quota the attainment was measured against. Without it, next year’s comparison is meaningless if you change the target.
Match to a benchmark with the same shape
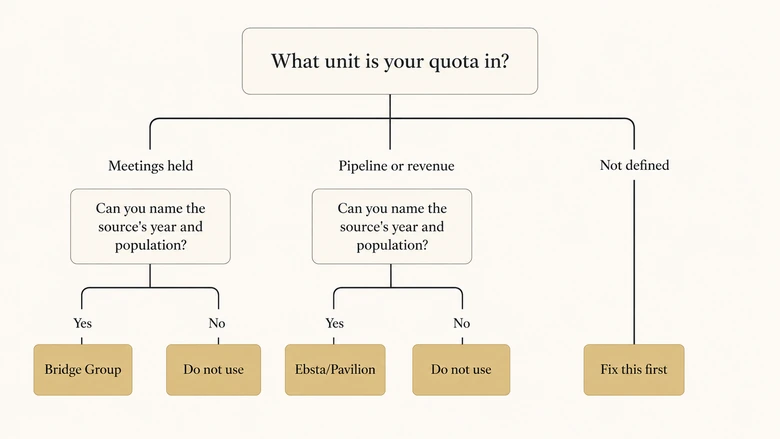
Compare only against a published figure whose population, quota unit and year you can name. If you cannot name all three, do not use the comparison.
Step three is where most teams lose the number. If meeting objects are created by a rep-updated field rather than the calendar, attainment inherits every logging gap in the system. On inbound the constraint sits earlier still, because an SDR’s meeting count is capped by how fast anyone reaches the lead at all, and response time is four separate clocks rather than one, only one of which the rep actually controls.
Output is also a function of persistence, not just capacity, and the persistence numbers have their own provenance problems. Before you set an activity target from a published attempt curve, check which follow-up statistics survive an audit, because the most-quoted one dates to 1942.
How to quote each of these numbers safely
Every figure in this article is usable. None of them is usable as a bare percentage. This is the sentence each one supports.
| Number | Publisher and year | Safe to quote as |
|---|---|---|
| 60% | Bridge Group, 10th edition, 2025 | “60% of SDRs were at or above quota across 351 B2B companies in 2025, the lowest in the study’s history.” |
| 10 meetings/month | Bridge Group, 2025 | “Median monthly SDR quota is 10 held meetings, down 40% since 2018.” |
| 68% | Bridge Group via QuotaPath, 2019 | “A 2019 summary of Bridge Group data from 434 companies reported 68% of reps achieving quota.” Never as current. |
| 63% | Bridge Group via Blossom Street Ventures, 2023 | “A 2023 review of the same series reported 63%.” Secondary, edition not stated. |
| 42.69% | RepVue Cloud Sales Index, Q2 2025 | “Mean quota attainment across ~47,000 cloud and software quota carriers was 42.69% in Q2 2025.” Not SDR-specific. |
| 57.31% | RepVue Cloud Sales Index, Q2 2025 | “57.31% of software sales reps missed quota.” Never as the share who hit. |
| 41.2% | RepVue Cloud Sales Index, Q1 2025 | “Software-segment attainment was 41.2% in Q1 2025.” Always name the segment filter. |
| 53.2% | RepVue, role-level | “RepVue’s SDR role data puts attainment near 53%.” Self-reported, continuously updated, no fixed sample. |
| 69% fell short | Ebsta and Pavilion, 2024 | “69% of reps missed quota across 4.2M opportunities, against targets cut 19% year over year.” Quote the target cut with it. |
| 61.3% | Orum, via School of SDR, 2026 | “61.3% of SDR teams are below 70% attainment, per 300 sales leaders.” Teams, not reps. |
| 58% to 68% | Aggregator pages, 2026 | Do not quote. No stated population, and it spans two different metric types. |
The same discipline applies one stage down the funnel. Meeting-to-opportunity rates carry an identical denominator problem, which is why published lead-to-meeting benchmarks range from under 5% to over 60% without any of them being wrong.
Methodology and what could not be verified
Every figure above was traced to the most original page reachable on 9 August 2026. Where a report sits behind a download form, the figure is attributed to the page that states it, not to the report, and the intermediary is named in the ledger.
Two sources returned automated-retrieval errors and were resolved through their search-indexed content and through third-party pages quoting them directly. RepVue‘s Cloud Sales Index and role pages returned HTTP 429 and 403; its quarterly figures here are taken from QuotaPath’s write-up, which names the index, the quarter and the sample, and the 53.2% role-level figure is corroborated across indexed secondary reporting rather than read from RepVue’s own page. Salesforce‘s blog returned HTTP 403; its definition and formula are taken from the indexed content of its quota attainment explainer.
The Bridge Group figures for editions before 2025 could not be read from Bridge Group directly, which is the point of the third section: the pre-2025 numbers in general circulation exist publicly only as third-party summaries. Where a summary does not name its edition, this article says so rather than assigning one.
No IVRIS-owned attainment benchmark is claimed. This page audits published figures; it does not add a new one.
Frequently Asked Questions
Against the current primary benchmark, 60% of reps at or above quota is the 2025 median across 351 B2B companies. Bridge Group found 21% of companies in the 70% to 89% band, so clearing 70% puts a team in roughly the top fifth. Compare only if your quota is also set in meetings held.
Divide actual output by assigned quota and multiply by 100. For SDRs, output is normally meetings held rather than revenue. Report two versions: the share of reps at or above 100%, and the mean attainment percentage across reps. They answer different questions and frequently disagree.
Because they measure different things under one label: share of reps at quota, mean attainment percentage, share of teams below a threshold, and industry-filtered segments. They also span different years, and median SDR quota has fallen 40% since 2018, so the target behind each percentage keeps changing.
No. That figure is RepVue’s Q2 2025 Cloud Sales Index reading of 57.31%, and it is the share of software sales reps who missed quota, not the share who hit it. It also covers all quota-carrying roles at cloud and software companies, not sales development specifically.
Bridge Group’s 2025 global median is 10 held meetings per month. That varies by qualification bar: about 16 for an introductory-standard meeting, 10.4 for semi-qualified and 9.0 for fully qualified. Setting a quota without first fixing the qualification bar is the most common source of an unhittable target.





