
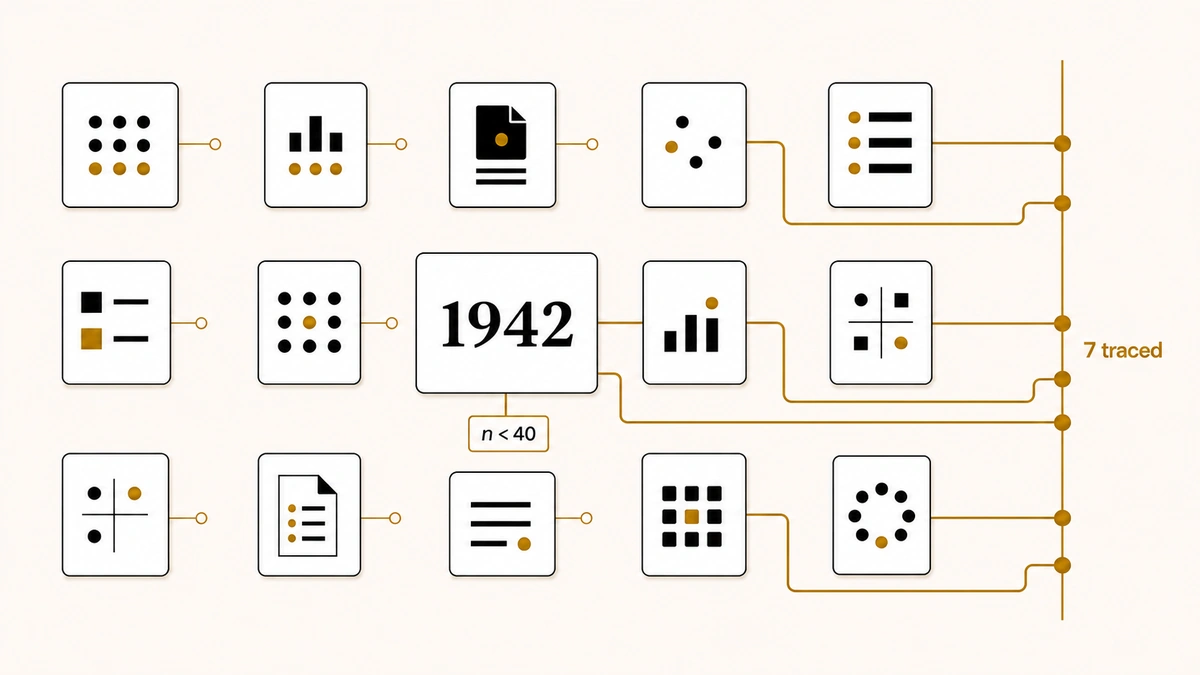
Search for sales follow-up statistics and the same four numbers come back at you from every result on the page. Eighty percent of sales need five follow-ups. Forty-four percent of reps quit after one. Ninety-two percent quit by the fourth. Ninety-five percent of converted leads are reached by the sixth call.
We tried to open the studies behind them. Fifteen claims went into the audit, and eight of them do not trace to any original research: seven have no locatable source at all, and one turned out to be arithmetic performed on another. The single most-quoted figure in B2B sales comes from a survey of fewer than 40 people conducted in 1942.
This page is the audit. Every claim below carries its original publisher, its year, its sample size and, most importantly, its denominator, because the number of leads you can reach on the fourth call and the number of already-converted customers who happened to take a fourth call are different measurements that get printed as the same sentence.
Direct answer — How many follow-ups does it take to close a B2B sale?
No study supports a universal number. The figure most often quoted, that 80% of sales happen between the fifth and twelfth contact, comes from a 1942 survey of fewer than 40 members of one local sales chapter, measuring in-person visits. Modern platform data measures different things again: Belkins found email steps two through six generate 58.6% of replies across 7.5 million emails sent in 2025. Match any number to its channel, denominator and date before you use it.
Key takeaways
- Of 15 circulating follow-up statistics we audited, 8 do not trace to any original study, 7 disclosed a sample size, and only 5 disclosed when the underlying data was collected.
- The “80% of sales require five follow-ups” family traces to a 1942 survey of under 40 members of one Long Island sales chapter, measuring in-person visits. The successor organisation publishes this provenance itself and cautions against using the numbers.
- “92% of reps give up after four attempts” is not a finding. It is 44 + 22 + 14 + 12, the sum of an untraceable ladder.
- The “95% of converted leads reached by the sixth call” figure is 93% in the original Velocify study, and it is calculated over converted leads only, so it cannot tell you your odds of reaching anyone.
- Modern first-party datasets from Belkins, Woodpecker and Cognism are real, but they measure email steps, touchpoints and dial connects respectively. They cannot be averaged into one persistence benchmark.
What the follow-up numbers say once you attach their scope
A follow-up statistic is only usable when four things travel with it: who published it, when the data was collected, how many observations it covers, and what population the percentage is calculated over. Strip any one of those away and the number becomes unfalsifiable.
Here is every claim in this audit that survived tracing, with its scope attached. Nothing in this table is an IVRIS measurement. These are third-party studies, reported with the boundaries their authors set.
| Claim, correctly stated | Publisher, year | Sample | Denominator |
|---|---|---|---|
| 93% of converted leads are contacted by the sixth call attempt | Velocify, 2013 | ~3.5m leads, 400+ companies, first half of 2012 | Leads that eventually converted, not all leads |
| Email steps two through six generate 58.6% of all replies; the first email generates 41.4% | Belkins, 2026 | 7,530,489 emails, January to December 2025 | Unique replies divided by emails sent, excluding auto-replies and bounces |
| Adding one follow-up raises total replies by 65.8%; sequences of 3 to 5 follow-up steps reply at 8.3% against 4.1% with none | Woodpecker, 2026 | 20m+ emails; collection window not stated | Replies per campaign, email channel only |
| Outbound teams average 3.36 touches per prospect; SDR cold calls are answered 13.3% of the time | Cognism, 2026 | 451,895 calls, 196,470 prospects, 110 AEs, 2025, five regions | One company’s own outbound teams |
| 2% of sales close on the first contact, rising to 80% across contacts five to twelve | NSEA Long Island chapter, 1942 | Fewer than 40 members, self-reported | Ratio of in-person visits made to sales made |
Two things stand out. The only claim that describes contact rates by attempt number is conditioned on conversion, and the only claim that describes a full five-to-twelve contact curve is 84 years old. There is no modern, independent, published curve of reachability by attempt number in B2B. That absence is the actual state of the evidence.
This page measures what happens across attempts two onward. How fast the first attempt should happen, and the eighteen different clocks the industry calls speed to lead, is audited separately in our speed-to-lead statistics review, and the operating model for setting those targets sits on speed to lead.
Five different things are all called a follow-up
Most contradictions in this topic dissolve once you separate the units. A touch, an attempt, a contact and a reach are four different events, and the studies quoted alongside each other rarely count the same one.
| Unit | What it counts | Who uses it |
|---|---|---|
| Touch | Any outbound action aimed at a prospect, including an unopened email or an unanswered dial. Nobody has to be reached. | RAIN Group, Cognism |
| Attempt | A dial or a send, counted per lead rather than per campaign. | Velocify, Orum |
| Sequence step | The position of a message inside a defined cadence. Step 3 means the third scheduled email, not the third human interaction. | Belkins, Woodpecker |
| Contact or reach | A live person answered. This is the only unit that describes an outcome rather than an activity. | Velocify, Cognism |
| Contact before a sale | Interactions counted backwards from a closed deal, which can only be counted for deals that closed. | The 1942 ladder |
The last row is where most damage happens. Counting backwards from closed deals cannot tell you anything about the leads that never closed, because they are not in the sample. A statistic built that way describes the history of your winners, not the odds facing your reps on Monday morning.
Important
“80% of sales happen on the fifth to twelfth contact” and “80% of leads are reachable by the fifth attempt” are different sentences with different truth conditions. The first is survivorship arithmetic. The second is a reachability claim that no public study in this audit actually supports.
The 1942 survey behind “80% of sales need five follow-ups”
The most repeated persistence statistic in B2B sales has a traceable origin, and it is older than the transistor. Sales & Marketing Executives International, the organisation that published it, documents the provenance on its own site.
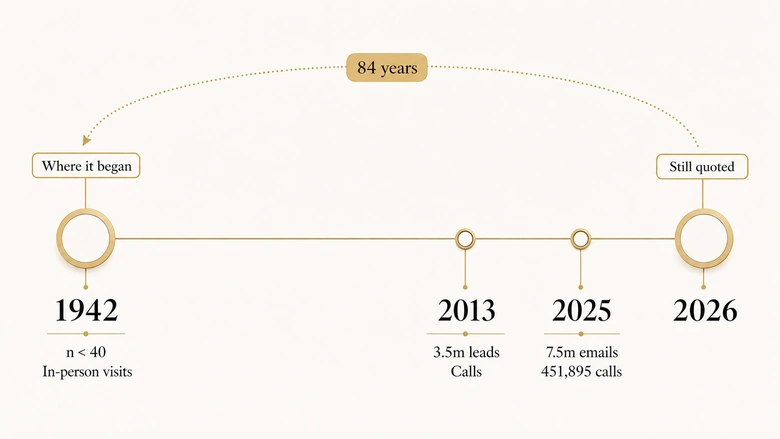
In 1942, the Long Island, NY chapter of NSEA (now SMEI) surveyed their members to determine the ratio of calls made to sales made.
According to SMEI’s own account, published by Willis Turner in August 2021, the survey produced the familiar ladder: 2% of sales on the first contact, 3% on the second, 5% on the third, 10% on the fourth, and 80% across the fifth to twelfth. The same page adds the detail that no roundup carries: “Another thing that might surprise you is that the sample size was less than 40.”
A “call” in 1942 meant a salesperson physically visiting a business. The survey measured the ratio of visits made to sales made, self-reported by fewer than 40 members of a single local chapter, in an economy without direct-dial long distance, let alone email. It is not a measurement of B2B email touches, and it was never presented as one.
SMEI is not defending the figures. The page exists to caution readers, asking directly: “Who did the research? Is the research unbiased? Was the research done recently, or is it out of date? Was the sample size meaningful?”
One further correction is worth recording, because published debunkings of this statistic have concluded that the National Sales Executive Association never existed. SMEI’s own site states that it was “named in earlier days as National Sales Executives Association.” The association is real and still operating. What does not exist is a modern study by it. The 1942 chapter survey is the whole evidentiary base.
Follow-up statistics that do not survive an audit
Eight of the fifteen claims failed. Five could not be traced to any original study, one is arithmetic on another, and two are traceable but consistently misquoted.
Claims with no locatable original
| Claim as usually quoted | Attributed to | What we found |
|---|---|---|
| It takes 8 cold call attempts to reach a prospect, up from 3.68 in 2007 | TeleNet and Ovation Sales Group | No study, report, dataset or archived page exists for either party. “Ovation Sales Group” has no locatable corporate record. “3.68” carries three significant figures implying a real dataset; “8” carries no year and has been described as “today” continuously since roughly 2012. |
| 44% of salespeople give up after one follow-up | Marketing Donut, or Scripted | Neither is a research publisher. No methodology, sample size or fieldwork date has ever been published for it by anyone, including the sites credited. |
| 22% quit after two, 14% after three, 12% after four | Unattributed | The tail of the ladder could not be attached to any named source at all. |
| 48% of reps never follow up after initial contact | NSEA | A second, incompatible ladder (48 / 25 / 12 / 10) attributed to the same body as the 44 / 22 / 14 / 12 ladder. Both cannot be right. |
| 60% of customers say no four times before saying yes | Varies by page | No original located. Carried without citation by the aggregator pages that rank for this term. |
| 80% of calls go to voicemail and 90% of first-time voicemails are never returned | Unattributed | No original located. Published on the page currently ranking first for this keyword with the literal phrase “(source pending verification)” attached. |
That last detail is worth pausing on. Six separate statistics on the current top-ranking result for this keyword carry the string “(source pending verification)” in production, including the 44% figure and the voicemail pair. An internal editorial note asking a colleague to check a number has been published as though it were the number’s citation, and it has been live long enough to be indexed and quoted onward.
The chain behind the headline claim is just as short, and it can be walked in two clicks. That same page sources “80% of sales require at least 5 follow-up contacts before closing” to invespcro.com. That page carries twelve follow-up statistics, including this one, with no citations, no footnotes, no bibliography and no outbound links of any kind. The chain terminates there, because there is no study at the end of it to point at.
The claim that is arithmetic, not research
“92% of sales reps give up after four attempts or fewer” is presented everywhere as an independent finding, usually one sentence away from the 44 / 22 / 14 / 12 ladder. Add that ladder up: 44 + 22 + 14 + 12 = 92. The two are the same untraceable artefact, printed twice, and quoting them together does not corroborate either. It double-counts a claim nobody has sourced once.
Claims that are traceable but misquoted
The sixth-call statistic is the clearest case in this audit, because the original is specific and the circulating version is wrong in three ways at once. Velocify’s 2013 study analysed nearly 3.5 million leads from more than 400 companies, generated in the first half of 2012 and tracked through the third quarter, and reported that “93% of all converted leads are contacted by the 6th call attempt.”
It circulates as 95%. It is frequently credited to InsideSales or to Inc. rather than to Velocify. And the denominator is dropped entirely.
The study is explicit that it describes converted leads: “only 7% of all leads that eventually convert are reached for the first time after seven or more call attempts.” Because the population is defined by having converted, the figure cannot tell a rep how likely a sixth call is to reach anyone. Both the first and third results currently ranking for this keyword publish it as 95%, one of them crediting a publisher that did not produce it.
The second misquote is subtler. RAIN Group’s prospecting research, based on 488 buyers representing $4.2 billion in purchases across 25 industries plus 489 sellers, is regularly cited for “8 touches to secure a meeting” alongside the untraceable “8 cold call attempts to reach a prospect.” Those are different constructs. Touches to secure a meeting counts outbound actions toward an outcome; attempts to reach counts dials until someone answers. We could confirm the sample on RAIN’s public page but not the touch figure or the fieldwork year, both of which sit behind a download gate, so this claim is recorded as partially traced.
What modern platform data measures by attempt number
Three vendors publish genuine first-party datasets with methodology attached. Each measures something real. None of them measures the same thing.
Email sequence data
Belkins analysed 7,530,489 emails sent across twelve months of 2025, alongside 112,005 LinkedIn invite sequences from 33 client projects and more than 46,000 call records. It defines its reply rate as unique replies divided by emails sent, excluding auto-replies and bounce notifications, and it disabled open tracking for the period rather than report a metric it considered unreliable.
Per-step reply rates are low and flat: 0.59% at step one, 0.30% at step three, 0.34% at step four, 0.28% at step six. The aggregate is the interesting part. Steps two through six together account for 58.6% of all replies, against 41.4% for the opening email, and step three alone drives 35.6% of email-sourced meetings, more than steps one and two combined.
Woodpecker, drawing on more than 20 million emails, reports a 3.43% average reply on the first email, campaigns with three to five follow-up steps replying at 8.3% against 4.1% for sequences with no follow-up at all, and an optimum of four to seven total touchpoints. It also states plainly that Apple Mail Privacy Protection now accounts for roughly 49% of recorded opens, which is why open rate is “a directional signal in 2026, not a precise performance measure.” Woodpecker does not state the collection window for its dataset, which is the one gap in an otherwise well-documented set. Channel-specific execution for this sits in our guide to cold email follow-up.
Dial and connect data
Cognism logged 451,895 calls against 196,470 prospects across the UK, US, EMEA, DACH and France during 2025, from 110 account executives. SDR cold calls were answered 13.3% of the time and AE calls to warm contacts 14.4%. Teams averaged 3.36 touches per prospect, with calls making up 57% of all tasks, LinkedIn 27% and email 15%.
Cognism attaches the caveat almost nobody else in this field does: “All data reflects Cognism’s internal outbound teams and may not generalise across all industries.” That single sentence is worth more than most of the statistics it sits underneath, and it is the correct way to publish first-party data.
Why these results cannot be averaged into one persistence benchmark
It is tempting to combine the surviving numbers into one cumulative reach curve, plot attempts one to twelve, and call it the answer. It cannot be done honestly, and the reason is the denominators.
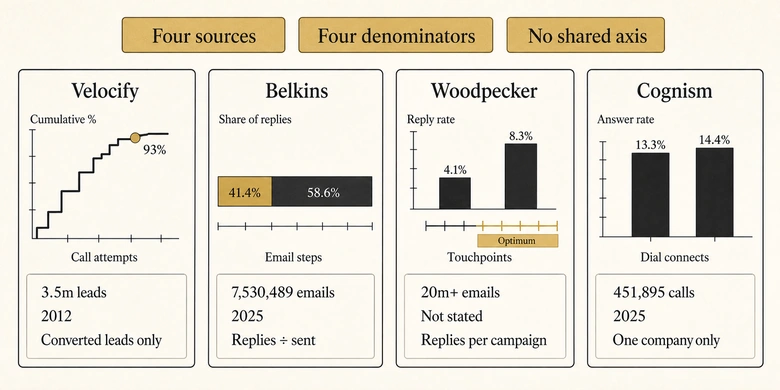
Velocify counts call attempts against leads that converted. Belkins counts scheduled email steps against emails sent. Woodpecker counts campaign touchpoints against campaigns. Cognism counts dials against prospects at one company.
That is four numerators, four denominators, three channels, and collection windows thirteen years apart. Averaging them produces a figure with no population behind it, which is the exact mechanism that generated the folklore this page is auditing.
What can be done is to plot each source separately, on its own axis, with its own sample and denominator printed alongside it. That is the honest version of the chart everyone wants, and the fact that the panels do not line up is the finding rather than a failure of the data.
Pro tip
Before quoting any persistence benchmark internally, ask one question: what happens to a lead that never converts in this dataset? If the answer is “it is not in the sample,” the number describes your closed-won history and cannot forecast your open pipeline. A reached lead also behaves differently from a cold one for reasons that have nothing to do with attempt count, which is covered in our analysis of the warm versus cold lead conversion multiplier.
How to build your own reach-by-attempt curve
Since no public dataset provides a reachability curve by attempt number, the only trustworthy version is the one you measure from your own CRM. It is a smaller job than it sounds, and the output is a benchmark that actually describes your market rather than someone else’s platform.
- Fix the denominator before you query anything. Decide whether you are measuring dials per lead, sequence steps per contact, or interactions before closed-won. Write the definition down first, because every disagreement about persistence data is really a disagreement about this.
- Count attempts per lead, not per campaign. Campaign-level averages hide the distribution completely. A team averaging four touches may be making one touch on most leads and twelve on a handful.
- Keep unreached leads in the sample. This is the single error that produced the 1942 ladder and the sixth-call statistic. If a lead that was never reached drops out of your denominator, your curve will describe your winners and forecast nothing.
- Split by channel before you interpret. A dial and a sequence step are not interchangeable units, and combining them is how incompatible benchmarks get created in the first place.
- State the collection window. Connect rates move with regulation, spam filtering and buyer behaviour. A curve without a date is a curve with a shelf life you cannot see.
- Publish the sample size next to the result. If the number is going to be quoted internally, it needs the same scope you would demand of an external study.
Run that once and you will have something none of the pages competing for this keyword can offer: a persistence benchmark with a known population, a known channel and a known date.
How to quote each statistic safely
These claims are not all unusable. Most become usable the moment they are stated with their scope. This register gives the safe wording for each surviving claim and names what it cannot support.
| Statistic | Safe wording | Cannot support |
|---|---|---|
| 93% by the sixth call | “In Velocify’s 2013 analysis of ~3.5m leads from 400+ companies, 93% of leads that eventually converted had been contacted within six call attempts.” | Your odds of reaching a lead on any given attempt; any claim about all leads |
| 58.6% of replies from steps 2 to 6 | “Across 7.5m emails sent in 2025, Belkins found that email steps two through six produced 58.6% of all replies.” | Phone or LinkedIn persistence; any close-rate claim |
| 4 to 7 touchpoints optimal | “Woodpecker, across 20m+ emails, reports campaigns performing best at four to seven total touchpoints.” | A universal cadence length; anything outside cold email |
| 13.3% cold call answered rate | “Cognism’s own SDR teams recorded a 13.3% answered rate across 451,895 calls in 2025, which the company states may not generalise.” | An industry connect-rate benchmark |
| 80% of sales on contacts 5 to 12 | “A 1942 survey of fewer than 40 members of one NSEA chapter reported 80% of sales occurring between the fifth and twelfth in-person visit.” | Any current B2B cadence recommendation |
| 8 touches to a meeting | “RAIN Group’s prospecting research, based on 488 buyers and 489 sellers, is the commonly cited source; the touch figure and fieldwork date are not published on its public page.” | Call attempts required to reach a prospect |
Methodology and revision history
We assembled 15 statistics circulating in the top results for this topic, including every claim reproduced in Google’s AI Overview for this query as of 1 August 2026. For each one we attempted to locate the original publisher, the publication year, the sample size, the channel measured and the population the percentage was calculated over, working backwards through the citation chain rather than accepting the first attribution encountered.
A claim is recorded as traced when the original publisher and its methodology could be opened and read; partially traced when the publisher is identifiable but key scope details sit behind a gate; misquoted when an original exists and the circulating figure or attribution differs from it; and untraceable when no original could be located by any route available to us.
Of the 15, six trace to an original study, one of which is misquoted in nearly every place it currently appears. One is partially traced. One is arithmetic performed on another claim. Seven could not be traced to any original at all. Seven of the fifteen disclosed a sample size, and only five disclosed when the underlying data was collected. IVRIS did not conduct any of the studies described on this page and does not present any figure here as its own measurement.
Two sources could not be opened from our verification environment on 1 August 2026: marketingdonut.co.uk failed DNS resolution on repeated attempts, and one widely referenced 2014 debunking returned HTTP 403. Neither is quoted here, and no claim on this page rests on either. Where a source could not be read, that is recorded as a limitation rather than filled with a secondary account.
Published 1 August 2026. This page will be revised as new first-party datasets are published or as any currently untraceable claim is resolved. The URL will not change.
DOWNLOAD THE LEDGER
Every claim above, with its publisher, sample, denominator and provenance verdict, is available as a spreadsheet: IVRIS Sales Follow-Up Source Ledger v1.0 (XLSX) or CSV. Free, ungated, reuse permitted with attribution.
Suggested citation: IVRIS Tech. “B2B Sales Follow-Up Statistics: Attempt-Number Source Ledger.” ivristech.com, 2026. https://ivristech.com/sales-follow-up-statistics/
Frequently Asked Questions
No published study supports a universal number. The widely quoted “five to twelve contacts” comes from a 1942 survey of fewer than 40 people measuring in-person visits. Modern data is channel-specific: Belkins found email steps two to six generate 58.6% of replies, and Cognism’s teams averaged 3.36 touches per prospect.
We could not trace it to any original study. The figure is credited to Marketing Donut or to Scripted, neither of which is a research publisher, and no sample size, methodology or fieldwork date has ever been published for it. The related “92% quit after four attempts” is the same ladder summed.
From a 1942 survey by the Long Island chapter of the National Sales Executives Association, now Sales & Marketing Executives International. It polled fewer than 40 members on the ratio of in-person visits to sales. SMEI publishes this provenance itself and cautions readers against relying on the numbers.
The original Velocify 2013 study says 93%, not 95%, and credits itself rather than InsideSales or Inc. It also applies only to leads that eventually converted, across roughly 3.5 million leads from 400-plus companies, so it describes converted customers rather than your chance of reaching a prospect.
No. The surviving sources use four different denominators across three channels, with collection windows thirteen years apart. Averaging call attempts against converted leads with email steps against emails sent produces a figure with no population behind it, which is how the current folklore was created.





