

Search lead to meeting conversion rate and page one hands you numbers between 1% and 70%. Every one of them comes from a publisher with a real dataset or a real audience. None of them is lying. They are measuring different things, and almost nobody on that results page says so.
Half the results are not even answering the question. Corporate Finance Institute, Salesforce, HubSpot and Lemlist all rank for this query while explaining lead-to-customer conversion, which is why you see 1-3%, 2-5% and 5-10% sitting next to the pages that actually measure meetings. The pages that do measure meetings report 62%, 66.7% and 4.6%. Those three are also incompatible with each other.
This page keeps the coordinates attached to the number. Every rate below travels with its lead definition, its motion, its meeting endpoint, its sample and its date, so you can tell in one glance whether a published figure is a fair comparison for yours or a category error waiting to be quoted in a board deck.
Direct answer — What is a good lead-to-meeting conversion rate?
There is no single defensible lead-to-meeting benchmark. Two large scheduling-platform datasets report roughly 62% to 66.7% of qualified inbound hand-raisers booking a meeting. Two outbound call datasets report about 4.6% to 4.82% of live conversations booking one. Those figures are not comparable with all-lead, MQL, dial or held-meeting rates. Before applying any published rate, match three things: the lead definition it starts from, the motion, and whether it counts booked or attended meetings.
Key Takeaways
- A lead-to-meeting benchmark is a coordinate, not a number. The same funnel honestly reports 44.3% or 64.0% depending only on which leads you put in the denominator.
- Chili Piper’s own published counts show the swing: 1,307,505 booked meetings read as 64.0% against qualified submissions and 44.3% against all submissions. That is 19.7 points of classification, not performance.
- Using RevenueHero’s published segment figures, the ranking inverts. Enterprise posts the best headline (70.1%) and the worst raw-funnel yield (about 20.2%), while SMB converts roughly 2.45 times more of its total inbound submissions into meetings.
- Booked and held are different events. The top-ranking definition of this metric, and Google’s AI Overview for it, currently mix the two inside a single formula.
- Outbound sits an order of magnitude lower because it starts somewhere else: about 4.6% to 4.82% from live conversations, and roughly 0.25% to 0.46% from dials.
- For paid, organic, referral, event and partner leads, no usable public lead-to-meeting benchmark exists. That absence is a finding, not a gap to fill with estimates.
What lead-to-meeting conversion rate actually means
Lead-to-meeting conversion rate is the share of leads that turn into sales meetings over a fixed period, calculated as meetings divided by leads.
Lead-to-Meeting Rate = Meetings ÷ Leads × 100The arithmetic is trivial. Both variables are undefined, and that is the entire problem. Every argument about what counts as a good rate is really an argument about what went into those two words.
The two words doing all the damage
“Lead” can mean a raw form fill that includes spam and personal Gmail addresses, or it can mean a qualified account that passed enrichment, ICP and persona checks before anyone counted it. Those two populations can differ by 30% of volume before a single meeting is booked. The qualification rules that sit between them are the same rules your scoring model applies when it decides which signals earn points, which is why two teams running identical campaigns can publish rates 20 points apart.
“Meeting” is worse, because the two candidate events look alike in a CRM and behave nothing alike in a forecast. RevenueHero’s top-ranking explainer writes the formula as “Number of Meetings Booked (or Held) ÷ Total Leads Captured × 100”. That parenthetical is not a convenience. Booked and held are separate counts with a documented gap between them, and a formula that accepts either produces a number nobody can reproduce.
Google has now amplified the error. Checked in July 2026, the AI Overview for this query describes the metric as the percentage of prospects who “book and attend” a sales meeting, then displays a formula whose numerator is Meetings Booked. A reader following that answer will measure attendance and report scheduling, or the reverse, and will not know which. AI Overviews change without notice, so treat that observation as dated evidence rather than a fixed property of the SERP.
State the unit of analysis before the rate
Beyond the two words, sources disagree on what they are counting units of. Chili Piper counts qualified accounts. RevenueHero counts form submissions. A survey respondent reporting an MQL-to-SQL rate is usually counting people. One buying group filing four demo requests is one account, four submissions and up to four people, and each choice moves the denominator. Those units follow the products rather than the reporting: a tool that resolves an inbound lead to an account before offering a slot will naturally count accounts, and the vendor documentation shows how differently the two resolve an inbound lead to an account.
So before you write a rate anywhere it might be quoted, record four things: the start event, the end event, the unit, and the exclusions. Whether your MQL threshold sits closer to a content download or a hand-raiser is exactly the ambiguity that makes the MQL-to-SQL handoff so hard to benchmark across companies, and it is the reason MQL-to-meeting rates travel badly.
Why the same funnel reports 20% or 70%
The denominator, not performance, explains most of the distance between published lead-to-meeting rates. Chili Piper is the only publisher that has released enough raw counts to prove it.
In its Demand Conversion Guide, Chili Piper states it analysed “2,948,575 form submissions, 2,042,453 qualified form submissions, and 1,307,505 booked meetings.” Those three numbers produce three legitimate and very different headlines from one dataset.
| Rate | Calculation | Result | What it describes |
|---|---|---|---|
| Qualification rate | 2,042,453 ÷ 2,948,575 | 69.269% | How much inbound survives the filters |
| Qualified → booked | 1,307,505 ÷ 2,042,453 | 64.016% | Booking performance after qualification |
| All submissions → booked | 1,307,505 ÷ 2,948,575 | 44.344% | What the whole inbound funnel actually yields |
IVRIS calculation from counts published by Chili Piper (2024 data, published 18 February 2025). Source-reported headline for the same cohort is 66.7%.
The same 1,307,505 meetings support a 64.0% claim and a 44.3% claim. The 19.7-point difference is classification, not output. Nobody booked another meeting.
Worth noting for anyone citing the round number: Chili Piper’s 2025 benchmark report headlines 66.7% qualified-to-booked, while the exact counts above yield 64.016%. The 2.684-point gap is unresolved in public. We preserve both figures rather than picking the one we prefer.
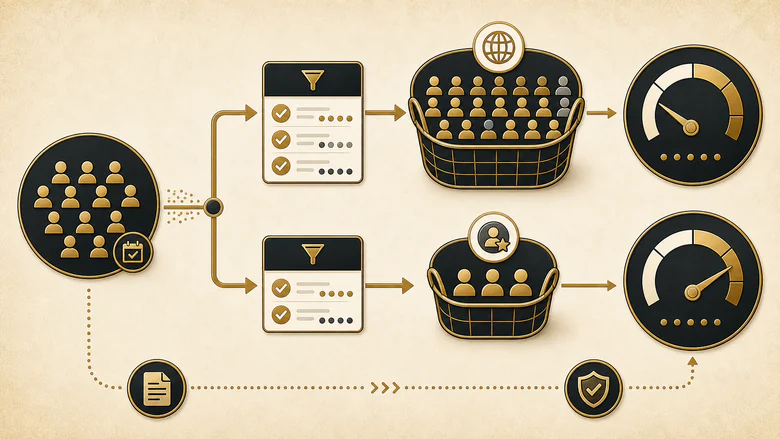
The segment ranking inverts once the denominator is fixed
RevenueHero’s 2026 industry benchmark article publishes both halves of the equation for each customer segment: “Enterprise-focused companies convert at 70.1% with a 71.2% disqualification rate. SMB-focused companies convert at 63.2% with a 21.8% disqualification rate. Mid-market sits at 61.2% with a 28.1% DQ rate.”
Because both inputs are published together, the second denominator is computable. When you carry the disqualified submissions back into the base, the published order reverses.
| Segment | Disqualification rate (reported) | Qualified share | Qualified → booked (reported) | All submissions → booked (IVRIS calculation) |
|---|---|---|---|---|
| Enterprise | 71.2% | 28.8% | 70.1% | 20.2% |
| Mid-market | 28.1% | 71.9% | 61.2% | 44.0% |
| SMB | 21.8% | 78.2% | 63.2% | 49.4% |
IVRIS calculation from figures reported by RevenueHero, 25 May 2026, drawn from its 2025 dataset of 1M+ inbound form submissions. Qualified share = 100% − disqualification rate. All submissions → booked = qualified share × reported rate.
The segment with the strongest published headline converts the smallest share of its total inbound. SMB turns roughly 2.45 times more of its raw submissions into meetings than Enterprise does, using the same publisher’s numbers. If you sell enterprise and benchmark yourself against 70.1%, you are comparing against a rate calculated after roughly seven in ten of your inquiries have been removed. That arithmetic repeats at every later boundary, which is why stage conversion has to be read as a chain rather than a single headline rate, with each denominator named before any two numbers are compared.
Two honest caveats travel with this calculation. It assumes the disqualification rate and the conversion rate are measured on the same submission cohort, which is how the article describes them, and RevenueHero has not published per-segment row counts that would confirm it. The 71.2% enterprise disqualification rate is also unusually high, and we have asked the publisher to confirm it. Treat the direction as solid and the decimals as provisional. The pattern itself is not surprising to anyone who has watched how much inbound an enterprise motion discards before a seller ever sees it.
The lead-definition taxonomy
A lead class is the exact population a conversion rate starts from. Eight of them appear in public benchmark writing, usually without labels.
| Code | Lead class | Operational definition | Comparison warning |
|---|---|---|---|
| L0 | Activity or audience record | A dial, an email sent, a visitor, an ad click, an event scan, a target account | Not a lead unless the source explicitly defines it as one |
| L1 | Raw inquiry | Any submitted form or captured contact | Includes spam, duplicates, personal email domains and out-of-market contacts |
| L2 | Valid lead | Raw inquiry after mechanical validity filters | Validity is not commercial qualification |
| L3 | Hand-raiser | Demo, pricing, contact-sales or chat request to speak with sales | Far higher intent than a content download or event scan |
| L4 | MQL | A marketing-defined threshold of fit, behaviour or intent | Not portable between organisations; can mean content-engaged or hand-raiser |
| L5 | Routed and accepted lead (SAL) | Delivered to and accepted for sales work | Process acceptance, not a booked meeting |
| L6 | Sales-qualified prospect | Sales confirms fit, need and next-step criteria | Some sources make the next step a meeting, others an opportunity |
| L7 | Outbound conversation | A prospect who answered and entered a substantive live conversation | A separate denominator; never equate to an inbound qualified lead |
The class that causes the most quiet damage is L5. Sales acceptance feels like progress and shows up as a stage change, but accepting a lead is a handoff, not an outcome, and a benchmark that stops there tells you nothing about whether a meeting happened. Where each of these classes sits relative to the others is mapped in the full B2B sales funnel; this page only handles the segment between a lead and a meeting.
The meeting-outcome taxonomy
A meeting class is the exact end event a conversion rate stops at. Six of them are in common use, and swapping any two changes the number materially.
| Code | Meeting class | Operational definition | Comparison warning |
|---|---|---|---|
| M0 | Requested | A prospect asks for or is invited to a conversation | No calendar commitment yet |
| M1 | Booked | A calendar event is created | May still cancel, reschedule or no-show |
| M2 | Confirmed | Invite accepted or manually reconfirmed | Still not attendance |
| M3 | Held | Both parties joined the meeting | Could be brief, unqualified or the wrong person |
| M4 | Completed | Meets duration, persona or discovery-quality rules | Requires explicit completion criteria |
| M5 | Opportunity-creating | Produced a qualified opportunity or accepted next step | A downstream outcome, not a meeting count |
Nearly every public benchmark stops at M1, because M1 is the event a scheduling tool can observe. Attendance is where the leakage lives. Operatix’s outbound model assumes 15 booked meetings produce 12 sat, a 20% dropout, and EngageTech reports 67% of its booked meetings were attended. Optimise M1 alone and you can raise the headline while shipping fewer conversations to your sellers.

Published lead-to-meeting benchmarks with compatible definitions
These are the public figures that survive a definition audit, each shown with the coordinate it belongs to. Rates in different coordinate rows must never be averaged or presented as one range. The rule generalises past conversion data, and budget benchmarks fail the same way when a $5 billion enterprise panel is averaged with early-stage startups to produce a single spend percentage.
| Coordinate | Source (year) | Start | End | Reported figure | Sample and population | Main limit |
|---|---|---|---|---|---|---|
| Qualified inbound → booked | RevenueHero (2025 report) | L3/L6 qualified submission | M1 booked | 62% median; 78%+ top 10%; 53% bottom quartile | 1M+ inbound submissions from platform customers | All customers use instant qualification and scheduling |
| Qualified inbound → booked | Chili Piper (2024 data) | L3 qualified submission | M1 booked | 66.7% reported; 64.016% from published counts | ~4M submissions, mostly B2B customer base | Scheduling-platform selection; per-customer rules vary |
| Raw inbound → booked | Chili Piper counts (2024 data) | L1 raw submission | M1 booked | 44.344% (IVRIS calculation) | 2,948,575 submissions | Only public raw-denominator figure available |
| High-intent inbound → booked | Operatix (2023) | L3 demo or meeting request | M1 booked | 75-85% | Agency experience, 500+ campaigns; row n not given | Practitioner range, not a measured study |
| Low-intent inbound → booked | Operatix (2023) | L0/L1 content, social, event | M1 booked | 5-10% | Same source, same limits | Broad channel grouping |
| Outbound conversation → booked | Gong (2024, mod. 2026) | L7 live conversation | M1 booked | 4.6% average; 16.7% top quartile | 300M+ cold calls on the platform | Rep and company counts not disclosed |
| Outbound conversation → booked | Cognism (2024) | L7 live conversation | M1 booked | 4.82% (254 of 5,265) | One company’s own sales team | Single-team dataset, not a market sample |
| Outbound dial → booked | Cognism counts (2024) | Dial | M1 booked | 0.456% (IVRIS calculation) | 254 meetings from 55,701 dials | Single team; no deduplication rules stated |
| Outbound dial → booked | Gong derived (2024) | Dial | M1 booked | 0.248% average; 2.221% top quartile (IVRIS calculation) | Derived from the same article’s connect and set rates | Within-source derivation only |
| Booked → held | EngageTech (2023) | M1 booked | M3 held | 67% | Own funnel; sample not disclosed | Company dataset, not a benchmark study |
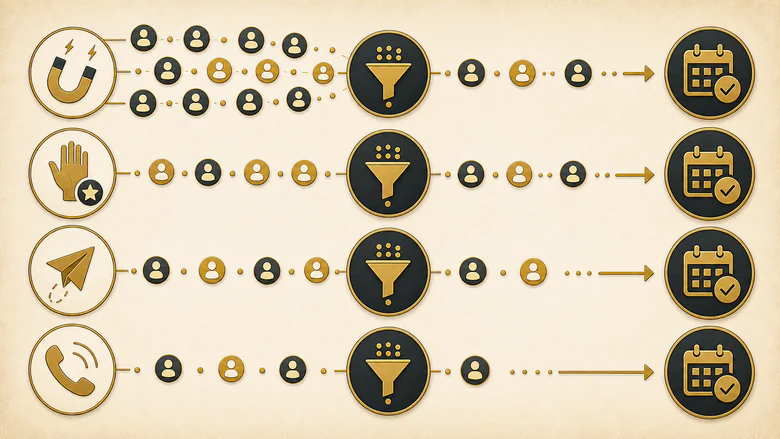
Qualified inbound hand-raisers to booked meetings
This is the coordinate the phrase “lead-to-meeting conversion rate” usually means online, and it is the best-evidenced one. Two large first-party datasets land in the low-to-mid 60s: RevenueHero reports a 62% median across more than a million inbound form submissions, and Chili Piper reports 66.7% across nearly four million.
Read them side by side, never as an average. Both are scheduling-platform customer bases, which means every company in them had already automated qualification and put a calendar in front of the buyer. These are performance envelopes for a specific operating model, not estimates of what the B2B market does. A company routing demo requests through a next-day email reply is not in either population.
Outbound conversations to booked meetings
Outbound reads an order of magnitude lower because it starts at a completely different event. Gong’s analysis of 300 million cold calls puts the meeting set rate at 4.6% for the average rep and 16.7% for the top quartile, measured from conversations. Cognism’s State of Cold Calling 2024 reports 254 meetings from 5,265 conversations, or 4.82%.
The values nearly touch, which is a useful reasonableness check and nothing more. One is a multi-customer platform aggregate; the other is a single company’s sales team. Publishing “4.7% is the outbound average” would invent a market statistic neither source supports.
Cognism is the more valuable of the two for a different reason: it publishes every stage count. From 55,701 dials came 9,247 connects, 5,265 conversations and 254 meetings, which lets the whole outbound ladder be derived from one internally consistent source, including a dial-to-meeting rate of 0.456%. Gong’s own figures, multiplied within the source, give 0.248% for the average rep and 2.221% for the top quartile. Gong’s 800-dial illustration checks out against that: 1.99 and 17.77 meetings, against the 2 and 18 the article prints.
This matters because a widely repeated figure of roughly 2.3% for dial-to-meeting is circulating on competing pages. That number is close to the top-quartile derived rate, not a typical one. Quoting it as an average overstates ordinary outbound performance by roughly nine times.
Booked to held meetings
Public show-rate evidence is thin. EngageTech’s 67% and Operatix’s implied 80% are the two usable reference points, and both are single-company figures with no disclosed sample or cancellation window. Use them to size the risk, not to set a target. Track your own booked-to-held rate for one full quarter before you trust any external number here.
Industry benchmarks: what the public data can support
Industry-level lead-to-meeting evidence exists, but it comes almost entirely from one study family. Reporting it as an industry average would misstate what the public record contains.
The same article publishes two sets of numbers that do not agree. Its prose names Construction Tech at 69.1% and Ecommerce at 68.8%; its summary rows put the same two categories at 70% and 66%. Rather than pick the tidier column, both are printed below so you can see the size of the divergence before you quote either one.
| Category | Median in summary rows | Figure in prose | Top 10th percentile |
|---|---|---|---|
| Construction Tech | 70% | 69.1% | 78% |
| Real Estate Tech | 66% | Not published | 83% |
| Ecommerce | 66% | 68.8% | 80% |
| IT Services | 66% | Not published | Not published |
| EdTech | 65% | Not published | Not published |
| Supply Chain / Logistics | 64% | Not published | Not published |
| Travel Tech | Not published | 68.3% | Not published |
| Sales Tech | Not published | 62.8% | Not published |
| Security / Compliance | 60% | Not published | Not published |
| Dev Tools | 55% | 55% | 67% |
| Data / Analytics | 55% | Not published | Not published |
All rows reported by RevenueHero (25 May 2026) from its 2025 dataset of 1M+ inbound form submissions by platform customers. Qualified submissions to booked meetings; median across all categories 62%. Per-category sample sizes and geography are not disclosed. Not independent industry averages.
The top-decile column is the more useful half for target-setting. Real Estate Tech spans 66% at the median and 83% at the top tenth, a 17-point range inside one category, which is wider than the gap between most categories. A sector label explains less about a plausible rate than the operating model inside the company does.
The same publisher also cuts the data by funding stage, and that pattern does not run the way most people would guess.
| Funding stage | Qualified submissions to booked meetings |
|---|---|
| Unfunded and seed | 63.6% |
| Series A | 53.6% |
| Series B | 55.3% |
| Series D and PE-backed | 66.8% |
Reported by RevenueHero (25 May 2026) from the same 2025 dataset. Stage sample sizes are not disclosed.
Conversion does not climb with funding. It dips ten points at Series A, recovers slowly, and only passes the seed-stage figure at Series D. A plausible reading is that seed companies field a small volume of high-intent inbound while Series A companies start buying traffic, but the dataset cannot separate volume from intent, so treat the shape as an observation rather than an explanation.
IMPORTANT
Every sector row published for this metric traces to one publisher’s customer dataset. Several ranking pages repeat those figures without attribution, which makes one study look like four. Repetition is not replication.
Channel benchmarks and the gaps in the public record
Channel evidence is plentiful upstream and almost absent at the meeting endpoint. The honest version of this table includes empty rows.
| Channel or motion | Direct lead-to-meeting evidence | What exists instead | Status |
|---|---|---|---|
| Inbound demo request | RevenueHero; Chili Piper | Qualified-to-booked, platform cohorts | Usable with caveats |
| Outbound cold call | Gong; Cognism | Conversation-to-booked, two datasets | Usable with caveats |
| Content or gated download | None | Operatix low-intent range of 5-10%, grouped | Directional only |
| Paid search and paid social | None | First Page Sage lead-to-MQL by channel; Ruler mixed conversion | No usable public benchmark found |
| Organic search | None | Lead-to-MQL 41% for SEO (different endpoint) | No usable public benchmark found |
| Events and webinars | None | CRM status definitions only, no rates | No usable public benchmark found |
| Partner and referral | None | Lead-to-MQL 56% for referrals (different endpoint) | No usable public benchmark found |
The tempting move here is to build the missing rows by multiplying First Page Sage’s lead-to-MQL rates by an MQL-to-meeting rate borrowed from somewhere else. Do not. The two studies use different populations, different MQL definitions and different periods, and the product of two unrelated rates is a fabricated statistic with a decimal point.
The intent gap inside those empty rows is real even though the rates are not. Operatix puts high-intent inbound at 75-85% and low-intent content and event leads at 5-10%, a spread consistent with what happens when warm and cold leads are measured against the same target. A blended 30% inbound rate usually means a mix of both, and the average describes neither.

Why published figures contradict each other
Six conflicts sit in the current public record for this metric. We publish them unresolved rather than picking a favourite.
| Conflict | What clashes | Most likely explanation |
|---|---|---|
| Chili Piper headline vs its own counts | 66.7% reported; 64.016% from 1,307,505 ÷ 2,042,453 | Different filters or periods behind the two publications; not reconciled in public |
| One publisher, two denominators | Same publisher gives 15-25% for “average teams” and a 62% median | The tiers count all leads captured; the median counts qualified submissions. Neither page says so |
| AI Overview endpoint error | Google describes “book and attend” while showing a Meetings Booked formula | The source formula itself accepts “Booked (or Held)” |
| Industry decimals vs rounded rows | 69.1% and 68.8% in prose; 70% and 66% in the summary rows on the same page | Possibly different groupings; publisher has not clarified |
| Show rates 67% vs 93.5% | EngageTech’s outbound 67% against a ~93.5% inbound figure quoted elsewhere | Inbound self-scheduled meetings and outbound-booked meetings are different populations |
| Own-stage rate vs cross-source composite | EngageTech’s own funnel gives 67% booked-to-attended, then a 71% new-lead-to-attended figure is built by averaging PhoneWagon, Reply and Kalungi | Separate populations and funnel stages averaged into one value; no single funnel ever produced 71% |
| Repetition read as confirmation | Several ranking pages quote the same RevenueHero figures | One evidence family, not multiple independent studies |
How to compare your own rate with a public benchmark
To compare your rate with a published figure, fix your own coordinate first, then find a source that shares it. Sources that do not share it are context, not comparison.
A worked example you can copy
One funnel of 1,000 inbound forms produces five different lead-to-meeting conversion rates, all of them arithmetically correct. Here is the same quarter measured five ways.
| Metric | Formula | Rate | What it diagnoses |
|---|---|---|---|
| Raw form → booked | 448 ÷ 1,000 | 44.8% | Traffic, validity, qualification and booking together |
| Qualified → booked | 448 ÷ 700 | 64.0% | Booking performance after qualification |
| Raw form → held | 336 ÷ 1,000 | 33.6% | Full hand-raiser-to-attendance yield |
| Qualified → held | 336 ÷ 700 | 48.0% | Qualification-to-attendance yield |
| Booked → held | 336 ÷ 448 | 75.0% | Show rate |
IVRIS illustration, not a dataset. The funnel is 1,000 raw forms, 700 qualified, 448 booked, 336 held. The first two stages are calibrated to Chili Piper’s published ratios (69.3% qualification, 64.0% qualified-to-booked); the 75% show rate is chosen for the example, because no public show-rate study for this cohort is reliable enough to model.
Quote 64.0% and you are describing how well the booking mechanics work. Quote 33.6% and you are describing what the quarter actually delivered to the sales team. Both are the same funnel. If someone hands you a lead to meeting conversion benchmark without saying which of these five they mean, the number cannot be checked. The problem compounds downstream rather than settling: the terminal funnel metric fails the same test even harder, with five denominators in public use and only two publishers on the first page of results willing to say which one they used.
The downloadable worksheet is a spreadsheet calculator for exactly this: enter your seven stage counts in Excel or Google Sheets, and all five rates plus the denominator spread calculate themselves, so you can see how far your own headline moves on classification alone.
The six-step comparison method
Workflow · 30 min
How to benchmark your lead-to-meeting conversion rate
Fix the five coordinates of your own rate, then compare only against public evidence that matches all of them.
Pick your start event and name its class
Choose one row from L0 to L7 and write it into the metric name. If you cannot decide between raw inquiries and qualified leads, report both rates rather than blending them.
Pick your end event and name its class
Choose M1 booked or M3 held, and track the other one alongside it. Reporting only M1 hides attendance loss; reporting only M3 hides scheduling performance.
Freeze your exclusions in writing
Record whether the denominator removes spam, duplicates, personal email domains, non-ICP accounts, routing failures and repeat submissions. Changing this list later changes the rate without changing the funnel.
Set a cohort window that lets meetings mature
Measure leads created in a fixed period and give them enough time to book and attend. A held-meeting cohort measured too early reports a fake decline.
Check segment size before you split the number
Do not publish a channel or industry rate built on a handful of meetings. Small denominators swing double digits on one booking.
Match all three coordinates before comparing
Start population, motion and meeting endpoint must all match the source. If any one differs, treat the published figure as context and use your own trend instead.
PRO TIP
Run your own numbers through both denominators before your next pipeline review. If your qualified-to-booked rate looks strong and your raw-to-booked rate does not, the gap is your qualification policy, and no amount of scheduling optimisation will close it.
Once the coordinate is fixed, the operational question is where the loss sits. Booking rates react hard to response time, and the interval between a form submission and a first meaningful contact is usually the largest controllable variable in the chain, which is why measuring each clock in the response chain separately tends to explain more of the gap than any benchmark comparison will.
Methodology, sources and revision history
IVRIS did not conduct any of the studies cited on this page. RevenueHero, Chili Piper, Gong, Cognism, Operatix, EngageTech, First Page Sage, Ruler Analytics and LeanData each own their own research, and each is linked to its original publication rather than to a recap. What IVRIS contributes is the classification, the compatibility rules, the contradiction analysis and the calculations, all of which are reproducible from the published inputs shown beside them.
How figures were scored and compared
Every figure is scored on five dimensions from 0 to 2: start population, motion or channel, meeting endpoint, period and cohort maturity, and population scope. Start population, motion and endpoint must each score 2 before two figures may appear in the same comparable range. Totals of 9-10 are directly comparable subject to source limits, 7-8 are comparable with explicit caveats and no pooled average, 4-6 are contextual only, and 0-3 are excluded.
Each source also earns one point per disclosed field: sample, population, data period, metric definition, methodology, and an accessible primary source. This measures disclosure, not credibility. A 6/6 survey can still be unsuitable for CRM-event benchmarking, and a 5/6 platform dataset can be precise but heavily selected.
What was excluded and what limits apply
Figures whose endpoint is not a meeting, secondary repetitions of another publisher’s dataset, composites built by averaging incompatible populations, and any figure whose primary source could not be opened and verified. One source, a CaliberMind PDF, was inaccessible during research and none of its numbers are used.
Two limits apply to everything above. The two strongest inbound datasets are both scheduling-platform customer bases, so they describe an operating model rather than a market. No source discloses geographic composition, so no country-level benchmark can be produced. Per-category sample sizes are unavailable everywhere, and no independent replication of the industry rows exists.
Citation, review date and revision history
Suggested citation: IVRIS, Lead-to-Meeting Conversion Rate Benchmarks, version 1.0, 23 July 2026. The full source ledger and the benchmark worksheet are published alongside this page so any figure here can be traced or recalculated.
Last reviewed: 24 July 2026. Revision history: v1.0, 23 July 2026, first publication; every source on this page re-opened and re-verified against its original publication on 24 July 2026 before release. Review cadence is quarterly for the SERP and link audit, six-monthly for source and calculation checks, and annually for a full refresh. An immediate revision is triggered when a source moves a rate by more than two percentage points, changes its denominator or endpoint, discloses row sample sizes, or goes offline.
Frequently Asked Questions
It depends entirely on where you start counting. For qualified inbound hand-raisers, two large platform datasets report 62% to 66.7% booking a meeting. For outbound live conversations, two datasets report 4.6% to 4.82%. From raw form submissions, the only public figure is 44.3%. Match the coordinate before judging your own number.
Divide meetings by leads over a fixed period and multiply by 100. The calculation is only meaningful once you specify which leads form the denominator, whether meetings means booked or held, and whether you are counting people, accounts or form submissions. Record all three beside the rate.
Report both. Chili Piper’s published counts show the same 1,307,505 meetings reading as 64.0% against qualified submissions and 44.3% against all submissions. The qualified rate measures booking performance; the raw rate measures what the funnel actually yields. Using only one hides either lead quality or execution.
Not for the same metric. Booked (M1) and held (M3) are separate events and should be reported separately. EngageTech reports 67% of its booked meetings were attended, and Operatix assumes a 20% dropout. Track booked-to-held as its own rate so scheduling gains do not mask attendance loss.
No defensible public benchmark exists. MQL is not a portable denominator: at one company it means a content download, at another a demo request, and those populations convert very differently. Build your own baseline by lead tier, and treat any published MQL to meeting rate as unverifiable.





