
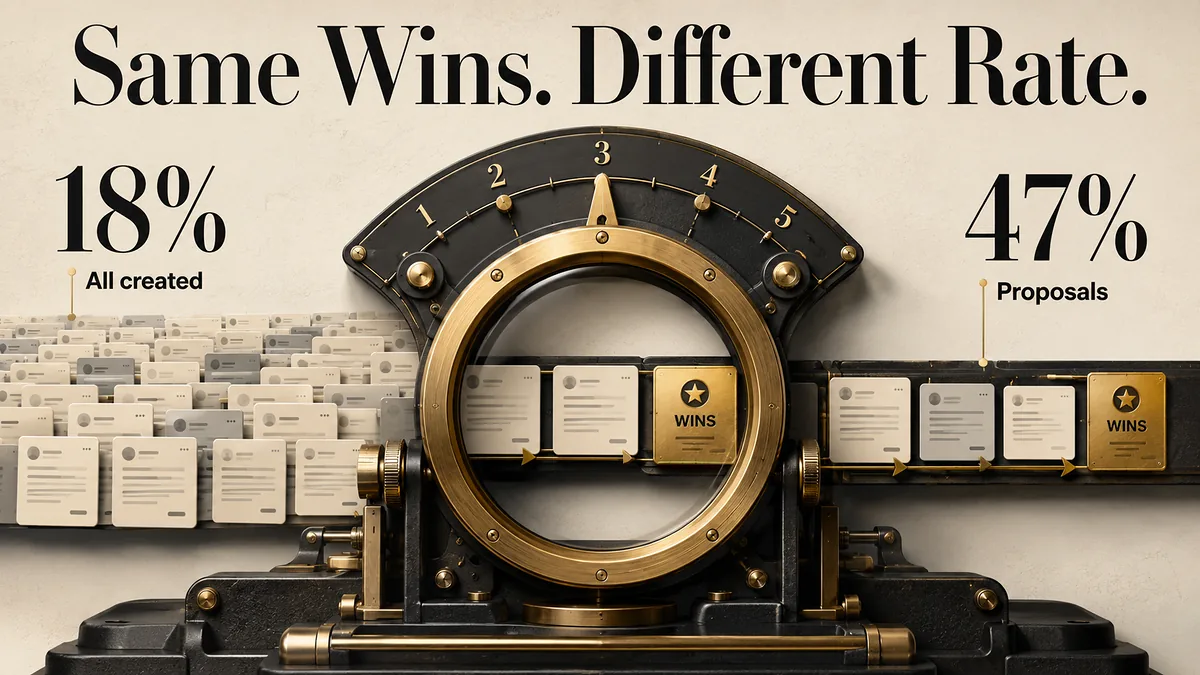
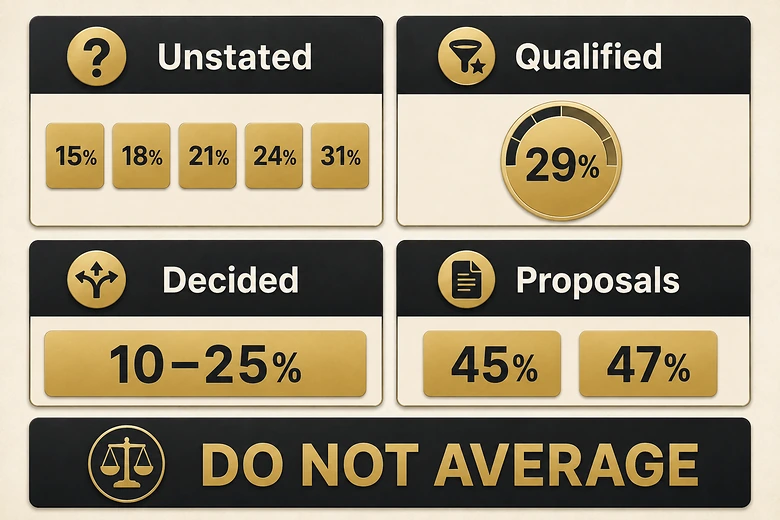
Search b2b win rate benchmarks and page one hands you 21%, 29%, 45% and 47%. Google’s AI Overview stacks several of them into a single band and calls a healthy rate 20% to 35%. Read four of the ranking pages and you will find four different numbers presented as the same fact.
None of those figures is fabricated. They are answers to different questions. One counts every opportunity a team created. One counts only the deals that passed qualification. One counts only the deals that got as far as a written proposal. Put a proposal-stage figure next to an opportunity-stage figure and you have manufactured a range that no market ever had.
This page does three things. It names the five denominators in active use and shows which published figure belongs to each. It ledgers every source on the first page of results with its sample, its population and whether it disclosed a denominator at all. Then it gives you the arithmetic to work out your own rate and the test for whether any benchmark you find can legitimately be compared with it.
Direct answer — What is a good B2B win rate?
A B2B win rate is the share of sales opportunities that closed won, measured against a defined set of deals. Published 2026 figures run from 21% to 47% because each divides by a different set. RAIN Group’s 47% counts only opportunities that reached a proposal. HubSpot’s 21% counts opportunities. Match the denominator before you compare, because it moves the number further than sales performance does.
Key Takeaways
- Five denominators are in active use. The same 180 wins read as 18% or 47% depending only on which deals sit underneath.
- RAIN Group’s 47% is a proposal-stage figure and says so in writing. Every page folding it into a “21% to 47%” range has dropped that sentence.
- The proposal world independently reports 45% on the same denominator, which is the strongest evidence that 47% is a real metric rather than an outlier.
- Of the twelve pages ranking for this term, two state which denominator they used, and the two disagree with each other.
- Google’s entire industry table traces to one consultancy’s unquantified impressions of its own client base.
- The most-quoted single figure, HubSpot’s 21%, describes 2023 and is being republished as a 2026 benchmark.
What a B2B win rate measures
A B2B win rate is the share of sales opportunities that closed won, expressed as a percentage of a defined set of deals. The definition is uncontroversial. Every argument on this topic is about the second half of that sentence.
Win rate = Opportunities won ÷ (Opportunities won + Opportunities lost + No-decision outcomes)Notice that the denominator is deliberately wide. It includes the deals that went nowhere, the ones where the buyer stopped replying, and the ones that died in a budget freeze. Those are real outcomes of real selling effort, and a rate that quietly drops them is measuring competitive skill rather than commercial results.
This is the opposite of the discipline most metrics need. For meeting attendance the honest move is to narrow the denominator until it contains only decisions someone actually made. For win rate the honest move is to refuse to narrow it, because every deal you remove was still a deal your team worked. Where the qualification bar sits determines what enters that denominator in the first place, which is why the gate that decides which leads sales formally accepts ends up setting your benchmark before a single deal is worked.
Five things are called “win rate”
Five unrelated metrics share the name win rate, and only one of them counts B2B sales opportunities. This matters more than it sounds, because the search results for the phrase mix all five, and so does anything trained on those results.
| What is counted | Denominator | Published figure | Source |
|---|---|---|---|
| Seller wins a B2B sales opportunity | Opportunities, qualified opportunities or proposals | 21% to 47%, source-specific | HubSpot, RAIN Group, Optifai |
| Bidder wins a submitted proposal or RFP | Formal bids and proposals pursued | 45% average, 43% the prior year | Loopio RFP Trends, via Bidara, 2025 |
| Trader closes a profitable trade | Trades executed | Professionals commonly run 30% to 55% | Trading education sources |
| Player or team wins a match | Matches played | 50% is the structural mean, not a benchmark | Arithmetic of symmetric matchmaking |
| Marketer converts a lead to a customer | Leads or MQLs created | Low single digits; usually called close rate | Stage conversion benchmarks |
IMPORTANT
In a symmetric game every win is someone else’s loss, so the average is 50% by construction. In trading, a 40% win rate can be highly profitable because payoff size matters more than frequency, and a 1:2 risk-reward ratio breaks even at 33%. Neither property holds in B2B sales. A benchmark borrowed from either discipline is describing a different mathematical object.
The second row is the one to sit with. Bid and proposal management is an established discipline with its own benchmark, measured against proposals submitted, and it reports 45%. Hold that thought until the ledger, because it explains the figure everyone treats as an outlier.
The five denominators in active use
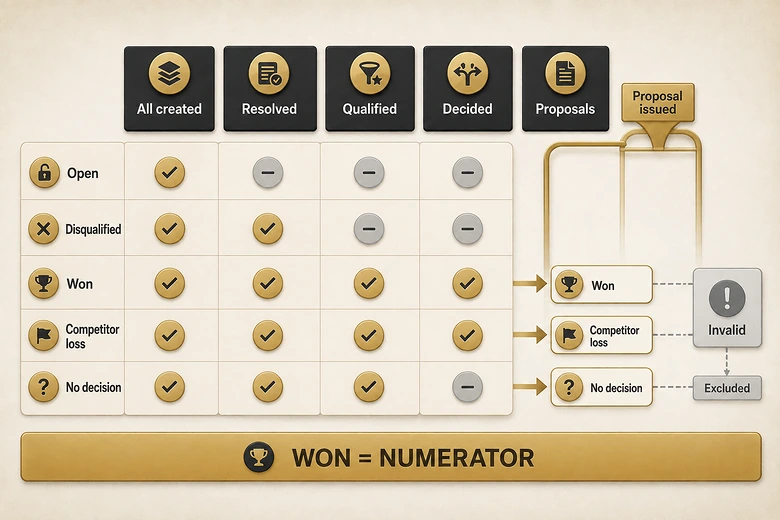
Win rate has five denominators in published use, and moving between them changes the headline further than any difference in selling ability does. This table is the decoder for everything that follows.
| Denominator | What sits underneath | What it excludes | Direction vs. all-opportunity | Which published figure uses it |
|---|---|---|---|---|
| All opportunities created | Every record opened in a cohort, resolved or not | Nothing; open pipeline is still counted | Lowest | None cleanly; usually asserted, rarely published |
| All resolved opportunities | Won plus lost plus disqualified | Deals still open | Slightly higher | Optifai’s deal-size bands, denominator not stated |
| Qualified opportunities only | Deals that passed a qualification gate | Everything disqualified before the gate | Higher | The 29% qualified-only figure |
| Closed won over closed won plus closed lost | Decided deals only | No-decision, stalled and open deals | Higher again | UpliftGTM, stated; Membrain’s 54% illustration |
| Proposals or quotes issued | Deals that reached a written proposal | Every deal that never got that far | Far highest | RAIN Group’s 47%, stated; the RFP world’s 45% |
| Forecast or commit category | Deals a rep called for the period | Everything outside the forecast | Unstable; internal reporting only | Nobody publishes it |
| Target accounts or buying groups | Accounts or groups worked, not deals | Accounts never touched | A different object entirely | Buying-group research, by group size |
| Revenue-weighted | Won revenue over resolved revenue | Nothing, but reweights by deal size | Can move opposite to all the others | Nobody publishes it |
Three of these deserve more than a row. The no-decision question is the largest single lever on the page: most CRM defaults file “no decision” under closed lost, which means a lot of teams believe they are reporting decided deals while actually reporting something wider. Cohort maturity is the second: a rate measured before its cohort resolves reads low for purely structural reasons, and that bias grows with the length of the sales cycle you are measuring across.
The third is revenue weighting, which is the only variant that can move in the opposite direction to all the others. Lose two large deals, win twenty small ones, and your count-based win rate rises while the revenue-weighted version falls.
Revenue-weighted win rate = Won ACV ÷ (Won ACV + Lost ACV)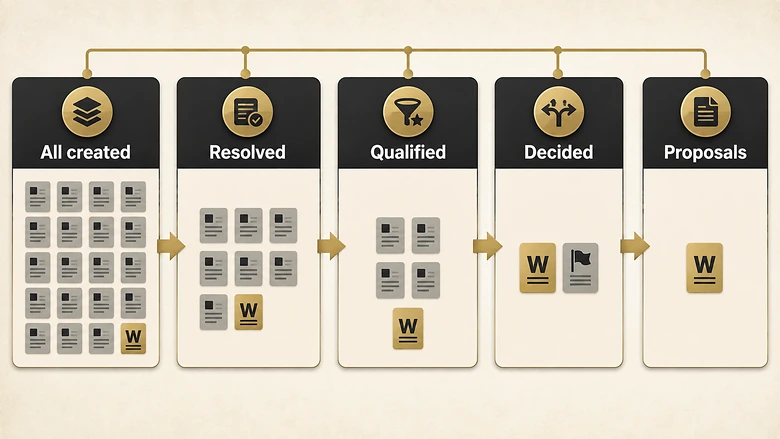
What the published numbers actually say
Restricting the field to pages that publish a figure with any traceable origin leaves twelve publishers and roughly five original datasets. The ledger below records what each one actually disclosed, not what it is quoted as saying.
| Source | Date | Sample | Population | Reported figure | Denominator as stated | Sells pipeline software? | Provenance verdict |
|---|---|---|---|---|---|---|---|
| RAIN Group | Updated Jun 2026 | n = 472 sellers and sales executives | Salesforces from 10 to 5,000+ sellers | 47% average; 62% top performers; 40% the rest (counts not published) | “The percent of opportunities proposed or quoted that the organization won” | No; sells sales training | Own survey. The only publisher whose denominator is quotable. |
| Optifai Pipeline Study | Data Q2 2025 to Q1 2026 | n = 939 B2B SaaS companies, expanded from 847 | B2B SaaS with deal-level CRM data | Median 31% under $10K ACV falling to 15% above $100K (counts not published) | Not stated | Yes | Own data. Bands and medians published; the denominator is not. |
| HubSpot Sales Trends Report | 2023 data, published 2024 | n = 1,000+ sales reps | Sales professionals, survey self-report | 21% (counts not published) | Not stated | Yes | Own survey. Three years old and still being republished as a 2026 benchmark. |
| UpliftGTM | Updated Apr 2026 | n not disclosed | “Benchmarks we see across our client base” | Six industry bands, 10% to 30% (counts not published) | “Closed-Won Deals / Total Closed Deals”, excluding open, disqualified and stale | Yes | Unquantified practitioner observation. Google’s AI Overview reproduces this table as the industry answer. |
| Champify Impact Report | 2025 | 230,000 former champions, 7,000 opportunities; subset behind the rates not stated | Customers of a job-change tracking tool | 37% with prior contact against 19% without (counts not published) | Not stated | Yes | Own data. The 19% is a no-prior-contact figure, widely requoted as an all-B2B average. |
| Landbase | 10 Apr 2026 | n not disclosed; credits “Optifai, 847” | B2B, unspecified | 21% all deals, 29% qualified only; four ACV bands (counts not published) | Described in prose, never defined | Yes | Recap. Credits 21% and 29% to another blog, and its ACV bands do not exist in the Optifai study it names. |
| Salesmotion | 17 Feb 2026 | n not disclosed; credits “Optifai, 847” | B2B SaaS | 20% to 35%; 21% credited to HubSpot; ~29% credited to nobody | Names two methods, mandates neither | Yes | Recap, and the origin point of the unattributed 29%. |
| Prospeo | Undated | n not disclosed; credits Optifai 939, RAIN 472 | B2B | Restates HubSpot, RAIN, Optifai and Champify | Separates all-opportunity from proposal-stage | Yes | Recap, and the most careful one. Still rounds RAIN’s elite tier up and drops its middle tier. |
| Kixie | 29 Jul 2024 | n not disclosed | Not specified | 47% credited to RAIN; 22% credited to Walnut | None. Renames RAIN’s metric “conversion rate”. | Yes | Recap. This is the hop where RAIN’s proposal denominator disappears. |
| ORM Technologies, Trellus, AgencyAnalytics, Forecastio | 2026 | n not disclosed | Not specified | “19% to 30%+”, “20% to 40%”, “below 25% is concerning” | Not stated | Yes | Unsourced summary ranges. Recorded as exclusions, not inputs. |
Twelve publishers, five original datasets, and not one of them publishes a numerator beside a denominator. Every figure on this results page is a percentage with no counts behind it, which means no reader can reconstruct any of them. Two publishers state which denominator they used, and the two state different ones.
What happens to a number on its way to the AI Overview
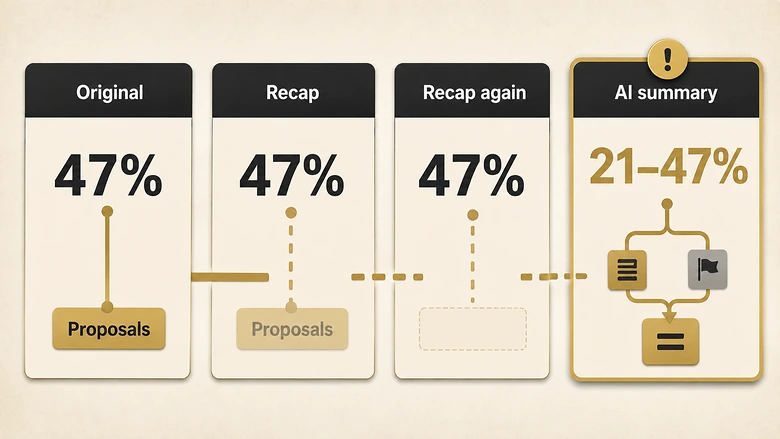
RAIN Group’s 47% is the cleanest figure in the set and the most badly handled. Trace it forward one hop at a time and you can watch the qualifier fall off.
| Hop | What it says | Denominator stated? | Date |
|---|---|---|---|
| RAIN Group, the original | “The percent of opportunities proposed or quoted that the organization won”, 47% | Yes, in the definition | Updated Jun 2026 |
| Kixie | “The overall average conversion rate (across various sales industries) is 47%” | No. The metric has been renamed. | Jul 2024 |
| Downstream recaps | 47% presented as a cross-industry win-rate benchmark | No | 2026 |
| Google AI Overview | 47% folded into a “21% to 47%” band beside opportunity-stage figures | No | Aug 2026 |
No step in that chain is dishonest. The population boundary simply falls off at each hop, and by the last one a proposal-stage figure and an opportunity-stage figure are sitting inside the same set of brackets. That is where “21% to 47%” comes from. It is not a market range. It is two metrics printed next to each other.
The corroboration makes it unambiguous. Bid and proposal teams, a separate discipline with no connection to RAIN, report an average RFP win rate of 45% measured against proposals pursued, up from 43% the year before, with enterprise at 47%. Two independent bodies of evidence measuring the same denominator land within two points of each other. RAIN is not an outlier. It is the only page on this results set measuring what the proposal world has been measuring all along.
One study, four sets of bands
The deal-size table that appears on four different sites comes from one study, and no two publishers reproduce it the same way. Optifai publishes it openly, with a sample and a data period, which makes the drift easy to measure.
| Publisher | Band boundaries used | Figures published | Sample cited | Reproduces Optifai’s bands? |
|---|---|---|---|---|
| Optifai, the original | <$10K · $10K to $50K · $50K to $100K · >$100K | Medians 31%, 24%, 18%, 15% | 939, Q2 2025 to Q1 2026 | Source of record |
| Prospeo | Same four bands | 31% and 15% quoted correctly | 939 | Yes |
| Salesmotion | Same four bands | 15% enterprise | 847, the superseded figure | Bands yes, sample stale |
| Landbase | <$50K · $50K to $250K · >$250K · >$1M | 25 to 35%, 18 to 28%, 12 to 22%, 10 to 18% | 847, credited to Optifai | No. These bands are not in the study. |
| UpliftGTM | <$25K · $25K to $100K · >$100K | 20 to 25%, 15 to 20%, 10 to 15% | None | No, and no source claimed |
The Salesmotion discrepancy is innocent: Optifai expanded the study from 847 companies to 939 and the recap froze at the earlier number. Staleness, not error.
Landbase is a different problem. Its four win-rate ranges track Optifai’s closely, but they have been re-bracketed onto ACV boundaries five to ten times larger, and the attribution to Optifai stayed attached. A $60,000 deal reads as 15% to 22% in the study and 18% to 28% in the recap. The “over $1M” band describes a segment the study never measured. The damage carries downstream too, because a team sizing its pipeline coverage target from a published band can be inverting a number that was silently rescaled somewhere upstream.
How the denominator changes the headline
Two teams with identical results can publish win rates of 18% and 47% without either of them being wrong. The cleanest way to see it is to hold the numerator still and change nothing but the set of deals underneath.
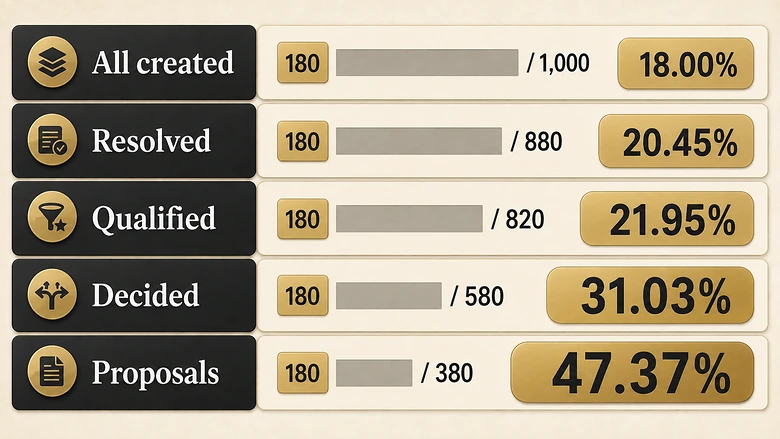
Take one quarter’s cohort: 1,000 opportunities created, 120 still open at measurement, 880 resolved. Of those 880, 60 were disqualified before reaching qualification, leaving 820 qualified and resolved. Of the 820: 180 won, 400 lost to a competitor, 240 lost to no decision. Of the 820, 380 received a written proposal.
| Denominator | Calculation | Reported rate | What it includes |
|---|---|---|---|
| All opportunities created | 180 ÷ 1,000 | 18.00% | Open pipeline and pre-qualification records |
| All resolved opportunities | 180 ÷ 880 | 20.45% | Deals disqualified before qualification |
| Qualified resolved opportunities | 180 ÷ 820 | 21.95% | The most commonly published basis |
| Decided deals, no-decision removed | 180 ÷ 580 | 31.03% | Competitive outcomes only |
| Proposals issued | 180 ÷ 380 | 47.37% | Only deals that reached a proposal |
A 2.6-fold spread, and not one deal behaved differently. This is an IVRIS illustration built from invented counts, so the arithmetic is reproducible and no external population is being represented. The point is the spread, not the numbers.
What the illustration does show is how little of the published disagreement needs explaining. The ladder lands on 21.95%, close to HubSpot’s 21%. It lands on 31.03%, close to Optifai’s 31% median for small deals. It lands on 47.37%, close to RAIN’s 47% and the proposal world’s 45%. A single unchanged cohort reproduces most of the spread that page one presents as a market disagreement.
Where the no-decision deals go
The largest single jump in that table is the fourth rung, and it comes from moving no-decision losses out of the denominator. Membrain works the same arithmetic on a round hundred: 35 won, 30 lost and 35 abandoned reports as 35% when every outcome counts and 54% when only wins and losses do.
IMPORTANT
That 19-point gap is not a measurement choice with two defensible answers. Membrain’s position, and ours, is that abandonment is an outcome of selling and belongs in the denominator. A rate that excludes it is answering “when buyers decided, how often did we win” — a real question, but not the one anyone means by win rate.
UpliftGTM is the only publisher on this results page that states its denominator excludes stale deals, which puts its industry bands on the 54% side of that split while everything around them sits on the 35% side. Nothing labels this in the search results.
Win rate by segment, with the denominator attached
Win rate benchmarks are only usable when the segment and the denominator travel together, so every row below carries both. There is no blended figure in this table and no column you can read across, because no two rows share a population, a denominator and a statistic type at once.
| Segment | Published figure | Denominator | Sample | Source and date | Never |
|---|---|---|---|---|---|
| Deal size · under $10K ACV | 31% median | Not stated; deal-level CRM outcomes | n = 939 companies | Optifai, Q2 2025 to Q1 2026 | Never compare with RAIN’s 47%, which counts proposals |
| Deal size · $10K to $50K ACV | 24% median | Not stated | n = 939 companies | Optifai, Q2 2025 to Q1 2026 | Never read as a range; the published range is 20 to 28% |
| Deal size · $50K to $100K ACV | 18% median | Not stated | n = 939 companies | Optifai, Q2 2025 to Q1 2026 | Never substitute Landbase’s 18 to 28%, which brackets $50K to $250K |
| Deal size · over $100K ACV | 15% median | Not stated | n = 939 companies | Optifai, Q2 2025 to Q1 2026 | Never extend to deals above $1M; no source measured that band |
| Company segment · SMB | 20 to 25% typical | Closed won over closed won plus closed lost, stale excluded | None disclosed | UpliftGTM, Apr 2026 | Never treat as measured data; it is a practitioner impression |
| Company segment · mid-market | 15 to 20% typical | As above | None disclosed | UpliftGTM, Apr 2026 | Never compare with Optifai’s bands; the denominators differ |
| Company segment · enterprise | 10 to 15% typical | As above | None disclosed | UpliftGTM, Apr 2026 | Never quote alongside the RFP world’s 47% enterprise figure |
| Industry · SaaS and software | 15 to 22% | As above | None disclosed | UpliftGTM, Apr 2026 | Never cite as research; Google’s AI Overview does |
| Industry · manufacturing | 18 to 25% | As above | None disclosed | UpliftGTM, Apr 2026 | Never cite as research |
| Industry · financial services | 12 to 18% | As above | None disclosed | UpliftGTM, Apr 2026 | Never cite as research |
| Industry · healthcare and life sciences | 10 to 16% | As above | None disclosed | UpliftGTM, Apr 2026 | Never cite as research |
| Source · prior contact at the account | 37% | Not stated | 7,000 opportunities, subset not stated | Champify, 2025 | Never read as a company-wide rate |
| Source · no prior contact | 19% | Not stated | 7,000 opportunities, subset not stated | Champify, 2025 | Never quote as “the average B2B win rate”; it is a cold-outreach figure |
| Motion · qualified opportunities only | 29% | Qualified opportunities | None disclosed anywhere | Salesmotion, Feb 2026, unattributed | Never cite; no publisher has claimed this figure as its own data |
| All B2B · self-reported | 21% | Not stated | n = 1,000+ reps | HubSpot Sales Trends, 2023 data | Never present as current; it describes 2023 |
| Proposals · all industries | 47% | Opportunities proposed or quoted | n = 472 sellers | RAIN Group, updated Jun 2026 | Never place in a range with opportunity-stage figures |
IMPORTANT
A pooled average across these rows is not calculable. They use different denominators, different populations, different statistic types and, in four cases, no disclosed sample at all. Any page publishing a single “average B2B win rate” has invented it.
How much each publisher actually discloses
Every page in the set was scored out of six on whether its figure can be audited: sample, population, period, denominator, method, and a reachable primary source. The score measures auditability, not research quality, and a low score is not an accusation of bad faith.
| Publisher | Sample | Population | Period | Denominator | Method | Primary source reachable | Score |
|---|---|---|---|---|---|---|---|
| RAIN Group | Yes | Yes | No | Yes | Partial | Yes | 4.5 / 6 |
| Optifai | Yes | Yes | Yes | No | Partial | Yes | 4.5 / 6 |
| HubSpot | Yes | Yes | Yes | No | Partial | Yes | 4.5 / 6 |
| Champify | Partial | Yes | No | No | No | Yes | 2.5 / 6 |
| UpliftGTM | No | Partial | No | Yes | No | No | 1.5 / 6 |
| Prospeo | No | No | No | No | No | Yes | 1 / 6 |
| Salesmotion | No | No | No | No | No | Partial | 0.5 / 6 |
| Kixie | No | No | No | No | No | Partial | 0.5 / 6 |
| Landbase | No | No | No | No | No | No | 0 / 6 |
| ORM, Trellus, AgencyAnalytics, Forecastio | No | No | No | No | No | No | 0 / 6 |
Of the twelve pages ranking for this term, two state which denominator they used. RAIN Group counts proposals; UpliftGTM counts closed deals with stale opportunities removed. Those two definitions cannot produce comparable numbers, and they are the only two definitions anyone published.
The uncomfortable result is that the highest-scoring source on the page is also the one most often flagged as an outlier, and the lowest-scoring source supplies Google’s industry answer. Auditability and citation frequency are running in opposite directions here.
How to calculate a win rate you can defend
To calculate a defensible win rate, pick a cohort that has fully resolved, separate no-decision losses from competitive ones, and publish the counts beside the percentage. The workflow below takes about three quarters of an hour with CRM report access.
Workflow · 45 min
How to calculate a win rate you can defend
Produces a win rate whose denominator is stated, so it can be compared against a published benchmark that discloses the same one.
Export every opportunity created in one closed cohort window
Pull from the CRM opportunity object, not the deal dashboard. Include created date, close date, stage, amount, close reason and segment. Group by creation date, never by close date.
Remove invalid and non-opportunity records
Delete duplicates, test records, renewals auto-created by billing, and anything outside the reporting scope. Count what you removed and report it separately as pipeline hygiene.
Confirm the cohort has resolved
Check what share of the cohort is still open. If more than a few percent remain, the window is younger than your sales cycle and every rate below it will read low.
Split every loss into competitive loss and no decision
Read the close reasons. Separate deals lost to a named competitor from deals lost to no decision, budget freeze or status quo. This step moves the answer more than any other.
Compute the rate on all five denominators
Divide wins by all created, all resolved, qualified resolved, decided-minus-no-decision, and proposals issued. Record all five. The gap between highest and lowest is your denominator sensitivity.
Publish the qualified-resolved rate as your headline
Report wins over qualified resolved opportunities as the standing figure, and print the numerator and denominator beside the percentage every time it appears.
Segment by deal size and motion before comparing anything
Compute the rate separately per ACV band and per motion. A blended figure moves on mix shift alone and hides both halves of the business.
PRO TIP
Run step five before you buy anything sold on the promise of raising win rates. If your five denominators span twenty points, the first thing to fix is which one you report, not the sales process underneath it.
Step six is a position rather than a description. Qualified-resolved is the rung that most published figures sit closest to, it survives changes in lead volume, and it does not let a team flatter itself by discarding the deals that stalled. Where the qualification bar sits is then the honest lever, and it is the same bar that governs which conversations count as real meetings earlier in the funnel.
How to check whether a benchmark applies to you
Run any published win rate through these ten checks before comparing it with your own. If tests four through seven cannot be answered from the source, do not compare, and do not average it with anything.
- Population. B2B sales opportunities, or proposals, trades, matches, or marketing leads?
- Segment. Which deal sizes, industries and motions are inside the sample?
- Cohort rule. Grouped by the date opportunities were created, or the date they closed?
- Cohort maturity. Had the cohort fully resolved when the rate was measured?
- Denominator. All created, all resolved, qualified resolved, decided only, or proposals issued?
- No-decision treatment. Are abandoned deals in the denominator, out of it, or unmentioned?
- Statistic type. Weighted mean, company mean, median, or a raw cohort rate?
- Unit. Counts of deals, or revenue-weighted?
- Recency. What period does the data describe, as opposed to when the page was updated?
- Source mix. Is this original data, or one dataset quoted by several pages?
Two rules follow. Never average a median with a mean, and never treat repeated citations of one dataset as independent confirmation. The second one is not hypothetical here: the deal-size table appearing on four sites is one study, and the “21% to 47%” range is one metric standing next to a different metric.
Test nine catches the quietest failure. HubSpot’s 21% describes 2023, was published in 2024, and is currently being reproduced by pages dated 2026 with no year attached. Nothing about those pages is inaccurate, and a reader still ends up benchmarking against a three-year-old self-report.
Method, sources and revision history
Evidence for this page was collected in August 2026 from public sources only, working from the first page of Google results for the primary keyword plus the sources those pages cite. IVRIS did not run any of the underlying studies, and each organisation retains ownership of its own research and statistics.
Sources were included in the ledger when the publisher disclosed enough to place the figure: a sample, a population, a data period, or a stated metric definition. Pages quoting precise ranges with no traceable original were recorded as exclusions rather than inputs, which is why several widely repeated percentages, including “20% to 40%” and “below 25% is concerning”, do not appear as ledger rows. Where a primary domain would not serve a direct request, the figure was confirmed through search results quoting the same publisher and that method is noted rather than hidden.
Three figures on this page are IVRIS calculations rather than reported findings, and all three are labelled where they appear: the five-rung denominator ladder, which uses invented counts; the disclosure scores, which apply a six-criterion rubric of our own to public pages; and the count of how many ranking pages state a denominator. The Ebsta and Pavilion “19%” that circulates widely is not ledgered here at all, because that figure has already been traced to secondary coverage rather than to the report itself.
Last reviewed: 9 August 2026. Revision history: v1.0, first publication, 9 August 2026. Suggested citation: IVRIS Tech, “B2B Win Rate Benchmarks: What Each Number Counts”, ivristech.com, 2026.
This page is reviewed when any ledgered publisher updates its figures, when a new original dataset appears, or every six months, whichever comes first. Corrections are welcome, particularly from any publisher whose denominator we have recorded as unstated when it is documented somewhere we did not reach.
Frequently Asked Questions
There is no single good number, because published figures use different denominators. Measured against qualified resolved opportunities, most published data sits in the low twenties. Measured against proposals issued, 45% to 47% is normal. Establish which denominator a benchmark uses before deciding whether your rate is healthy.
Divide opportunities won by the full set of resolved opportunities, including deals lost to no decision. Group by the date opportunities were created rather than closed, confirm the cohort has resolved, and publish the numerator and denominator beside the percentage so the figure can be checked.
It depends entirely on the denominator and the deal size. Thirty percent is strong for opportunities above $100K ACV, ordinary for small deals where the published median is 31%, and weak for a proposal-stage measurement where the benchmark is around 47%. The number alone carries no verdict.
Yes. Abandoned deals consumed selling effort and are an outcome of the sales process, so they belong in the denominator. Removing them can lift a reported rate by nineteen points on the same underlying deals. Track them as a separate no-decision rate as well, since they respond to different fixes.
Win rate is usually measured against opportunities, while close rate is often measured against leads or MQLs, which produces a far lower figure. The two are used interchangeably in published benchmarks, so check what sits in the denominator rather than trusting the label on the metric.
Mostly because they divide by different sets of deals. One unchanged cohort of 180 wins reports as anything from 18% to 47% depending on the denominator. The rest is explained by stale data, one dataset being quoted by several pages, and unsourced ranges circulating without any original behind them.





