

Ask ten revenue leaders what pipeline coverage ratio they run against and nine will say 3x. Ask where 3x came from and the room goes quiet. Somebody will say it is the industry standard. Somebody else will say their last company ran 4x. Nobody will say what it is derived from, because 3x is not derived from anything anymore. It is inherited.
Here is the part that should bother you. A 3x coverage target is not a rule of thumb. It is arithmetic with the working crossed out. Three times quota is precisely the amount of pipeline you need when you close a third of it. The rule encodes a 33% win rate. That is the whole of it. If your team does not close a third of qualified pipeline, and almost nobody does now, then 3x was never your number and carrying it forward is a forecasting error you repeat every quarter.
Direct answer — What is a good pipeline coverage ratio?
A good pipeline coverage ratio is the inverse of your own qualified win rate, adjusted for how much pipeline slips out of the period. Coverage equals open qualified pipeline divided by quota. The common 3x target assumes a 33% win rate; at a 20% win rate the same logic demands 5x, and at 15% it demands closer to 7x. Published benchmarks vary by source and definition, so derive the target from your own closed-won history rather than importing a figure.
Key Takeaways
- 3x is not a standard. It is 1 divided by a 33% win rate, and it stopped describing most B2B teams years ago.
- Inverting your win rate gets you closer but still understates the target, because it assumes every open deal resolves inside the period.
- The published replacements do not survive a provenance check: the widely quoted new-business and expansion split traces to an unnamed analyst with no retrievable report, and vendor deal-size bands contradict each other.
- New business and expansion need separate targets. One blended number overfunds the easier motion and starves the harder one.
- Coverage is a quarter-start measurement. It falls as the period runs, by design, and reading that decay as failure causes bad mid-quarter panic.
What is pipeline coverage ratio?
Pipeline coverage ratio is the value of open qualified pipeline divided by the revenue target it has to produce in a given period. A team carrying 4 million in open opportunities against a 1 million quarterly quota is running 4x coverage. It answers one question: is there enough in play to plausibly hit the number?
Pipeline Coverage Ratio = Open Qualified Pipeline ÷ Revenue TargetTwo definitional choices decide whether the output means anything. The first is what counts as pipeline: every open opportunity, or only those past a qualification gate. The second is which period the pipeline is measured against, and whether deals with close dates beyond that period are included in the numerator.
Teams rarely write these down, which is why two people in the same forecast call can quote different coverage figures from the same CRM and both be right. Fix the definitions before arguing about the target. The same denominator discipline governs every stage conversion rate you are tempted to benchmark, and it fails the same way when left implicit.
Where the 3x rule actually comes from
Run the arithmetic backwards and the rule explains itself. If you need one unit of closed revenue and you close a fraction W of what you carry, you need 1 ÷ W units of pipeline. That is the entire derivation.
Implied Win Rate = 1 ÷ Coverage TargetWhich means every coverage target you have ever been handed is a statement about win rate, whether or not the person handing it over knew that:
| Coverage target | Win rate it assumes | Who this actually describes |
|---|---|---|
| 2x | 50% | Warm renewals, single-stakeholder deals |
| 3x | 33% | The inherited default. Increasingly nobody. |
| 4x | 25% | Healthy mid-market new business |
| 5x | 20% | Competitive mid-market, committee-led |
| 6x | 17% | Enterprise with procurement and security review |
| 7x | 14% | Long-cycle strategic and displacement deals |
Nothing in that table is a benchmark. It is division. And it exposes the real failure of the 3x convention, which is not that 3 is the wrong integer but that a coverage target was ever expressed as a constant. Coverage is a function. Publishing it as a number strips out the only variable that matters.
3x is not a rule. It is the inverse of a 33% win rate. The rule never changed; the win rate did.
So the obvious correction is to find out what win rates are now and invert whichever one applies to you. That correction is right in principle. It is also where most of the advice on this topic stops, and it is not sufficient, for reasons the next two sections take in turn.
Why you cannot just swap in a better benchmark
The instinct is reasonable: if 33% is stale, find the current figure and divide by that instead. We went looking for the current figure. It does not hold up.
The most-cited source for the state of B2B selling is the Ebsta and Pavilion GTM Benchmarks, built on 655,000 opportunities and 2,000 revenue leaders. Across vendor blogs you will repeatedly see it cited for an average B2B win rate of 19%, down from 29%. That pairing is the load-bearing statistic under a lot of published coverage advice.
Ebsta’s own announcement of that report does not say it. What it reports is that win rates “improved from -18% in 2024 to -10% in 2025”, which is a year-over-year rate of change, not a share of deals won. The absolute 19% appears in secondary coverage, and the secondaries do not agree with each other: the same analysis that quotes 19% also quotes an average B2B win rate of 20 to 21%, and reports 76% of sellers missing quota where Ebsta itself publishes 78%.
IMPORTANT
A statistic that changes value between the primary source and its own citations is not a benchmark. It is a rumour with a footnote. Check whether the number you are dividing by appears in the report, or only in articles about the report.
The pattern repeats with the figure most often used to split coverage by motion. A widely reproduced benchmark puts required coverage at 3.5x for new business quota and 2.2x for expansion, with top-quartile teams at 4.2x. Traced back, it resolves to an aggregated benchmark listing that attributes it to an unnamed “industry analyst B2B Sales Benchmark” dated September 2023, with no publisher named and no link to the underlying study. There is no document at the end of that chain to read.
The deal-size bands fare no better, because the published ones contradict each other:
| Source | Enterprise or high-ACV guidance | Basis given |
|---|---|---|
| Outreach | 3–5x for enterprise motions | Deal complexity and cycle length, no dataset cited |
| Clari | 4–7x at 15–25% win rates | Derived from win rate, consistent with arithmetic |
| HubSpot | 3:1 to 5:1, extending to 6x | Presented as general practice, no citation |
| Various vendor guides | 2.5–3x under 25k ACV, 5–6x above 100k ACV | Restated across blogs, no primary study located |
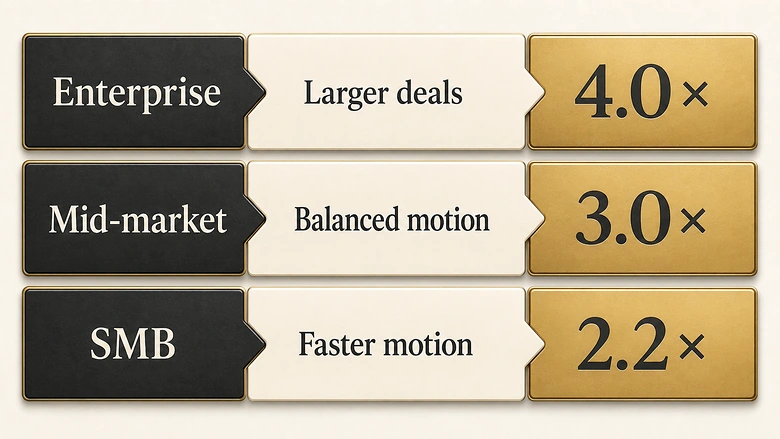
Read that table as a whole and the guidance for a six-figure enterprise deal ranges from 3x to 7x depending on which page you happened to open. That is not a benchmark disagreeing at the margin. It is a spread wide enough to double your pipeline requirement.
The one figure here that survives scrutiny is Clari’s, and it survives precisely because it is not a benchmark. It is the arithmetic, applied to a win-rate range. Which is the argument for deriving your own number rather than adopting anybody’s.
This is the same provenance problem that makes published sales cycle length benchmarks difficult to compare across sources, and the reason a cost per lead figure can vary by two orders of magnitude between reputable-looking publishers. When the definitions travel but the methodology does not, the number stops meaning anything.
Why inverting your win rate is still too low
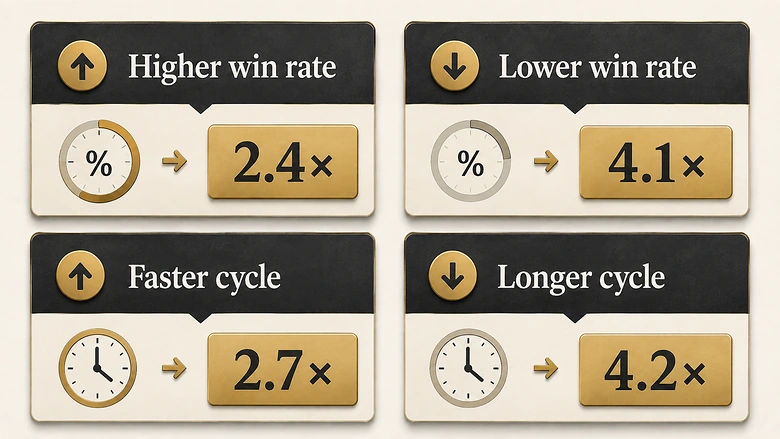
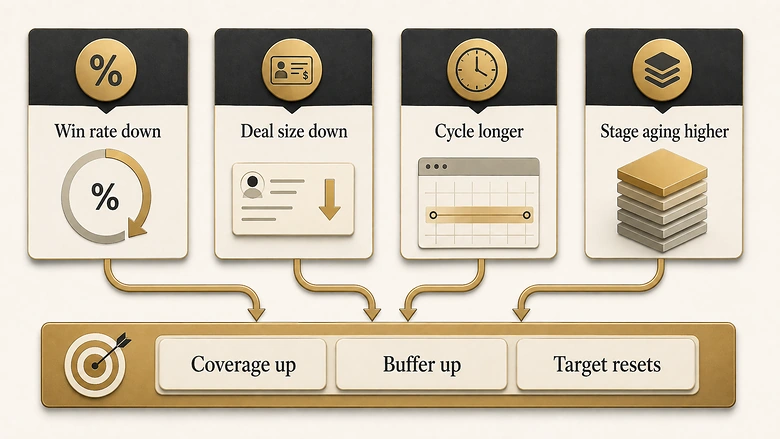
Assume you skip the published figures entirely and pull your own win rate. You are now ahead of most teams, and your target is still going to be short. Four corrections separate 1 ÷ W from a number you can run a quarter on.
1. Which win rate you used changes the answer by half
Win rate is not one metric. Measured against every opportunity ever created it produces one figure; measured against opportunities that passed qualification it produces a much higher one. The gap between those two denominators is routinely a factor of two, and the advice to “divide one by your win rate” almost never says which.
The rule that resolves it: the denominator of your win rate must match the numerator of your coverage. If coverage counts only qualified pipeline, the win rate must be qualified-stage win rate. Mixing them is how a team ends up confidently running 4x when the arithmetic wanted 7x. Getting the win rate denominator defined once and used consistently is worth more than any benchmark you could import.
2. Pipeline that slips does not cover this quarter
1 ÷ W silently assumes every open deal resolves inside the period: it wins or it dies. Real pipeline has a third outcome, and it is the most common one. Deals push. A deal that closes in week two of next quarter contributed nothing to this quarter’s number while sitting in this quarter’s coverage calculation the whole time.
So the honest divisor is not the win rate. It is the win rate multiplied by the share of pipeline that actually resolves in-period.
Required Coverage = 1 ÷ (Qualified Win Rate × In-Period Close Rate)Slip rates of 20 to 30% are ordinary in committee-led sales, and they scale with cycle length. Where the average cycle is long relative to the period, most of what you are counting was never going to land in time.
3. New business and expansion are different businesses
Expansion closes at a materially higher rate than new logo acquisition, and it now carries serious weight: Pavilion reports customer expansion accounting for 52% of new revenue. Two motions with different win rates cannot share one coverage target.
Blend them and the single number is wrong in both directions at once. It overfunds expansion, where you needed less, and starves new business, where you needed more. The aggregate looks healthy while the half that is hard to replace runs dry. Split the target, always.
4. Coverage decays inside the period, by design
A coverage target is a quarter-start measurement. As the period runs, deals close and leave the numerator while the quota denominator stays put, so the ratio falls. That decline is the system working.
Teams that check coverage weekly against a fixed target read that arithmetic as collapse and start discounting in week six to defend a number that was never in danger. Set the target for quarter start, then track against a declining expected curve rather than a flat line.
PRO TIP
Measure coverage at a fixed point each period, ideally day one, and hold that as the target. Mid-period readings are useful as a trend against last quarter’s same-day figure, never against the quarter-start number.
How to derive your own coverage target
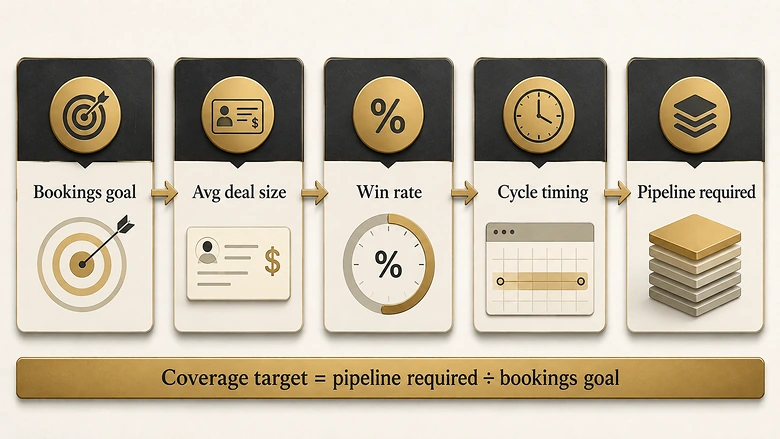
The inputs are four CRM queries and roughly ten minutes. Everything below comes out of your own closed-won history, which is the only dataset that does not have a provenance problem.
Workflow · 10 min
How to set a pipeline coverage target from your own win rate
Derives a defensible quarter-start coverage target from four fields in your CRM, replacing an inherited 3x convention with a number that reflects how your team actually converts and how much of its pipeline lands on time.
Pull qualified-stage win rate over four closed quarters
Count opportunities that passed your qualification gate and reached a terminal state. Divide closed-won by closed-won plus closed-lost. Use four quarters so seasonality and a single large deal cannot distort it. Record the qualification stage you filtered on; that definition is now binding on everything downstream.
Measure your in-period close rate
Take the opportunities open at the start of each of those quarters and calculate what share reached a terminal state before that quarter ended. The remainder is your slip. Expect 70 to 85% in-period resolution in committee-led sales, and verify rather than assume.
Split new business from expansion and repeat
Run steps one and two separately for new logo and for expansion or upsell. If the two win rates differ by more than a few points, they require separate coverage targets and separate pipeline goals. Do the same by segment wherever deal sizes differ enough to move the win rate.
Divide, then set it as a quarter-start gate
Divide 1 by win rate multiplied by in-period close rate for each motion. Multiply each target by its own quota to get a pipeline requirement in currency, not a ratio. Check it on day one of the quarter, and if you are short, the lever is pipeline generation now, not discounting in week six.
The output for common combinations, so you can locate yourself before running the queries:
| Qualified win rate | No slip (1 ÷ W) | 15% slips | 25% slips |
|---|---|---|---|
| 40% | 2.5x | 2.9x | 3.3x |
| 33% | 3.0x | 3.6x | 4.0x |
| 25% | 4.0x | 4.7x | 5.3x |
| 20% | 5.0x | 5.9x | 6.7x |
| 15% | 6.7x | 7.8x | 8.9x |
| 10% | 10.0x | 11.8x | 13.3x |
Read the 33% row and you have the whole argument in one line. That row is the inherited 3x rule, and it only produces 3x if nothing ever slips. Allow a realistic quarter of pushed deals and even a 33% team needs 4x. Everyone below that row has been running a target built for a business they do not have.
Get the model
The IVRIS Pipeline Coverage Target Model runs the same calculation on your numbers, with separate tabs for new business and expansion, a segment breakdown, and a quarter-start gate you can paste into a forecast deck. Free, no email required.
Weighted coverage, and the double-count that ruins it
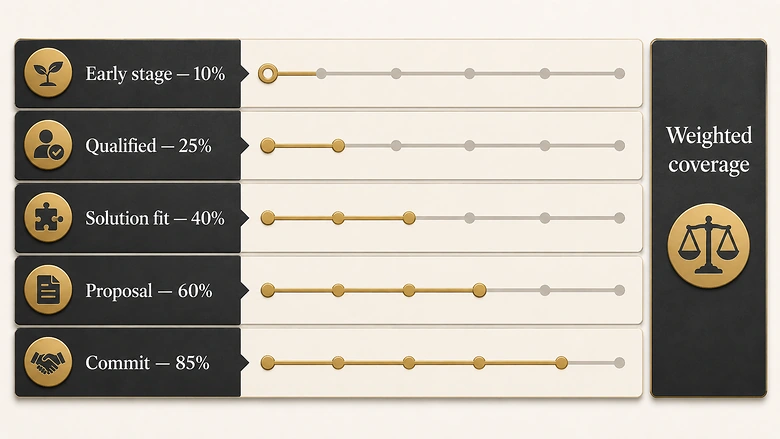
Weighted pipeline coverage multiplies each opportunity by its stage probability before summing, on the reasoning that a deal at proposal is worth more than one at discovery. Used carefully it is a better signal than raw coverage.
Used carelessly it discounts the same risk twice. Stage probabilities already encode the likelihood of winning. If you weight the pipeline by those probabilities and then divide by a target derived from your win rate, you have applied the same haircut in both places, and your target will be roughly 1 ÷ W too high.
IMPORTANT
Pick one. Either compare unweighted pipeline against a win-rate-derived target, or compare weighted pipeline against 1x, since correctly weighted pipeline should already approximate expected revenue. Running weighted pipeline against a 3x target is the most common version of this mistake.
There is a further problem: most stage probabilities in most CRMs are defaults nobody has revisited. If your proposal stage says 75% and your actual proposal-to-close rate is 40%, weighting makes the number worse, not better. Backtest the probabilities against closed history before trusting them.
What your coverage ratio is actually telling you
Once the target is derived rather than inherited, deviation from it becomes diagnostic. The direction of the miss points at different problems.
Materially below target is usually not a sales problem at all. It is a demand problem that surfaced one quarter late, and by the time coverage shows it, the window to fix it with pipeline generation has mostly closed. Coverage is a lagging indicator of demand and a leading indicator of revenue, which is exactly why it gets checked too late to act on.
Materially above target is rarely the good news it looks like. Coverage well above what the arithmetic requires usually means the pipeline contains deals that should have been disqualified: stalled opportunities nobody has closed out, deals with close dates pushed repeatedly, or opportunities that never met the qualification bar in the first place. A cleanup pass typically removes a meaningful share of it. Tightening the qualification handoff that decides what enters the pipeline prevents the inflation upstream.
Volatile quarter to quarter points at data hygiene rather than performance. If close dates and stages are not maintained, coverage measures record-keeping. Fix the fields first.
The coverage number itself does not tell you which of these you have. It tells you to go and look, which is the honest limit of what a single ratio can do. Pair it with stage conversion and cycle length before drawing conclusions, and treat coverage as the trigger for the investigation rather than its conclusion.
Frequently Asked Questions
Divide the total value of open qualified pipeline by the revenue target for the period. Four million in open opportunities against a one million quarterly quota is 4x coverage. Define which opportunities count as qualified and whether deals with close dates beyond the period are included, because both choices change the result.
The inverse of your qualified win rate, adjusted for slippage. At a 25% win rate that is 4x before slip and roughly 5.3x if a quarter of deals push. There is no universal good ratio, and published figures disagree widely enough that borrowing one is riskier than calculating your own.
It means carrying three times your quota in open pipeline. Mathematically it assumes you close a third of what you carry, since 1 divided by 3 is 33%. If your qualified win rate is below 33%, a 3x target understates what you need, and the shortfall grows as the win rate falls.
Use one or the other, never both. Weighted pipeline already discounts for win probability, so comparing it against a win-rate-derived target applies the same discount twice. Compare unweighted pipeline against your derived multiple, or weighted pipeline against 1x, and backtest your stage probabilities first.
They answer different questions. Coverage asks whether you have enough pipeline to hit a number; velocity asks how quickly pipeline converts to revenue. Use coverage for quarter-start planning and velocity for diagnosing where deals slow down. Coverage is the better early warning on a target you are about to miss.





