
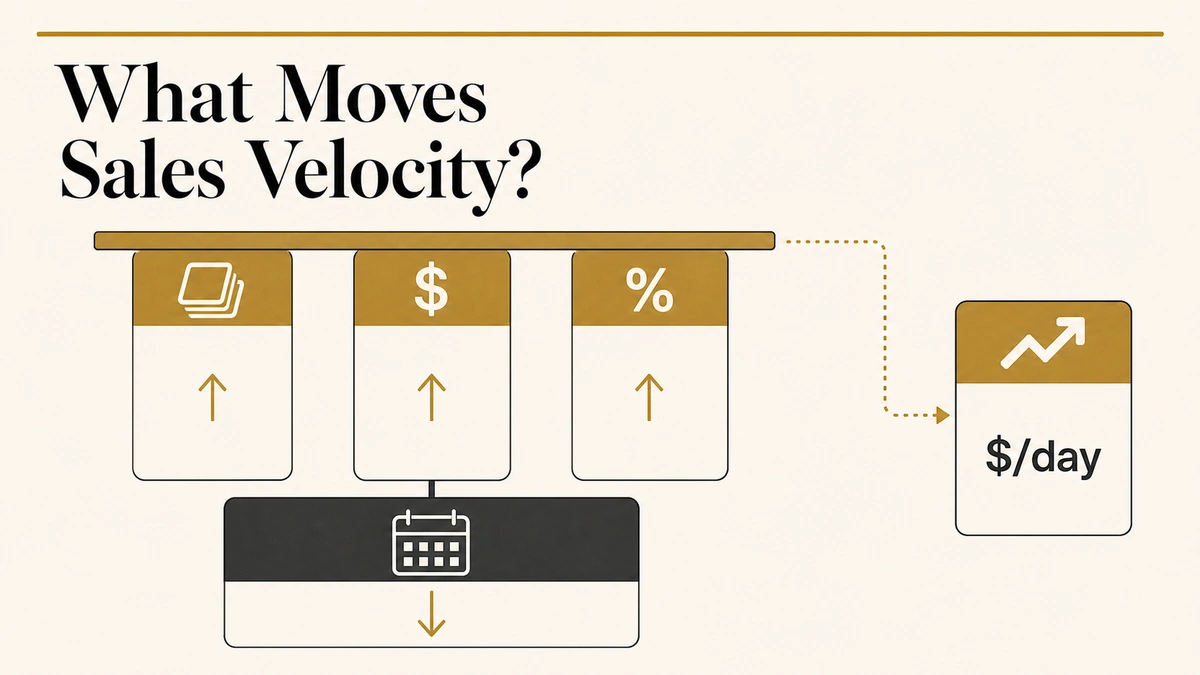
Four numbers go into the sales velocity formula, and every page that ranks for it publishes the same four. Almost none of them tell you which one to fix. That gap matters, because three of the four inputs move velocity in a straight line, one of them does not, and exactly one can push the number up while the business underneath it gets worse.
The arithmetic is easy. Reading it is the hard part, and reading it wrong is expensive. When revenue stalled, sales teams reached for the most obvious lever and generated more pipeline: pipeline generation rose 23% while revenue kept falling, according to Ebsta and Pavilion’s analysis of 4.2 million opportunities. They pulled the easiest lever. It was the wrong one.
So this page does the part the ranking pages skip. You get the formula, the input definitions that make your number comparable to anything, a sensitivity table showing what each lever is actually worth, and the segment-level read that finds the bottleneck. A spreadsheet model at the end does the maths so you don’t rebuild it.
Direct answer — What is the sales velocity formula?
The sales velocity formula is (Number of qualified opportunities × Average deal value × Win rate) ÷ Average sales cycle length in days, and it returns revenue per day. Every input must come from the same window on a stated basis: opportunities created rather than opportunities open, one deal-value basis, a win rate that counts no-decision outcomes, and a cycle length from a cohort that has fully closed. Blended across segments the number hides bottlenecks, so calculate it per segment.
Key Takeaways
- Sales velocity = (qualified opportunities × average deal value × win rate) ÷ average sales cycle length in days. The output is revenue per day.
- A 10% gain on opportunities, deal value or win rate each adds 10% to velocity. A 10% shorter cycle adds 11.1%, because it sits in the denominator.
- Opportunity count is the only input you can inflate while the business degrades, which is why velocity has to be read alongside win rate and cycle length, never on its own.
- Blended velocity is close to useless. A shift in segment mix can lift the blended number 20% while every underlying segment gets worse.
- There is no cross-company benchmark for a revenue-per-day figure. Compare against your own trailing four quarters and against your own segments.
What is the sales velocity formula?
The sales velocity formula measures how much revenue your pipeline converts per day. It multiplies the number of qualified opportunities by average deal value and win rate, then divides that by the average number of days it takes to close a deal. The result is a single rate: revenue per day.
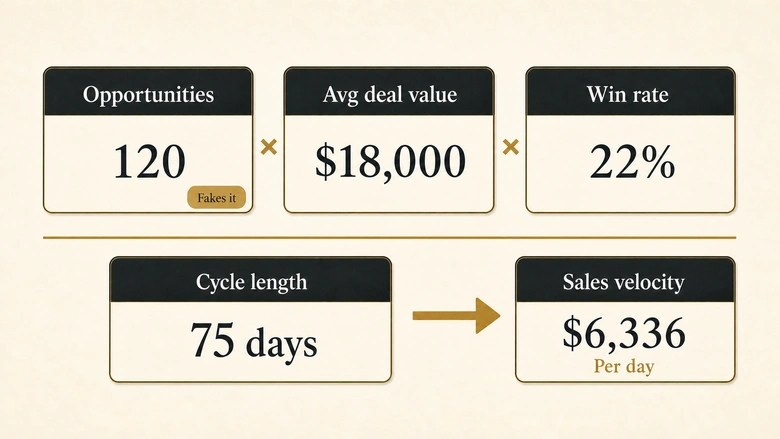
Sales Velocity = (Qualified Opportunities × Average Deal Value × Win Rate) ÷ Average Sales Cycle LengthWork it through with a mid-market example. A team creates 120 qualified opportunities in a quarter, at an average deal value of $18,000, wins 22% of them, and takes 75 days on average to close.
(120 × $18,000 × 0.22) ÷ 75 days = $6,336 per dayThat $6,336 is not a score. It is a rate, and its only real use is comparison: against the same team last quarter, or against another segment in the same business this quarter. Treated as a standalone number it tells you nothing, which is the same trap that catches every efficiency metric in the standard B2B metric set when it gets reported without its paired quality metric.
Sales velocity vs. pipeline velocity: which definition are you using?
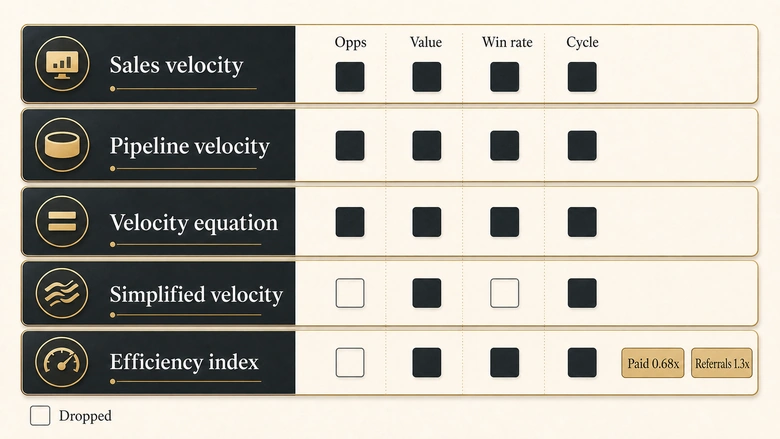
Sales velocity and pipeline velocity are the same arithmetic under two labels, but three other variants circulate under similar names and they are not interchangeable. Before you compare your number to anyone else’s, check which one they calculated.
| Name | Formula | What it drops | Use it when |
|---|---|---|---|
| Sales velocity | (Opportunities × Avg deal value × Win rate) ÷ Cycle length | Nothing | You are measuring a sales team or a rep and want revenue per day |
| Pipeline velocity | Identical to the above | Nothing | The same figure reported from the pipeline side, common in marketing and RevOps dashboards |
| Sales velocity equation | The same four metrics held apart, not reduced to one output | The single number | You want the four inputs as diagnostic levers rather than a headline rate |
| Simplified velocity | Revenue ÷ Cycle length | Opportunity count and win rate | Never for diagnosis. A move in the output cannot be traced to an input |
| Efficiency index | (Win rate × Avg deal value) ÷ Cycle length | Opportunity count, deliberately | Comparing channels or segments of very different volumes on equal terms |
That last row is worth borrowing. Ebsta and Pavilion use exactly this form to rank acquisition channels, and dropping opportunity count is the point: it stops high-volume channels looking efficient purely because they are big. On their index, paid came in at 0.68x the average and partner referrals at 1.3x, a spread you would never see in a raw velocity figure. IVRIS pages that report this metric use the pipeline velocity label, and it is the same calculation described here.
How to calculate sales velocity
To calculate sales velocity, fix a window, pull each of the four inputs on a stated basis inside that window, divide, then repeat the calculation per segment. The order matters: every definition you leave loose becomes a way for the number to move without anything real changing. So does the consistency of the stage timestamps behind steps four and five, and those are produced by the pipeline workflow your team actually runs rather than by the reporting layer sitting above it.
Workflow · 20 min
How to calculate sales velocity: the six-step pass
A single pass that produces a sales velocity figure you can defend, with every input pulled on one stated basis and the result recomputed per segment.
Freeze the measurement window
Pick one period, usually a quarter, and use it for all four inputs. Write the start and end dates down. Mixing a quarterly opportunity count with a trailing-twelve-month cycle length is the most common way the number gets quietly broken.
Count qualified opportunities created in the window
Filter on created date inside the window and on a written qualification bar, not on open pipeline today. Open-pipeline snapshots carry deals forward from earlier periods, so the count drifts with pipeline age rather than with performance.
Compute average deal value on one stated basis
Choose ACV or TCV and record which. Strip one-off services and multi-year prepayments out of the basis you did not choose. Report the median alongside the mean when a handful of large deals dominate the set.
Compute win rate on a decided-deals denominator
Divide deals won by every opportunity that reached a decision in the window, including no-decision and disqualified-late outcomes. Using won divided by won-plus-lost drops the largest loss bucket and inflates the rate.
Measure cycle length on a closed-out cohort
Define one start event and one end event, then measure only cohorts where nearly every deal has resolved. Averaging won deals alone is survivorship-biased, because the slow deals are the ones that slipped or died.
Divide, then recompute per segment
Produce the blended figure, then rerun all five steps for new business versus expansion, and for inbound versus outbound. The blended number is the headline; the segment numbers are the diagnosis.
The four inputs, defined precisely
Sales velocity fails as a metric when its inputs are defined loosely, because each loose definition creates a way for the output to move without any change in performance. These are the four definitions worth writing into your reporting spec. Writing them down is only half the job, because a reporting spec drifts unless one role owns it and the system it is read from is fixed alongside the definition.
Qualified opportunities
Count opportunities created inside the window that cleared a written bar, not everything sitting open in the CRM. The bar itself has to exist somewhere other than a rep’s judgement, which is why the metric depends on the same qualification gate that separates a marketing-qualified lead from a sales-qualified one. If that gate is undefined, the opportunity count is undefined too.
Average deal value
Pick ACV for recurring revenue or TCV for total contract value, then never mix them inside one calculation. Multi-year deals booked at TCV against an ACV baseline will lift velocity by 40% or more on their own while the actual run rate flattens.
Win rate
The denominator decides whether this number means anything. Ebsta’s 2024 analysis found 61% of lost deals were reported lost to indecision, so a win rate computed as won ÷ (won + lost) discards the single largest category of outcome and reads high. Count everything that reached a decision, and keep the stage definitions that determine when a decision has been reached stable across periods.
Sales cycle length
State one start event and one end event, then hold them. Opportunity-created to closed-won is a defensible pair. So is sales-accepted to signature. What is not defensible is measuring won deals only, because the slowest deals are the ones that slipped, and Ebsta found that late-stage deals slipping past two months saw win rates drop 113%. Someone has to own this definition, and in practice that ownership sits with whoever owns the rest of the revenue reporting spec.
Length is motion-specific too, so one divisor rarely covers a whole business. A committee-driven enterprise deal running nine months and a 30-day mid-market deal cannot share an average and stay meaningful, which is the argument for the segment view in the section after next.
| Input | Common loose definition | Definition that holds up | What breaks otherwise |
|---|---|---|---|
| Qualified opportunities | Everything open in the pipeline right now | Opportunities created in the window that cleared a written bar | Deals carry across periods, so the count tracks pipeline age not performance |
| Average deal value | Whatever the CRM amount field holds | One basis, ACV or TCV, stated and applied consistently | A few multi-year deals inflate the average and mask a flat run rate |
| Win rate | Won ÷ (won + lost) | Won ÷ all opportunities that reached a decision, no-decisions included | Drops the largest loss category and reads high, so velocity looks better than it is |
| Sales cycle length | Created to closed-won, won deals only | One stated start and end, measured on a cohort that has fully resolved | Survivorship bias: the slow deals are excluded, so the divisor is too small |
Which lever moves velocity most
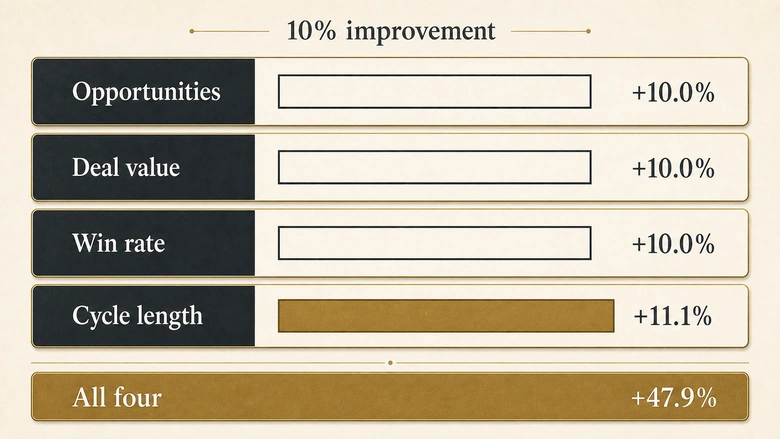
Three of the four inputs sit in the numerator and move velocity proportionally. Cycle length sits in the denominator, so improving it returns more than the improvement itself. A 10% shorter cycle is worth 11.1%, a 30% shorter cycle is worth 42.9%, and halving the cycle doubles velocity.
| Improvement | Effect on velocity: opportunities, deal value or win rate | Effect on velocity: cycle length |
|---|---|---|
| 5% | +5.0% | +5.3% |
| 10% | +10.0% | +11.1% |
| 20% | +20.0% | +25.0% |
| 30% | +30.0% | +42.9% |
| 40% | +40.0% | +66.7% |
| 50% | +50.0% | +100.0% |
The levers also compound. Improving all four by 10% does not add 40%; it multiplies to 1.1³ ÷ 0.9, which is a 47.9% gain. On the worked example above, $6,336 per day becomes $9,371. Four modest, achievable moves beat one heroic one, which is the opposite of how most velocity projects get scoped.
Real-world data confirms the ranking. Ebsta and Pavilion’s 2025 benchmarks, drawn from 655,000 opportunities worth $48 billion, report an 11x velocity gap between top and low performers and decompose it into all four inputs at once.
| Input | Top performers vs low performers | Multiplier on velocity |
|---|---|---|
| Deal count | 2.64x more deals | 2.64x |
| Average deal value | 76% higher | 1.76x |
| Sales cycle length | 42% shorter | 1.72x |
| Win rate | 43% higher | 1.43x |
| Combined | ≈11x | |
Deal count looks like the biggest multiplier, and this is where the metric gets misread. Top performers do not carry 2.64x more deals because they added volume indiscriminately; the same dataset shows they are 24% more likely to disqualify non-ICP deals early. Fullcast’s 2026 benchmark, built on operational data from 361,000 opportunities and $78 billion in pipeline, puts it plainly: teams holding a manageable number of deals are 57% more likely to close than teams juggling too many at once.
IMPORTANT
Opportunity count is the only input that can be inflated on demand. Add unqualified opportunities and the numerator rises immediately, while win rate falls and cycle length stretches over the following two quarters. Velocity can print higher for a quarter while the pipeline underneath it rots.
That asymmetry is why cycle length is usually the better first target, even though it is harder to move. Two of the cheapest interventions are at the front: response time, where speed to lead compresses days out of the earliest stage, and next-step discipline. Gong Labs, analysing 28,833 closed deals, found the fastest-closing quintile spent 53% more time on next steps in the first meeting, while 26% of introductory meetings never discussed next steps at all and close rates fell 71% when they did not. Further down the funnel, the handoffs and stage transitions that eat calendar days are the ones worth automating out of the pipeline.
Bottleneck analysis: why blended velocity hides the problem
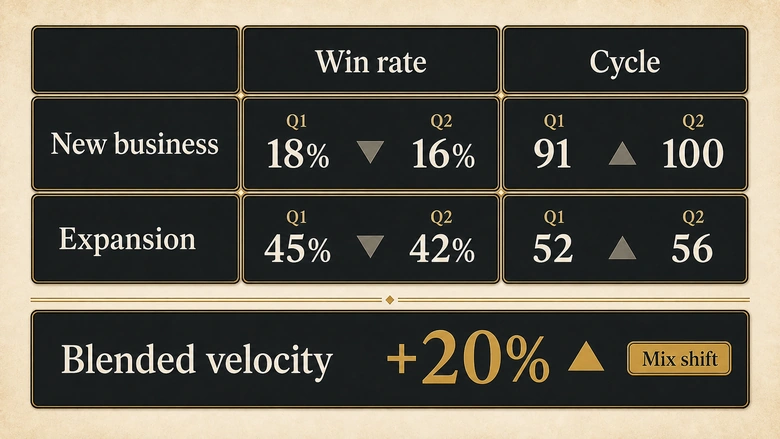
A single blended velocity figure can rise while every segment inside it deteriorates. This is not an edge case; it is what happens whenever segment mix shifts toward the faster-converting segment, and B2B mix has been shifting that way. Ebsta and Pavilion report expansion at 52% of new revenue, with expansion deals closing at a 45% win rate in 52 days against 18% in 91 days for new business.
Here is the trap in numbers. Both segments get worse on win rate and cycle length between quarters, and the blended figure still climbs 20%.
| Segment | Period | Opps | Avg deal value | Win rate | Cycle | Velocity per day |
|---|---|---|---|---|---|---|
| New business | Q1 | 100 | $20,000 | 18% | 91 days | $3,956 |
| New business | Q2 | 60 | $20,000 | 16% | 100 days | $1,920 |
| Expansion | Q1 | 20 | $12,000 | 45% | 52 days | $2,077 |
| Expansion | Q2 | 60 | $12,000 | 42% | 56 days | $5,400 |
| Blended | Q1 | 120 | $18,667 | 22.5% | 84.5 days | $5,964 |
| Blended | Q2 | 120 | $16,000 | 29.0% | 78.0 days | $7,138 |
Read the blended row and the business looks healthier: win rate up from 22.5% to 29%, cycle down from 84.5 to 78 days, velocity up 20%. Read the segments and new-business velocity has halved, both win rates have fallen, and both cycles have lengthened. Nothing improved. The mix moved.
The fix is procedural rather than clever. Calculate velocity for every segment where the four inputs differ materially, which usually means new business against expansion, inbound against outbound, and one cut by deal-size band. Then read the blended figure last, as a summary, never as a diagnosis. High-ACV committee deals need their own line for the reason set out earlier: their divisor has nothing in common with a mid-market deal’s.
PRO TIP
When blended velocity and segment velocity disagree, check the opportunity mix before you check anything else. If the share of opportunities in your fastest segment moved by more than a few points, the blended change is mix, not performance.
What is a good sales velocity number?
There is no good sales velocity number in absolute terms. The metric is denominated in revenue per day, so it scales directly with company size, deal size and segment mix, and a figure that would be excellent for a 20-person team would signal a crisis at a 500-person one.
Why cross-company benchmarks do not transfer
Published averages for sales velocity blend populations that cannot be blended. The Ebsta and Pavilion dataset alone spans deal sizes from under $10,000 to over $1 million across eight industries and five company-size bands. A median across that range is an arithmetic fact about the sample, not a target for any company in it. Most of the “average sales velocity” figures in circulation also trace back to a single unlinked claim that gets republished without methodology, which is a reason to discount them rather than to chase them.
Compatibility is the deeper problem, and it applies to any funnel benchmark, not just this one. Two teams reporting different velocity numbers usually differ on input definitions before they differ on performance, exactly the way published demo conversion benchmarks stop agreeing once you check which denominator each one used.
What to compare against instead
Index your own velocity to a base quarter and track the series. Eight quarters at base 100 will show you a trend that no external benchmark can. Then compare segments and reps inside your own business, where the definitions are shared by construction: that is the comparison Ebsta’s 11x figure actually makes, and it carries information precisely because both sides came out of the same CRM. The same logic governs any stage-level conversion rate you are tempted to benchmark externally.
When velocity is the wrong metric
Use sales velocity when you have enough closed deals per period for the averages to mean something, roughly 30 and up, and when opportunities exist as discrete records with stage timestamps. Use pipeline coverage instead when the question is whether you have enough pipeline to hit a number rather than how fast it converts. Avoid velocity altogether in three situations: deal volumes low enough that one large win swings the average, cycles long enough that no recent cohort has closed out, and self-serve or product-led motions where there is no opportunity object to count. Insurance and retail teams hit the third case often and are usually better served by revenue per active period.
The data-quality floor
Every input here is a CRM field, so the metric inherits your CRM’s accuracy. Ebsta found 44% of the contacts sellers interact with never reach the CRM at all, 26% of those missing contacts are decision-makers, and 17% of the contacts that do exist carry out-of-date titles or phone numbers. If stage timestamps and close reasons are that unreliable, a velocity figure is measuring record hygiene, not the sales motion. Fix the fields first, then trust the rate. That ceiling is not specific to velocity either, because the same record gaps put a ceiling on any forecast accuracy figure computed from a frozen stage snapshot.
Get the model
The IVRIS Sales Velocity and Bottleneck Model runs everything on this page: the four-input calculator, the sensitivity ranking, the segment view with a mix-shift flag, an eight-quarter indexed trend, and the input-definition contract on its own tab. It is a spreadsheet, so you can point it at your own CRM export today. If you would rather build it yourself, the core cell is =(B2*B3*B4)/B5 with opportunities, deal value, win rate as a decimal, and cycle length in days in B2 through B5.
Frequently Asked Questions
Multiply the number of qualified opportunities created in your measurement window by the average deal value, multiply that by your win rate, then divide by the average sales cycle length in days. Use one window and one stated basis for every input. The result is revenue per day, so recompute it per segment before drawing conclusions.
There is no cross-company benchmark worth chasing. Sales velocity is denominated in revenue per day, so it scales with company size, deal size and segment mix, and published averages blend populations that are not comparable. Judge it against your own trailing four quarters, indexed to a base period, and against other segments inside your own business.
Sales velocity ratio is not a standardised metric. In practice it means one of two things: velocity expressed as an index against a prior period, or the ratio between two groups’ velocity, such as Ebsta’s finding that top performers generate 11 times more revenue per day than low performers. State which one you mean.
In sales, velocity is quantity divided by time: (opportunities × average deal value × win rate) ÷ sales cycle length in days. The numerator is the revenue a cohort of opportunities is expected to produce and the denominator is how long it takes. Shortening the denominator raises velocity faster than lifting any single numerator input.
Sources: Ebsta and Pavilion, 2025 GTM Benchmarks Report (655,000 opportunities, $48bn); Ebsta and Pavilion, 2024 B2B Sales Benchmarks (4.2m opportunities, $54bn); Fullcast 2026 Revenue Benchmark Report (March 2026, 361,000 opportunities); Gong Labs sales cycle analysis (28,833 closed deals).





