
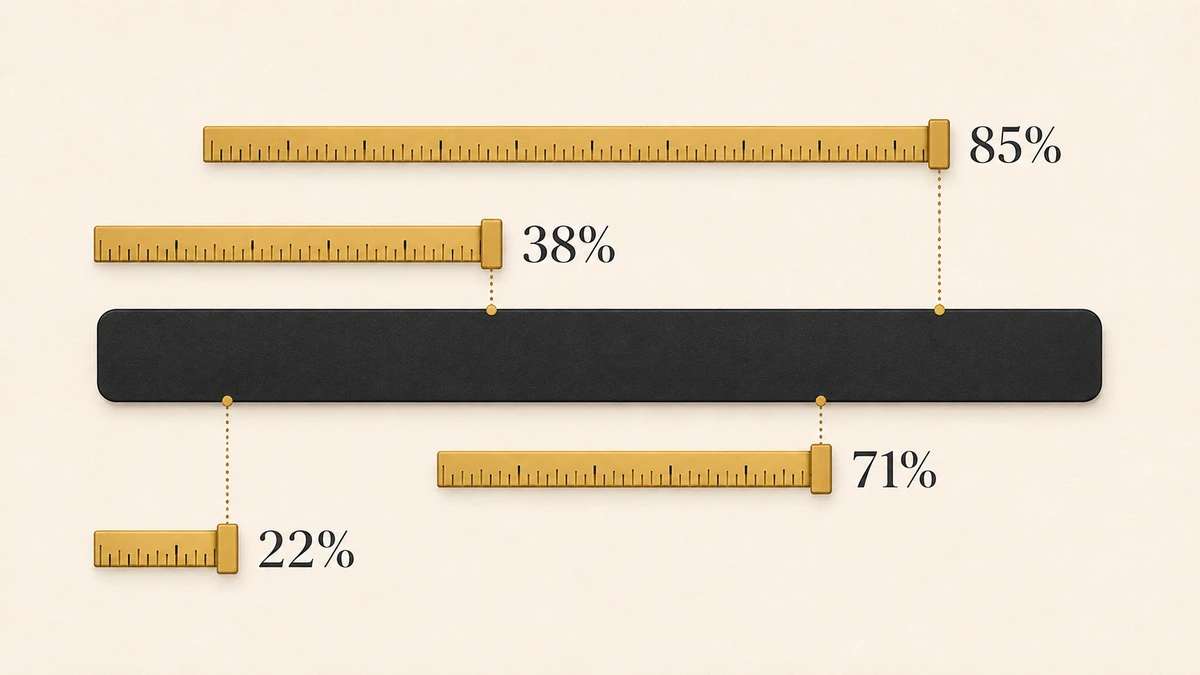
Four numbers circulate as the answer to “what is good sales forecast accuracy?” A median of 71%. Commit accuracy of 85%. A variance band of plus or minus 15% to 25%. And 95% once you add AI. They appear on vendor pages, in benchmark roundups, and inside the AI Overview for this exact query, presented as if they were four estimates of one quantity.
They are not. Each one counts something different, divides by something different, and is measured on a different day of the quarter. Put the same sales team through all four definitions and it scores anywhere from 22% to 87%, without a single deal changing. Sales forecast accuracy is not one metric with a contested value. It is four metrics wearing one name.
This page separates them. Commit, best case, and weighted pipeline each get their own table with their own denominator and their own published figures. Then every circulating number gets traced back to whoever first published it, including one on this site.
Direct answer — What is a good sales forecast accuracy rate?
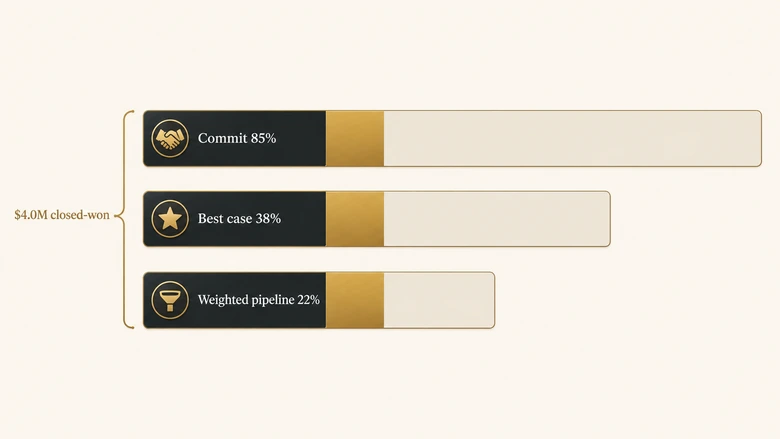
Sales forecast accuracy measures how closely a forecast matched actual closed revenue for a period. There is no single good rate, because the figure depends on which forecast category you score. Published medians run near 85% for commit, 38% for best case, and 22% for weighted pipeline. The same team scores all three at once. Always state the category, the snapshot date, and whether you divided by forecast or by actual.
Key Takeaways
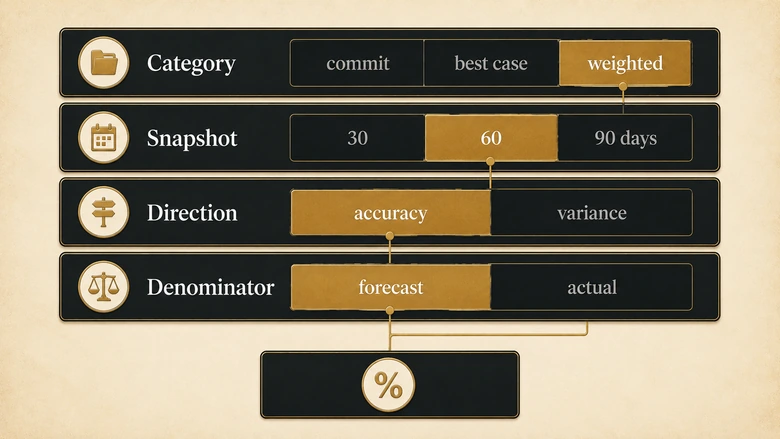
- The four circulating numbers are not rival estimates. They differ on four axes: which forecast category is scored, which snapshot date is used, whether the result is stated as accuracy or as variance, and whether the denominator is the forecast or the actual.
- Published medians for the three categories: commit 85%, best case 38%, weighted pipeline 22%. One team reports all three simultaneously, and all three are correct.
- Accuracy and variance are the same measurement inverted. A team at plus or minus 15% variance is a team at 85% accuracy. Publishing both as separate benchmark rows double-counts one number.
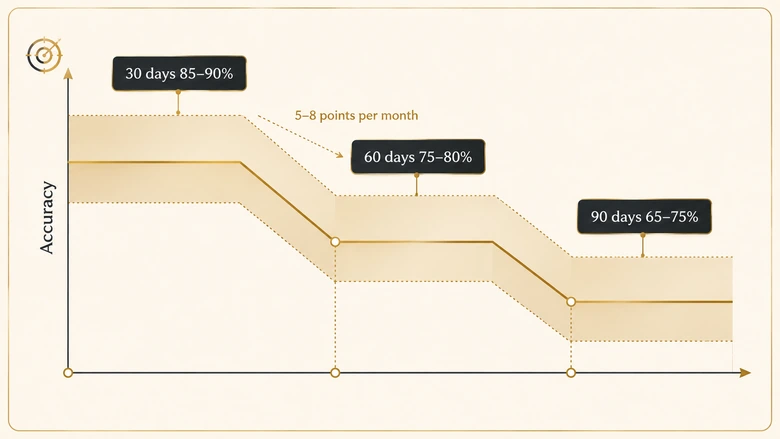
- Snapshot date moves the result more than performance does. The same forecast scores roughly 70% at 90 days out and 85% to 90% at 30 days out, a decay of 5 to 8 points per month.
- Only one figure in the set discloses a sample size. Optifai publishes n=939 companies over Q2 2025 to Q1 2026. The 71% median, the 85% commit figure, and every “95% with AI” claim are published without a sample, a period, or a stated method.
- Two publishers give best-case accuracy figures that differ by a factor of two, 38% against roughly 80%, for the same named category.
What sales forecast accuracy measures
Sales forecast accuracy is the degree to which a revenue forecast made at a fixed point in time matched the revenue actually closed in that period. It is a backward-looking score of a forward-looking claim. The forecast has to be frozen before the period ends, or there is nothing to score.
That last condition is where most reported accuracy figures quietly fail. A number recomputed from a live CRM forecast improves as the quarter closes, because the forecast converges on the answer. It measures the passage of time, not the quality of the call.
Forecast accuracy = 1 − (|Forecast − Actual| ÷ Actual)The two denominators, and the gap between them
Two versions of this formula are in active use, and they disagree. The version above divides the error by actual revenue. The version most benchmark tables use divides closed-won by the forecast, which gives a straight ratio.
Take a team that committed $4.7M and closed $4.0M. Dividing the error by actual gives 82.5%. Dividing closed-won by forecast gives 85.1%. Same team, same quarter, same category, 2.6 points apart on denominator choice alone. Neither is wrong. Only one of them is comparable to the benchmark you are about to quote.
Sales forecast accuracy is not demand forecast accuracy
Search results for this term mix two disciplines that share vocabulary and share nothing else. Demand planning measures unit-level forecasts against shipments using MAPE, WMAPE, and bias, across thousands of SKUs where errors cancel. Sales forecasting measures a revenue call against bookings, across tens of deals where a single slipped deal moves the whole number.
MAPE behaves reasonably over a thousand SKUs. Over eleven enterprise deals it does not, because one deal at 40% of the quarter dominates the average. When a page offers you MAPE as the answer to sales forecast accuracy, check which discipline it came from.
Four numbers, four different measurements
Here is what each circulating figure actually counts, before any judgement about whether it is a good number.
| Circulating figure | What it counts | Denominator | Stated as |
|---|---|---|---|
| 71% median | Total forecast against total actual, all categories blended | Not stated | Accuracy |
| 85% commit | Closed-won from deals a rep called commit | Commit forecast | Accuracy |
| ±15% to 25% | Total revenue call against actual | Actual revenue | Variance |
| 95% with AI | Vendor claim, category unstated | Not stated | Accuracy |
Three things follow immediately. The 71% and the 85% are not competing, because one blends every category and the other isolates the tightest one. The plus or minus 15% to 25% band is not an accuracy figure at all, it is the inverse: subtract it from 100 and you get 75% to 85%, which overlaps both of the first two. And the 95% figure cannot be placed on the scale, because no one publishing it says which category it scores.
IMPORTANT
Accuracy and variance are one measurement, not two. A benchmark table that lists “commit accuracy 85%” and “forecast variance ±15%” as separate rows has published the same number twice. Check whether the denominators genuinely differ before treating them as independent targets.
One team, one quarter, eight accuracy numbers
The cleanest way to see the problem is to run one set of real quarter-end figures through every published definition at once. This team closed $4.0M against a commit of $4.7M, a best case of $10.5M, and a weighted pipeline of $18.2M.
| Definition applied | Calculation | Result | Reads as |
|---|---|---|---|
| Commit accuracy | 4.0 ÷ 4.7 | 85.1% | Median performance |
| Commit accuracy, error over actual | 1 − (0.7 ÷ 4.0) | 82.5% | Slightly below median |
| Best-case accuracy | 4.0 ÷ 10.5 | 38.1% | Median performance |
| Weighted-pipeline accuracy | 4.0 ÷ 18.2 | 22.0% | Median performance |
| Forecast variance | (4.0 − 4.7) ÷ 4.7 | −14.9% | Median performance |
| Same call at 90 days out | Horizon-adjusted | ~70% | Below median |
| Same call at 60 days out | Horizon-adjusted | ~78% | Median performance |
| Same call at 30 days out | Horizon-adjusted | ~87% | Top quartile |
Every figure in that table is defensible. Every one of them has a published benchmark it can be compared against. And a revenue leader can honestly report this team as a 22% performer or an 87% performer depending entirely on which row gets pasted into the board deck.
Notice the fifth row. A variance of −14.9% and a commit accuracy of 85.1% are the same arithmetic, stated twice. That is why benchmark tables listing both tend to show medians of 85% and 15% side by side: they sum to 100 because they have to.
Commit accuracy, the tightest category and the most contested
Commit accuracy scores only the deals a rep formally called for the period. It is the narrowest category and therefore the highest-scoring one, because reps are staking their credibility on each deal in it.
Commit accuracy = Closed-won from commit ÷ Commit forecast| Band | Published figure | Source | Sample disclosed |
|---|---|---|---|
| Bottom quartile | Under 70% | GrowthSpree, Jun 2026 | None |
| Median | 85% | GrowthSpree, Jun 2026 | None |
| Top quartile | 95%+ | GrowthSpree, Jun 2026 | None |
| Best in class | 98%+ | GrowthSpree, Jun 2026 | None |
| “Runs 95%+” | 95%+ as the norm | Dear Lucy, Aug 2025 | None |
The two publishers disagree about what normal looks like. GrowthSpree puts the median at 85% and 95% in the top quartile. Dear Lucy describes 95%+ as what commit accuracy simply runs at. One publisher’s exceptional is the other publisher’s ordinary, and neither states a sample.
A related figure worth separating out is AE forecast call accuracy, published at a 70% median. That scores the individual rep’s weekly call, not the rolled-up number. Manager overrides are precisely the difference between the two, so a team can hold 85% commit accuracy while its reps individually call at 70%.
Commit accuracy also degrades in a specific, predictable way with rep tenure. Published bands put reps under six months at 65% to 75% and reps past three years at 90% to 96%. If your commit accuracy fell this year and your hiring did not slow, you may be measuring your ramp, not your process.
Best-case accuracy, where published figures differ by a factor of two
Best-case accuracy scores the wider category: everything a rep thinks could land if things break right. It should score far lower than commit by construction, because it is a deliberately optimistic set.
| Band | Published figure | Source | Sample disclosed |
|---|---|---|---|
| Bottom quartile | Under 22% | GrowthSpree, Jun 2026 | None |
| Median | 38% | GrowthSpree, Jun 2026 | None |
| Top quartile | 55%+ | GrowthSpree, Jun 2026 | None |
| Best in class | 65%+ | GrowthSpree, Jun 2026 | None |
| “Looser at ~80%” | Roughly 80% | Dear Lucy, Aug 2025 | None |
This is the widest disagreement in the entire set. One publisher’s median is 38%. Another describes the same named category as running near 80%. The gap is not a difference of opinion about performance, it is a difference in what is being divided.
A 38% figure is closed-won divided by the full best-case number, which is a large denominator by design. A figure near 80% is measuring something else, most plausibly how often the actual result lands inside the band the best case defined. Both are reasonable metrics. Only one of them can be called best-case accuracy without a definition attached.
PRO TIP
Before adopting any best-case target, write the denominator into your reporting spec as a sentence: “closed-won divided by the best-case forecast frozen on day one.” If the benchmark you are copying does not state its denominator, you cannot tell whether you are aiming at 38% or 80%, and those imply opposite management responses.
Weighted-pipeline accuracy, the number vendors quote least often
Weighted-pipeline accuracy scores the probability-weighted value of the whole open pipeline against what actually closed. It produces the lowest number of the three categories, which is likely why it appears least often in marketing material.
| Band or method | Published figure | Source | What it divides by |
|---|---|---|---|
| Median | 22% | GrowthSpree, Jun 2026 | Weighted pipeline |
| Top quartile | 32%+ | GrowthSpree, Jun 2026 | Weighted pipeline |
| Best in class | 42%+ | GrowthSpree, Jun 2026 | Weighted pipeline |
| Weighted pipeline as a method | ±18% to 25% variance | Optifai, n=939 | Actual revenue |
| Weighted pipeline as a method | 60% to 75% accuracy | Forecastio, Jul 2026 | Not stated |
Three figures, one name, and a spread from 22% to 82%. The reconciliation is that the first three rows divide closed-won by the raw weighted pipeline, while the last two score the accuracy of a forecast derived from weighted pipeline. Those are different quantities that happen to share a label.
Weighted pipeline carries a second problem that the accuracy figure hides. Stage probabilities and coverage targets are usually derived from the same win rate, so applying both compounds one assumption twice. That mechanism, and how to derive a coverage target from your own win rate instead of inheriting 3x, is worked through separately, because a weighted forecast built on a borrowed coverage multiple inherits its error before any accuracy scoring begins.
The win rate feeding those weights is itself an unstable input. Published win rates range from 18% to 47% depending purely on which denominator the publisher counted, and a stage-probability model calibrated against the wrong one will miss consistently in the same direction.
Snapshot date moves accuracy more than performance does
To compare two accuracy figures, fix the day the forecast was frozen. Accuracy measured at 30 days out and accuracy measured at 90 days out are different metrics, and the gap between them is larger than the gap between a good team and a mediocre one.
| Forecast horizon | Published accuracy | Implied variance |
|---|---|---|
| 30-day forecast | 85% to 90% | ±10% to 15% |
| 60-day forecast | 75% to 80% | ±20% to 25% |
| 90-day forecast | 65% to 75% | ±25% to 35% |
| Decay rate | 5 to 8 points per month | |
These bands come from Optifai’s B2B SaaS pipeline benchmark, drawn from 939 companies across Q2 2025 to Q1 2026, with the horizon cut based on 287 of them. It is the only figure set in this article that discloses a sample and a period.
Now put the horizon table next to the headline numbers. A 90-day forecast at 65% to 75% brackets the widely quoted 71% median. A 30-day forecast at 85% to 90% brackets the widely quoted 85% commit figure. The two headline numbers that appear to contradict each other are consistent with one team measured 60 days apart.
That does not prove they came from the same data. It does mean that anyone comparing 71% against 85% without knowing both snapshot dates is comparing nothing. Fix the snapshot date before you fix the forecast.
Where each circulating number came from
Every figure below was traced to the earliest page publishing it that could be retrieved. The column that matters is the last one.
| Figure | Published by | Date | Sample stated | Method stated | Traceable to a study |
|---|---|---|---|---|---|
| 71% median accuracy | Digital Applied statistics roundup | Apr 2026 | No | No | No |
| 85% commit / 38% best case / 22% weighted | GrowthSpree | Jun 2026 | No | Formulas given, no data source | No |
| ±15% to 25% median variance | Optifai | Nov 2025, upd. Apr 2026 | Yes, n=939 | Period given, calculation not | Partly |
| Commit 95%+ / best case ~80% | Dear Lucy | Aug 2025 | No | No | No |
| 80–95% world class / 50–70% average | Forecastio | Jul 2026 | No | No | No |
| 95%+ world class | Fullcast | Nov 2025 | No | Own benchmark report | Partly |
| Up to 95% with AI | Forecastio, on its own product | 2026 | No | No | No |
| 85–95% target | This site, /revops-best-practices/ | 2026 | No | No | No |
Two patterns worth naming
The first is the citation hop. Clari’s page on forecast accuracy cites a 75% to 90% band and attributes it to forecastio.ai. Forecastio’s guide publishes that band with no attribution at all. A number that started life unsourced acquires the appearance of a source by being cited once. Clari’s page attributes two further figures to other vendor blogs.
The second is the zombie citation. Forecastio’s guide attributes “79% of sales organizations miss their forecast by more than 10%” to SiriusDecisions, a research brand Forrester acquired for $245 million in a deal completed on January 3, 2019, and a further figure to CSO Insights. Neither underlying report is retrievable. To be fair to that page, its Gartner citation checks out: Gartner did publish that fewer than 50% of sales leaders have high confidence in forecast accuracy. Its benchmark tables are the unattributed part, not its external stats.
The number on this site
Our own RevOps best practices guide publishes “target forecast accuracy: 85-95%” and attributes it to Gartner’s research, linking to a Gartner topic hub rather than to a report containing that figure. That page returns 403 to automated retrieval, so the claim could not be verified. What Gartner does publish under this heading, and what is retrievable, is a confidence statistic, not an accuracy band.
The 85-95% target also names no category and no snapshot date, which is the same defect this page has spent four sections describing. It is scheduled for correction. Auditing other publishers while leaving our own unsourced number alone would not be worth reading.
How to compute an accuracy number you can defend
To produce a forecast accuracy figure that survives a finance review, fix four decisions before the quarter starts and write them down.
Workflow · 30 min
How to calculate sales forecast accuracy you can defend
Fixes the four decisions that determine what a forecast accuracy figure means, so the result is comparable across quarters and against published benchmarks.
Fix the snapshot date before the period opens
Choose day one or day thirty of the quarter and record it in the reporting spec. Store the frozen forecast outside the CRM, because the CRM overwrites what you believed six weeks ago.
Name the forecast category you are scoring
Score commit, best case, and weighted pipeline separately. Never blend them into one company-level figure, because over-calls and under-calls cancel and flatter the result.
Declare the denominator in writing
Pick closed-won divided by forecast, or one minus error over actual, and use the same one every quarter. Record which you chose next to the number itself, not in a footnote.
Report accuracy or variance, not both
The two are the same measurement inverted. Publishing both as separate targets creates the appearance of two independent goals and invites teams to optimise one against the other.
Assign the metric to RevOps, not to Sales
Give one role the authority to change the definition, and require a written change note when it changes. A definition owned by the team it evaluates does not hold under quarter-end pressure.
The fifth step is the one teams skip and the one that decides whether the other four survive. Forecast accuracy is a metric with a genuine ownership problem, and the wider question of which role owns each revenue metric and which system it must be read from determines whether any of these definitions hold past the first bad quarter.
One caveat on all of this. An accuracy figure inherits the quality of the records it is computed from, and that floor is lower than most teams assume: research covering 655,000 opportunities found 44% of the contacts sellers interact with never reach the CRM at all. The same record-hygiene problem that turns a sales velocity figure into a measure of data discipline applies here, because stage timestamps and close dates are the raw material of every snapshot you freeze.
Method, sources and revision history
Every figure quoted here was retrieved from the publishing page between 10 and 12 August 2026, and each is attributed in the provenance table above to the earliest retrievable publisher rather than to a page that repeated it.
Three limitations are worth stating. First, Gartner’s site returns 403 to automated retrieval, so Gartner material here comes from its public newsroom release rather than from gated research, and any Gartner-attributed accuracy band that is not in that release remains unverified. Second, “earliest retrievable publisher” is not the same as “original source”; where a figure predates the pages that carry it, the trail ends at a page, not at a study. Third, the worked example in section three uses constructed figures chosen to land on the published medians, so it demonstrates the arithmetic rather than reporting a real company.
Published 12 August 2026, v1.0. The category benchmark tables are the volatile part of this page and are scheduled for review as new benchmark reports with disclosed samples appear.
Frequently Asked Questions
Category-level accuracy against a frozen snapshot is the most useful single measure. Score commit, best case, and weighted pipeline separately rather than reporting one company-wide figure, because blending categories lets over-forecasting in one area cancel under-forecasting in another and produces a flattering number that hides both errors.
Published benchmarks put 30-day forecasts at 85% to 90% accuracy, 60-day at 75% to 80%, and 90-day at 65% to 75%, with decay of roughly 5 to 8 points per month. Beyond one quarter, accuracy falls far enough that the forecast is better treated as a planning range than a commitment.
It depends entirely on the category. Published medians are roughly 85% for commit, 38% for best case, and 22% for weighted pipeline. A team hitting all three medians simultaneously is performing at par. Any single target quoted without a named category cannot tell you whether you are ahead or behind.
Yes, when both use the same denominator. Accuracy and variance are one measurement inverted, so 100 minus the variance percentage gives the accuracy percentage. Benchmark tables that publish both as separate rows with separate targets have listed the same number twice under two names.
Benchmark data with a disclosed sample puts AI-assisted forecasting at ±8% to 15% variance against ±25% to 35% for rep roll-up, an improvement of 15% to 25%. The widely quoted 95% figure comes from vendor product claims that name no category and disclose no sample, so treat it as marketing rather than benchmark.





