Search for B2B marketing budget benchmarks and you will have a number within about four seconds. It will sit somewhere between 5% and 25% of revenue, it will sound authoritative, and there is a good chance it describes a company nothing like yours.
The pages ranking for this term do not agree with each other. One says 7.7%. Another says 9.4% and calls it a rise. A third says 15% to 25%. A fourth says 5% to 10% and cites nobody at all. Each publishes a single average as if the question had one answer.
They are not all wrong. That is the harder problem. Most of those figures come from real surveys, and the surveys genuinely disagree because they counted different companies, in different years, using different definitions of what marketing spend even includes.
This page sorts them. It gives you the 2026 figures that carry a named publisher, a sample size, and a field date; it shows what population each one measured; and it explains why the headline averages cluster tightly around 8% while the useful range underneath them runs from 4% to 40%.
Direct answer — What are the current B2B marketing budget benchmarks?
B2B marketing budget benchmarks are published figures for annual marketing spend as a percentage of company revenue. In 2026, Gartner’s CMO Spend Survey reports 7.8%, The CMO Survey reports 9.0% overall with B2B product companies at 7.0% and B2B services at 10.1%, and SaaS Capital reports a median of 8% of ARR for private B2B SaaS. These are averages across very different panels, so they exclude stage effects: early-stage companies routinely run far higher.
Key Takeaways
- Four credible 2026 sources cluster between 7.8% and 9.0% of revenue. The agreement is real but shallow, because each measured a different population.
- Gartner’s figure has fallen from 9.5% in 2022 to 9.1% in 2023, then 7.7% in 2024 and 2025, and 7.8% in 2026. A benchmark quoted without its year is unusable.
- Inside a single survey, B2B product companies report 7.0% of revenue and B2B services 10.1%. Same year, same questionnaire, 3.1 points apart.
- The widely repeated claim that B2B marketing spend rose to 9.4% in 2025 is a wave-to-wave bounce in a volatile 300-person panel, not a trend.
- Definitional scope moves the number more than any benchmark does. SaaS Capital reports marketing at 8% of ARR and selling costs separately at 15%.
- No published benchmark can tell you your correct budget. It can only tell you whether you are unusual, and that is still worth knowing.
What the 2026 B2B marketing budget benchmarks actually say
B2B marketing budget benchmarks are published figures for how much companies spend on marketing over a year, expressed as a percentage of annual revenue. Four organisations published usable 2026 data with a named methodology behind it.
Here is the whole field in one view, with the population each one actually measured.
| 2026 source | Population measured | Headline figure | Sample and field dates |
|---|---|---|---|
| Gartner CMO Spend Survey 2026 | CMOs and marketing leaders, North America, UK and Europe, all industries, vast majority above $1 billion in annual revenue | 7.8% of company revenue | 401 leaders, January to March 2026 |
| The CMO Survey 2026 (Duke Fuqua, Deloitte, AMA) | Marketing leaders at for-profit US companies, broad size mix, 97% VP-level or above | 9.0% of revenue overall; B2B product 7.0%, B2B services 10.1% | 308 leaders, 7 to 29 January 2026 |
| SaaS Capital 2026 Spending Benchmarks | Private B2B SaaS companies, both bootstrapped and equity-backed | 8% of ARR (median), marketing only | 1,000+ companies, Q1 2026, 15th annual survey |
| Forrester B2B Marketing Budget Benchmarks | B2B firms across industries | 8% of annual revenue (mean) | Nearly 500 organisations |
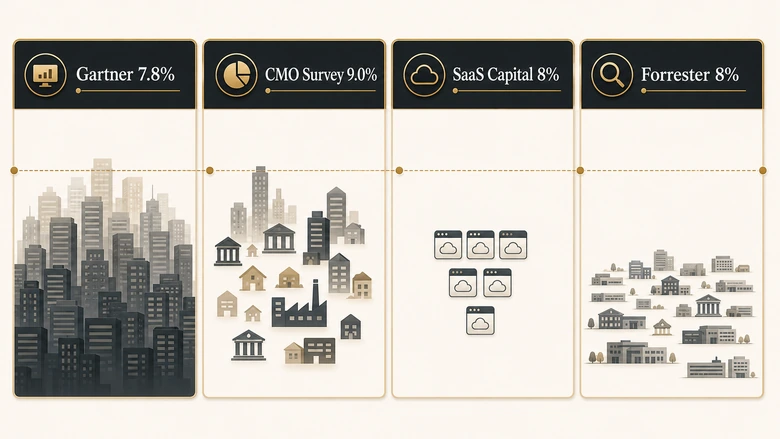
Three of those four land within 1.2 points of each other. If you only read the headline row, the field looks settled at roughly 8% of revenue.
It isn’t settled. Those four averages describe a Fortune-500 CMO in London, a 40-person US services firm, and a bootstrapped SaaS company with $4M in ARR as though they were the same organisation. The averages converge; the companies inside them do not.
Marketing Budget % = Annual Marketing Spend ÷ Annual Revenue × 100Why published figures still contradict each other
Published benchmarks diverge for three specific reasons: the year the data was collected, the population that was surveyed, and the definition of marketing spend the survey used. Almost every contradiction on page one traces to one of those three.
Vintage: the number moved, and the pages didn’t
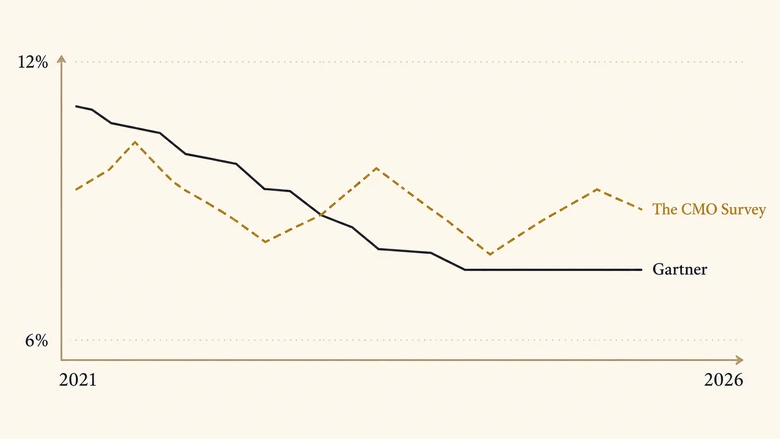
Gartner’s series is the most quoted in B2B, and it has been falling. Average marketing budgets ran at 11% of revenue in the four years before the pandemic. They reached 9.5% in 2022, slipped to 9.1% in 2023, then dropped to 7.7% in 2024, held flat through 2025, and edged to 7.8% in 2026.
That series is the single biggest source of confusion in this SERP. Pages quoting 9.1% and pages quoting 7.7% are not citing rival surveys. They are citing the same survey three years apart, and readers reasonably assume they are looking at a genuine disagreement.
A benchmark without a year attached is not a benchmark. It is a historical artifact being passed off as current guidance.
Population: who was in the room
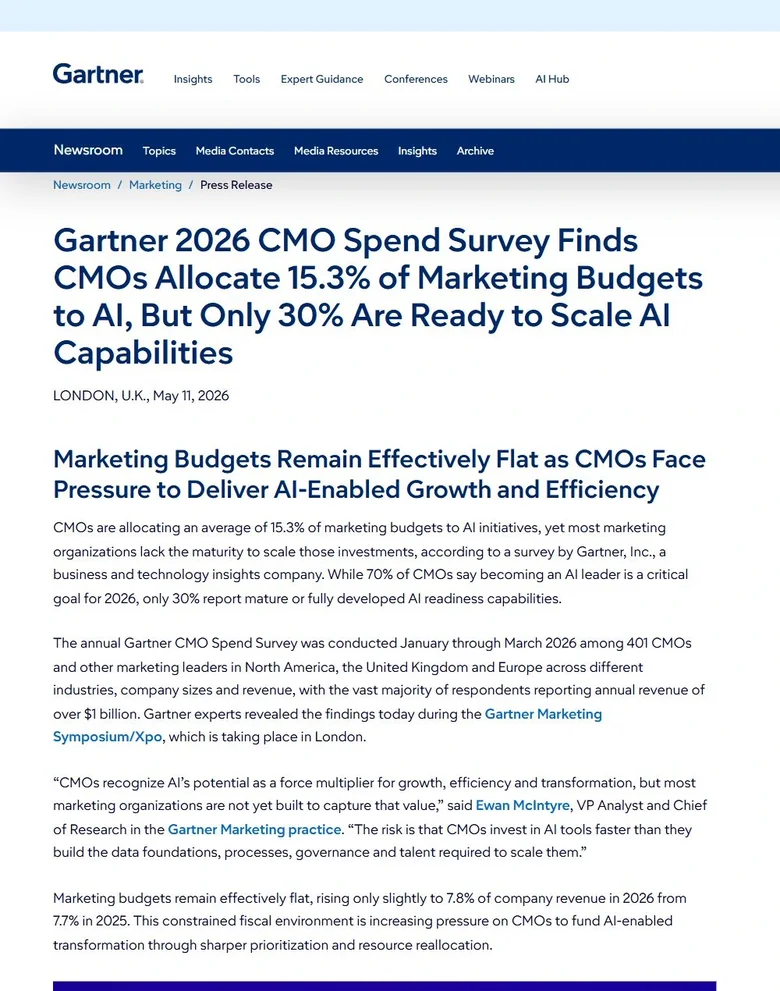
Gartner’s 2026 panel is 401 marketing leaders, the vast majority at companies above $1 billion in revenue. Its 2024 panel reported median annual revenue above $5.3 billion. That is a specific slice of the economy, and it is not the slice most B2B marketers work in.
The CMO Survey polls a broader mix of US company sizes and lands at 9.0% for the same year. Neither is wrong. They are measuring different economies and reporting both results honestly.
Panel composition also drifts between waves of the same survey, which is why year-over-year movement in a small panel deserves less weight than it usually gets.
Definition: what counts as marketing spend
This one moves the number further than either of the others, and it is the least discussed. SaaS Capital reports marketing at a median 8% of ARR and reports selling costs separately at 15%, up from 13% the prior year. Combine the two lines the way some companies do internally and the “marketing budget” reads 23%.
Before you compare yourself to any figure on this page, settle whether your number includes salaries, agency retainers, martech licences, events, and paid media. Two companies with identical spending patterns can report 6% and 14% purely on where they draw that boundary.
Most published benchmarks assume the wide definition. If your finance team runs a narrow one, you will look underfunded against every figure in this article for reasons that have nothing to do with your strategy.
What sits inside the number
| Cost line | Usually inside the benchmark | Why it matters |
|---|---|---|
| Marketing salaries and benefits | Yes | Typically the largest single line. Excluding it can halve your reported percentage. |
| Agency and contractor fees | Yes | Shifts between this line and salaries when teams move work in-house, with no real change in spend. |
| Martech and data subscriptions | Yes | Sometimes sits in an IT budget, which quietly understates marketing. |
| Paid media and events | Yes | The line most people picture when they hear “marketing budget”, and rarely more than a third of it. |
| Sales development and SDR costs | No | Reported separately in most surveys. Folding it in is the single most common way companies overstate marketing spend. |
| Product marketing headcount | Varies | Often sits under product. Check before comparing against a SaaS benchmark. |
IMPORTANT
The claim that B2B marketing spend rose to 9.4% of revenue in 2025 circulates widely. It is The CMO Survey’s 2025 wave, compared against its own Fall-2024 wave of 7.7%. That panel has swung between 7.7% and 10.9% since 2021. The move is sampling variance in a 300-person survey, not a recovery in B2B budgets.
How B2B marketing budgets differ by industry and business model
Industry and business model split the B2B average more sharply than most benchmark pages admit. The cleanest evidence comes from inside a single survey, where the questionnaire and the year are held constant.
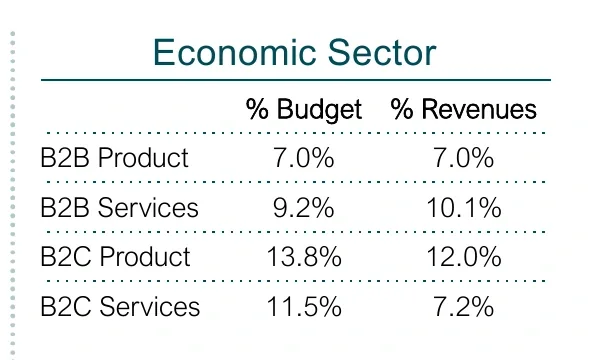
The CMO Survey’s 2026 sector breakout puts B2B product companies at 7.0% of revenue and B2B services companies at 10.1%. Same instrument, same field window, 3.1 points apart. Services firms sell expertise that has to be made visible before it can be bought, and their spending reflects that.
| Segment | Marketing spend | Source and year |
|---|---|---|
| B2B product companies | 7.0% of revenue | The CMO Survey, 2026 |
| B2B services companies | 10.1% of revenue | The CMO Survey, 2026 |
| Private B2B SaaS (median) | 8% of ARR | SaaS Capital, Q1 2026 |
| Equity-backed B2B SaaS | Roughly double bootstrapped peers | SaaS Capital, Q1 2026 |
| Large enterprise, cross-industry | 7.8% of revenue | Gartner CMO Spend Survey, 2026 |
| AI-ready marketing organisations | 8.9% of revenue | Gartner CMO Spend Survey, 2026 |
The SaaS Capital finding is the one worth sitting with. Inside a tightly defined population, private B2B SaaS companies surveyed in the same quarter, equity-backed firms spend roughly twice what bootstrapped firms spend on marketing.
Every variable a benchmark normally controls for is already held constant there. Industry, business model, ownership type, company stage, survey wave. Funding structure alone still doubles the answer. That is the clearest available proof that a single average cannot carry the weight people put on it.
How much B2B companies spend by stage
Stage changes the number more than industry does, and the data behind stage benchmarks is markedly weaker than the data behind the headline averages. Both of those things are true and both matter.
The widely circulated stage ranges run roughly like this: pre-product-market-fit and early-growth companies at 20% to 40% of revenue or higher, scaling companies at 10% to 25%, and mature companies at 5% to 10%. SaaS Capital’s finding that equity-backed firms outspend bootstrapped peers about two to one points in the same direction, from a properly sampled survey.
The reason the enterprise surveys cannot show you this is structural rather than accidental. A pre-revenue company cannot appear in a panel whose respondents average $1 billion in revenue. When a startup benchmark and a Gartner figure look irreconcilable, it is usually because they describe populations with no overlap at all.
PRO TIP
Treat stage ranges as directional and headline averages as measured. If you are pre-PMF, a 30% figure tells you that heavy early spend is normal, not that 30% is your target. Your own unit economics decide the target.
Very early-stage percentages also suffer from a denominator problem. A company with $400,000 in revenue spending $160,000 on marketing reports 40%, but that figure describes a small absolute budget rather than an aggressive strategy. Percentage-of-revenue benchmarks become meaningful somewhere around the point where revenue stabilises.
Where the money goes once the budget is set
Allocation inside the budget shifted more in 2026 than the topline did. Gartner reports that CMOs now put an average of 15.3% of marketing budgets into AI initiatives, while the organisations Gartner classes as AI-ready allocate 21.3%.
Those AI-ready organisations also report larger budgets overall, at 8.9% of company revenue against the 2026 average of 7.8%. Gartner is careful about the direction of that relationship, and so should you be. Better-funded marketing organisations can afford to build AI capability; building AI capability does not automatically earn a bigger budget.
The rest of the picture has been stable. Labour remains the largest single line in most B2B budgets, paid media sits close behind, and martech has been squeezed for several years running. Directive’s 2026 analysis, working from Gartner’s 2025 cut, puts paid media around 30.6% of budget and digital channels at 61.1% of spend.
None of that tells you what to spend. It tells you what your peers are doing, which is a different and much weaker claim.
Budget claims worth checking before you quote them
Several widely repeated B2B marketing budget figures do not survive a check on where they came from. Before a number goes into a board deck, it needs a publisher, a year, and a population, and a surprising share of the figures ranking for this term have none of the three.
We traced the most-quoted claims currently in circulation for this keyword. Here is what each one is actually resting on.
| Claim in circulation | What it traces to | Safe to quote? |
|---|---|---|
| “B2B marketing budgets range from 5% to 10% of revenue” | No publisher, no date, no sample. Presented without attribution. | No. The range is plausible but nothing supports it. |
| “Spend rose to 9.4% in 2025, up from 7.7% in 2024” | Two waves of The CMO Survey, cited to a third-party training blog rather than the survey. | Only as sampling variance. It is not a documented increase. |
| “Digital marketing investment rose 88%” | No source and no time period. “Recent years” is the only frame given. | No. Withdraw it. |
| “B2B companies should spend 15% to 25% of revenue” | Practitioner guidance, not survey output. Describes venture-backed growth companies. | Only with the stage stated alongside it. |
| “The average B2B firm invests 8% of revenue” | Forrester’s B2B Marketing Budget Benchmarks, nearly 500 organisations. | Yes, with the year attached and the dispersion noted. |
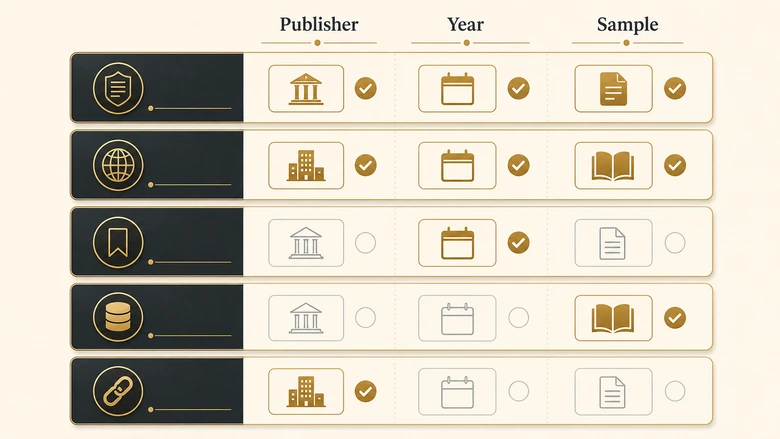
The pattern is consistent. Numbers with a named publisher behind them cluster near 8% and come with caveats attached. Numbers without one are wider, rounder, and more confident.
When the publisher argues against its own average
Forrester’s own write-up is the useful counter-example, because it argues against its own headline. The post is titled “The Average B2B Firm Invests 8% Of Revenue In Marketing, But That’s Not The Whole Story”, and it notes that the largest single group of respondents sat between 7.1% and 10%, with wide variation on either side. The organisation publishing the average is telling you not to plan from it.
That caution matters more in 2026 than it did five years ago. Answer engines lift figures from whichever page states them most cleanly, and a confident sentence with no citation reads exactly like a sourced one once the surrounding context is stripped away. Unsourced budget numbers now propagate faster than the corrections do.
How to set your own B2B marketing budget benchmark
To set a defensible budget, match yourself to the right survey population first, then adjust for stage, then validate against your own unit economics. The percentage is an output of that process rather than an input to it.
Workflow · 45 min
How to set a B2B marketing budget benchmark you can defend
Turns a published average into a company-specific target with a citation behind it, ready for a CFO conversation.
Fix your spend definition first
Write down whether your marketing number includes salaries, agencies, martech, events, and paid media. Use that same boundary for every comparison that follows.
Pick the survey whose panel resembles you
Above $1 billion in revenue, use Gartner. Private B2B SaaS, use SaaS Capital. US mid-market product or services, use The CMO Survey sector split.
Record the year and the sample size
Note the field dates and respondent count next to the figure. A 2023 number presented as current is the most common error in this category.
Adjust for stage and funding
Shift upward if you are pre-PMF or venture-backed, downward if you are mature or bootstrapped. Treat the adjustment as directional, since stage data is weaker than the headline averages.
Validate against payback, not against the average
Check the resulting budget against your customer acquisition cost and payback period. If the economics work at 14%, the 8% average is not an argument against you.
What that looks like on a real budget
Take a bootstrapped B2B services firm at $12M in revenue, growing 20% a year, planning next year’s spend. The instinct is to reach for the 7.8% headline and land on roughly $940,000.
Working the steps changes the answer. The right panel is The CMO Survey’s services cut at 10.1%, not Gartner’s enterprise average, because the company is US mid-market rather than a billion-dollar enterprise. That moves the starting point to about $1.2M. Being bootstrapped rather than equity-backed pulls it back down, since SaaS Capital’s data puts bootstrapped firms at roughly half their funded peers on marketing. Being past product-market fit pulls it down again.
The defensible range lands somewhere between $850,000 and $1.2M, and the reason for every adjustment is written down with a citation. That is a different conversation from arriving with one number and a link to a blog post.
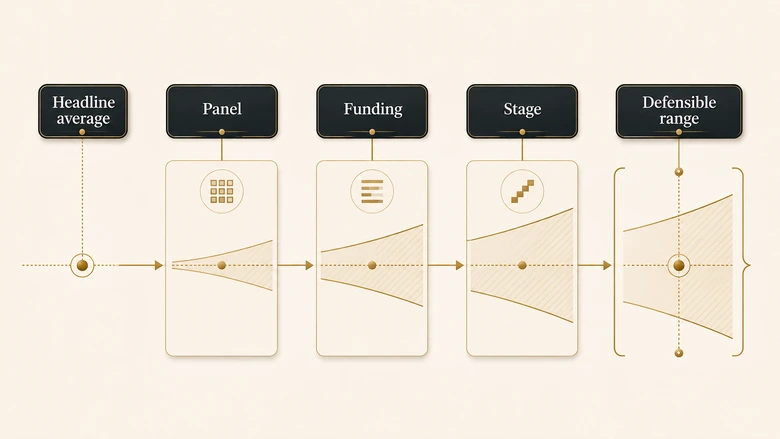
Notice that the final range straddles the headline average rather than replacing it. The benchmark was never useless. It was just never the answer on its own.
That last step is where most budget arguments are actually won. A percentage-of-revenue benchmark is a sanity check on whether you are unusual. It cannot tell you whether your spending is efficient, and efficiency is the question a CFO is really asking.
The metrics that answer it sit one level down. Blended and paid customer acquisition cost and its payback period tell you whether the budget is converting into customers at a sustainable price, which no share-of-revenue figure can. Pair that with your cost per qualified lead and you have a defence that survives contact with finance.
Use the benchmark to open the conversation. Use your own economics to win it.
Frequently Asked Questions
For established B2B companies, 7% to 10% of revenue is the range the 2026 surveys support. Gartner reports 7.8%, The CMO Survey 9.0%, and SaaS Capital a median of 8% of ARR. Early-stage and venture-backed companies routinely run well above that, and mature firms often sit below it.
SaaS Capital’s Q1 2026 survey of more than 1,000 private B2B SaaS companies puts median marketing spend at 8% of ARR, unchanged year over year, with selling costs reported separately at 15%. Equity-backed companies spend roughly twice what bootstrapped companies spend on marketing.
Three reasons. Surveys run in different years and budgets have fallen since 2022. They poll different populations, from billion-dollar enterprises to small US firms. And they define marketing spend differently, particularly on whether salaries, agencies, and martech are counted inside the number.
Barely. Gartner’s 2026 CMO Spend Survey reports 7.8% of company revenue, up from 7.7% in 2025, which Gartner describes as effectively flat. The larger story is the fall from 9.5% in 2022, and a plateau rather than a recovery since 2024.
Gartner’s 2026 survey reports an average of 15.3% of marketing budgets allocated to AI initiatives. Organisations Gartner classifies as AI-ready allocate 21.3%. Only 30% of CMOs report mature AI readiness capabilities, so allocation is currently running ahead of capability.