Almost every article written about the dark funnel opens with the same statistic: roughly 70% of the B2B buying journey is over before a buyer ever contacts a vendor. It is a good number. It is also out of date, and the company that made it famous is the one that retired it.
In its 2025 B2B Buyer Experience Report, published in November 2025, 6sense moved the point of first contact from 69% of the journey to 61%, and renamed what it had been calling the 70/30 journey to the 60/40 journey. The finding rests on two surveys totalling more than 4,000 buyers across North America, Europe and Asia-Pacific. Eight percentage points moved, and the industry kept quoting the old figure. That matters less than the second problem, though, which is that this number was never a measurement of what your analytics can see. It measures when buyers say they first talk to a seller. Trackability is a different question, and it needs different instruments.
Direct answer — What is the dark funnel in B2B marketing?
The dark funnel is the part of a B2B buying process that produces no trackable event: peer conversations, private communities, podcasts, review-site browsing and word of mouth. It is not a channel you can add to a report. It is the set of interactions that reach your buyer without passing through a link you own, which is why they arrive in analytics as direct traffic or as no record at all.
Key Takeaways
- 6sense moved the point of first contact from 69% to 61% of the journey in its November 2025 report. Most dark funnel content still quotes the older number.
- Direct traffic is not one thing. It mixes genuine word of mouth with referrer stripping, capture failures and broken forms, and the four look identical in a report.
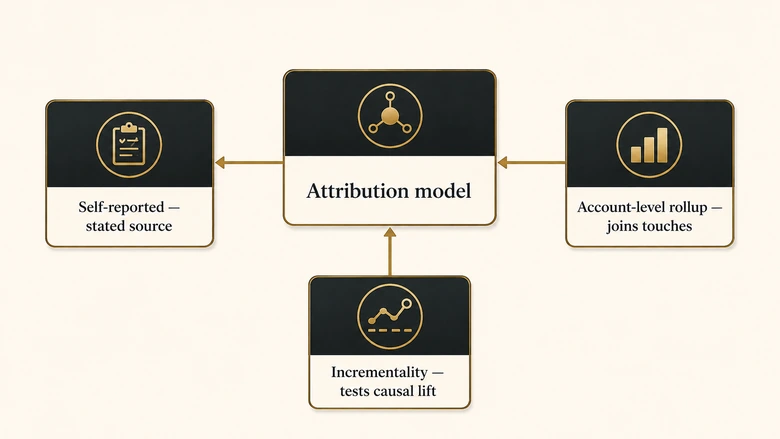
- Self-reported attribution, account-level rollup and incrementality testing measure different things. Run them as layers, not as replacements for your attribution model.
- Only 23 of 150 B2B forms we audited ask how buyers heard about them, and just 12 make the question required.
- Incrementality is the only one of the three that has a control group, which makes it the only one that tests causation rather than correlation.
What the dark funnel is, and the number everyone still quotes
The dark funnel is the portion of a buying process that leaves no trackable footprint in your analytics or CRM. A prospect hears your name in a private Slack group, reads a comparison thread on Reddit, listens to a podcast on a commute, and asks a former colleague what they use. None of that produces a session, a UTM parameter or a form fill. By the time anything measurable happens, the decision is already leaning.
The concept sits inside a wider question about how B2B buyers actually move, which we cover separately in our guide to the B2B customer journey. What is worth correcting here is the number that gets attached to it.
What the 2025 data actually changed
6sense’s 2025 study reported that the point of first contact shifted from 69% of the journey to 61%. Average cycle length fell from 11.3 months to 10.1 months. Buyers are engaging sellers a little earlier in a slightly shorter process.
Read carelessly, that sounds like the dark funnel is shrinking. It is not. The same report found that four out of five deals are still won by the vendor the buyer preferred before making contact, and that 95% of the time the winning vendor was already on the buyer’s day-one shortlist. The unobserved window got shorter. Its influence on the outcome did not move at all.
So the honest framing is narrower than the one in circulation. It is not that 70% of the journey is untrackable. It is that the shortlist forms during a period when you cannot see who is forming it, and that period ends about 61% of the way through.
Why your attribution report calls it direct traffic
Direct traffic is what analytics platforms record when a session arrives with no referrer string. Most people read that bucket as “typed the URL in”, which is a small fraction of what actually lands there.
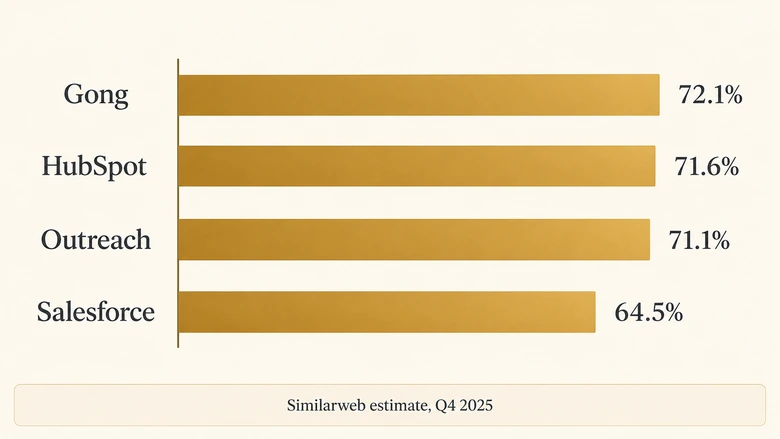
The proportions are large enough to be uncomfortable. Similarweb’s Q4 2025 data, published in its own analysis of the B2B dark funnel, put direct traffic at 72.1% of visits for Gong, 71.6% for HubSpot, 71.1% for Outreach and 64.5% for Salesforce. Those are estimates from a third-party panel rather than the companies’ own analytics, so treat them as an order of magnitude rather than a precise reading. The order of magnitude is the point.
Four different failures that produce the same row
Before you conclude that a large direct bucket proves a large dark funnel, rule out the three cheaper explanations. They are indistinguishable in a channel report and they are not equally interesting.
- Referrer stripping. Links opened from messaging apps, desktop clients and some mobile browsers arrive without a referrer. This is genuine dark social and belongs in the dark funnel.
- Capture failure. The visit was attributed correctly, but the campaign values never made it into a CRM field, so the record looks sourceless later. That is a plumbing fault, and it has its own diagnostic procedure in our walkthrough of form-to-CRM reconciliation.
- Silent form failure. The submission never arrived at all. Nothing errors, nobody is alerted, and the missing records quietly bias every downstream average, a distortion we take apart in silent form failures.
- Untagged owned media. Your own emails, PDFs and social posts without UTM parameters, which is self-inflicted and fixable in an afternoon.
Only the first is the dark funnel. The other three are measurement debt wearing the same costume, and teams routinely spend a quarter building a dark funnel programme when they had a broken hidden field.
How to decompose the direct bucket in an afternoon
You can separate most of this without buying anything. Filter direct sessions to landing pages that no human types from memory: a blog post with a long slug, a gated report, a pricing page reached without a homepage visit first. Nobody keys in a forty-character URL. Those sessions are shared links with the referrer stripped, and their share of the direct bucket is your dark social floor.
Then check the opposite end. Direct sessions landing on the homepage from returning visitors are mostly what the label claims to mean. The gap between those two groups, measured once, will tell you within an hour whether your direct traffic is a measurement problem or a demand signal.
IMPORTANT
Audit the cheap explanations before you buy anything. A direct-traffic share above 60% is common in B2B, but so is a form that has been silently dropping 8% of submissions for five months.
The three-layer system, compared
Once you accept that some demand will never carry a click, the question stops being “how do we track it” and becomes “what combination of instruments gets us close enough to make budget decisions”. Three methods do useful work, and each one corrects a specific failure in the one before it.
| Layer | What it measures | What it corrects | What it still misses | Effort |
|---|---|---|---|---|
| Self-reported attribution | What the buyer says brought them to you | Channels your model scores at zero because they produce no click | Recall bias; buyers name the most recent or most memorable touch, not the first | Low |
| Account-level rollup | Every known touch across every contact at the account | Person-level fragmentation, where six stakeholders look like six unrelated journeys | Anything that was never tracked in the first place | Medium |
| Incrementality testing | Outcome difference between an exposed group and a matched control | Correlation being read as causation, especially on brand and retargeting | Small-volume channels; slow to produce an answer | High |
None of these replaces your attribution model, and that distinction is where most implementations go wrong. The model still does the job of assigning credit across recorded touches, and choosing between models is its own decision, which we work through in detail in our guide to B2B marketing attribution. These three layers sit around that model to tell you where it is blind, where it is fragmented, and where it is confidently wrong.
Layer 1: designing the self-reported attribution question
Self-reported attribution is the practice of asking buyers directly how they found you, then treating those answers as a data set rather than as anecdotes. It is the cheapest instrument available and the most commonly botched.
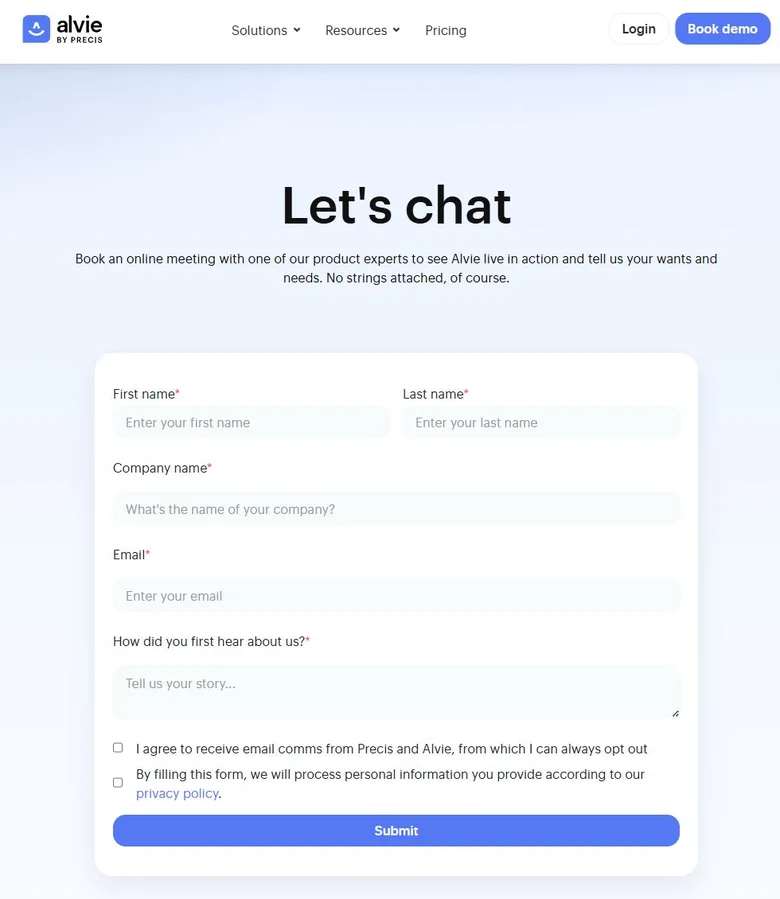
Start with how rare it is. In our audit of 150 public B2B demo, contact and signup forms, collected in June 2026, only 23 forms asked the question at all, and only 12 made it required. Among the 40 martech sellers in that sample, 31 did not ask. The full method and the row-level data are published in our B2B form attribution capture study. The companies best equipped to value self-reported data are mostly not collecting it.
The five decisions that determine whether the data is usable
Asking is not the hard part. These five choices decide whether you end up with a usable distribution or a column of noise.
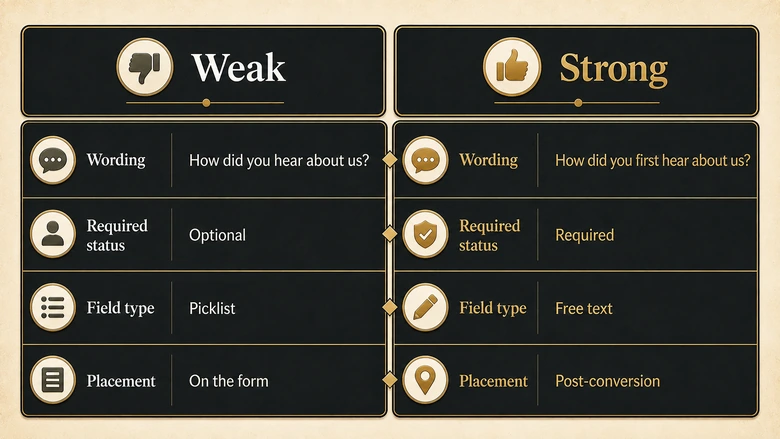
- Ask “first”, not “how”. “How did you hear about us?” invites the last thing the buyer remembers, which is usually your retargeting ad. “How did you first hear about us?” points at the origin, which is the thing your model cannot see.
- Make it required, and keep it to one field. Eleven of the 23 forms that asked made the field optional. An optional field produces a self-selected sample, and the people who skip it are not a random subset.
- Use free text, then code it. A picklist made of your own channel names will return your own channel names. Free text surfaces the podcast, the person and the community you did not know to list.
- Ask after conversion, not during. Put the question on the thank-you step or in the first sales call. On the form itself it costs conversion rate for data you can collect a moment later.
- Fix the coding scheme before you collect. Decide in advance whether “a friend told me” and “colleague recommendation” are one bucket or two. Recoding six months of free text retroactively is the reason most of these programmes are abandoned.
PRO TIP
Read self-reported answers against your model rather than instead of it. When buyers keep naming a podcast your multi-touch model scores at zero, that gap is the finding. Chasing agreement between the two defeats the purpose of running both.
A coding scheme you can copy
Free text is only useful once it is grouped, and the grouping has to survive the person who built it moving teams. Six buckets handle the overwhelming majority of B2B responses. Write the rule for each one down before the first response arrives.
| Bucket | Typical raw answers | Rule for inclusion | What it tells you |
|---|---|---|---|
| Personal recommendation | “A friend”, “former colleague”, “someone at my last company” | A named or implied individual, not an organisation | Your strongest and least measurable channel |
| Community or peer group | “Slack group”, “a subreddit”, “our CMO network” | A many-to-many space you do not own | Where to show up without selling |
| Audio or video | “Your podcast”, “an episode with…”, “a YouTube walkthrough” | Any long-form spoken content, yours or a guest spot | Almost always scored zero by click-based models |
| Search | “Google”, “searched for X”, “an AI assistant suggested you” | Any query-driven discovery, including AI assistants | Separate branded from unbranded at review time |
| Owned content | “Your newsletter”, “a report you published”, “your LinkedIn post” | Content you published on a property you control | Cross-check against what your model already credits |
| Third-party listing | “G2”, “a comparison article”, “an analyst note” | A site that evaluates or ranks vendors | Signals a buyer already in active evaluation |
Two rules keep the scheme honest over time. Never add a bucket mid-quarter, because it breaks comparison with everything collected before it. And keep an “unclear” bucket rather than forcing ambiguous answers into a real one; the size of that bucket is a useful measure of how well the question is working.
What this layer cannot do
People misremember. They compress months of research into one remembered moment, and they name brands more readily than they name mechanisms. Self-reported attribution is a directional correction to a model that is systematically blind in one direction. It is not a ledger, and any team presenting it to a board as precise revenue credit has overstated it.
Layer 2: rolling attribution up to the account
Account-level attribution assigns credit to the buying account rather than to individual contacts, then reads every touch from every stakeholder as one journey. It exists because person-level attribution quietly misrepresents how B2B purchases happen.
A committee of six people generates six contact records. The champion downloads the report, the finance lead reads only the pricing page, the security reviewer arrives from a compliance page nine weeks later. At the person level these look like six unrelated journeys, five of which appear to convert to nothing. Roll them to the account and the shape of the actual evaluation appears.
The same deal, read two ways
The difference is easiest to see on a single account. Take a closed deal with four identified stakeholders and eleven recorded touches across five months.
| Stakeholder | Recorded touches | Person-level reading | Account-level reading |
|---|---|---|---|
| Champion (Head of Demand Gen) | 6, ending in the demo request | Converted. Credit goes to the last channel before the form | One of four contributors, and not the earliest |
| VP Marketing | 3, all organic search on comparison terms | Unconverted lead. Looks like a dead follow-up sequence | The first recorded touch on the account, five months out |
| Finance lead | 1, a pricing page visit in week 14 | Bounced visitor. Discarded | Evidence the deal reached commercial review |
| Security reviewer | 1, a compliance page in week 18 | Bounced visitor. Discarded | Evidence the deal reached procurement |
Read per person, three of the four are failures and the comparison content that started the whole thing gets no credit. Read per account, the sequence is legible: comparison search opened it, the champion carried it, and two late-stage visits mark the stages a forecast actually cares about. Nothing new was tracked. Only the unit of analysis changed.
What the rollup needs to work
Three things have to be true before an account-level view produces anything trustworthy, and most stalled implementations fail on the second.
- Resolution. Every touch has to be tied to an account record, not to an email address or an IP range. Anonymous sessions resolved by reverse-IP lookup carry real error rates and should be labelled as inferred rather than observed.
- An agreed account boundary. Subsidiaries, regional entities and resellers have to be decided once. Teams that skip this end up with the same buying group counted three times.
- A window that matches the cycle. With cycles around ten months, a 90-day lookback discards most of the evidence, which is a model-design question rather than a rollup question.
The signals feeding this layer are the same ones sales teams act on, and they decay at very different rates, which we map signal by signal in our guide to signal-based selling. Where those signals come from, and how much of them are inferred rather than observed, is covered in our explainer on B2B intent data.
Layer 3: incrementality, the only layer with a control group
Incrementality testing measures the difference in outcome between a group exposed to a marketing activity and a matched group that was not. It is the only method in this article that tests causation rather than correlation, because it is the only one that withholds the activity from somebody.
Incremental lift = (Test group conversions − Control group conversions) ÷ Control group conversionsThe design question is what to hold out. Geographic holdouts split matched regions and suppress the channel in the control set, an approach formalised in Google’s research on measuring ad effectiveness using geo experiments. Account holdouts suppress a channel against a randomly selected slice of your target list, which suits ABM programmes where geography is not a clean dividing line.
Sizing the test before you run it
Most incrementality tests fail for one reason: they were never large enough to detect the effect being looked for. Decide the minimum detectable effect first, because it determines everything else.
If a channel plausibly drives a 5% lift and your test is only powered to detect 20%, the result will be a confident-looking null that means nothing. Work backwards from your conversion volume and baseline variance to a detectable threshold, hold the control group untouched for the full window, and run long enough to cover a meaningful share of a ten-month cycle rather than a fortnight of it.
What to do when the volume is not there
In practice that sizing runs into the structure of B2B. A team producing 40 opportunities a month cannot detect a 5% lift in any reasonable window, because the effect is smaller than the month-to-month noise in the baseline. Three responses are honest, and picking one is a real decision rather than a technicality.
- Move the measured outcome earlier. Test against qualified opportunities or high-intent page visits instead of closed revenue. Volume rises, variance falls, and the test becomes feasible, at the cost of measuring a proxy rather than the thing you care about.
- Test bigger. Hold out a larger share, accept a larger revenue risk for the window, and get an answer about the effect size you actually care about.
- Do not test. If the channel is too small to size a test around, it is usually too small to justify the effort. Leave it to the self-reported layer and spend the test on something material.
Whichever you choose, write the minimum detectable effect and the decision rule into the test plan before launch. A test with no pre-committed threshold becomes an argument about whether a 6% difference was real, and that argument is always won by whoever owns the channel.
IMPORTANT
When attribution and incrementality disagree, incrementality is the one with a control group. Brand campaigns and retargeting are where they diverge most often, and retargeting is where an attribution model most reliably takes credit for demand that already existed.
When to trust which layer, and what none of them see
The three layers answer different questions, so the useful discipline is knowing which one to reach for rather than running all three continuously.
- Use self-reported attribution when you suspect a channel produces no click at all, and when you need an answer in weeks rather than quarters. It is the right first move for podcasts, communities and word of mouth.
- Use account-level rollup when deals involve committees and your per-contact conversion rates look implausibly bad. It is a reporting change more than a research project.
- Use incrementality testing when real budget depends on the answer and the channel is large enough to test. Reserve it for the two or three line items where being wrong is expensive.
- Avoid all three as a replacement for your attribution model. They tell you where the model is blind. They do not assign credit across recorded touches, and swapping one for the other produces a different set of wrong numbers.
The residue
Some influence stays unmeasured, and saying so plainly is more useful than pretending otherwise. No layer here recovers the specific Slack message that put you on the shortlist, or the conference conversation two years ago that made your name familiar. Buyers increasingly run early research through AI assistants that pass no referral data at all, which is a blind spot that is growing rather than shrinking, and one we track separately in our work on customer journey attribution.
The goal is not a complete picture. It is a picture with known and stated gaps, which is a materially different thing from a report that assigns 100% of credit and never mentions what it could not see. If you are evaluating platforms to do some of this work, the category is surveyed in our roundup of B2B attribution software.
Frequently Asked Questions
The dark funnel is the set of buying interactions that produce no trackable event: private community discussions, peer recommendations, podcasts, review-site browsing and messaging-app shares. These reach buyers without passing through a link you control, so they surface in analytics as direct traffic or leave no record at all.
You measure it indirectly, with three layers. Ask buyers how they first heard about you and code the answers. Roll every known touch up to the account rather than the contact. Then run incrementality tests on the channels where budget decisions are expensive. Each corrects a different weakness in the others.
It is directionally reliable and precisely unreliable. Buyers misremember and tend to name the most recent or most memorable touch rather than the first. Treat it as a correction to a model that is blind to clickless channels, not as a revenue ledger. Required free-text fields produce far better data than optional picklists.
No. Attribution still does the job of assigning credit across the touches you did record, which is most of the late-stage journey. What it cannot do is report on evidence it never received. The failure is presenting a model’s output as complete rather than as a partial view with a stated gap.
About 61%, according to 6sense’s 2025 B2B Buyer Experience Report, down from 69% the previous year. Much of the industry still quotes the older 70% figure. The unobserved window shortened, but four out of five deals are still won by the vendor the buyer preferred before making contact.