
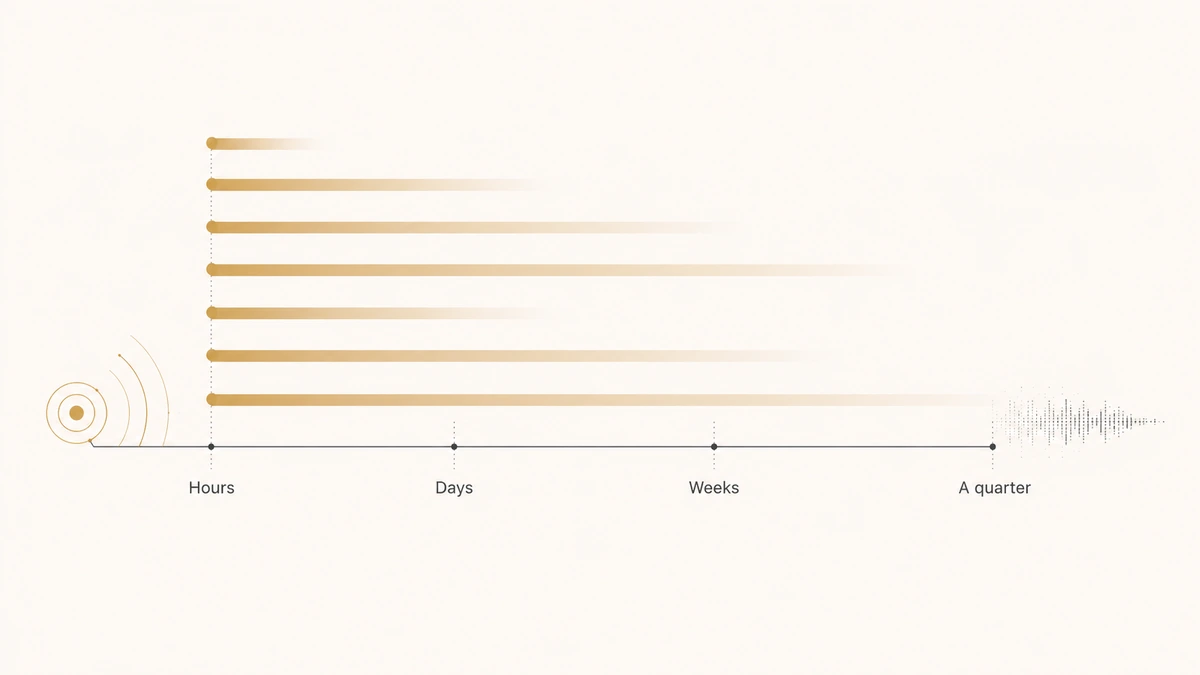
Three of the vendor guides ranking for signal-based selling right now publish a table telling you how long a buying signal stays worth acting on. They do not agree with each other. ZoomInfo gives a funding announcement three to five days. Amplemarket gives the same signal sixty. A pricing-page visit expires in twenty-four hours on one of those pages and seventy-two on the other (both figures checked as of Q3 2026).
Those numbers cannot all be right, and the gap between them is not carelessness. It is two different questions wearing the same label. How fast you should respond to a signal, and how long that signal keeps predicting anything, are separate measurements. Almost every published decay table collapses them into a single column, which is why the published windows differ by a factor of twelve for the same event.
This guide separates them. You get the signal taxonomy, a response clock and a validity clock for each signal class, the evidence behind every window, and the rule for deciding which signal wins when two land on the same account in the same week.
Direct answer — What is signal-based selling?
Signal-based selling is a B2B sales method that triggers outreach from observable buyer events rather than from a static prospect list. Signals include funding rounds, executive hires, pricing-page visits, tech-stack changes and third-party research surges. Every signal carries two clocks: a response window, meaning how quickly you must act before a competitor reaches the account, and a validity window, meaning how long the underlying condition stays true. Acting outside either window returns cold-outreach results.
Key Takeaways
- Signal-based selling replaces list-order prospecting with event-triggered prospecting. The list does not change; the order and the timing do.
- Published decay windows contradict each other because vendors mix response time with signal validity. Separate the two clocks and the contradictions resolve.
- The strongest evidenced window is the executive hire. UserGems reports new executives spend 70% of their budget in their first 100 days, which makes a new VP a 30-to-90-day opportunity, not a two-week one.
- Speed matters because position matters. 6sense found the first vendor contacted wins eight deals in ten, and buyers pick from their day-one shortlist 95% of the time.
- Signals rank accounts. They do not qualify them. A signal on a company outside your fit criteria is still a bad account, just a faster bad account.
What is signal-based selling?
Signal-based selling is a B2B sales method in which outreach is triggered by an observable buyer event rather than by a rep working down a static list. The event, called a signal, is evidence that an account has entered or is entering a buying cycle. Sequence, message and timing all derive from that event.
The method is a reordering, not a new source of demand. You are not reaching more accounts; you are reaching a subset of the same accounts at a moment when the probability of a reply is materially higher. Teams that misread this buy a signal feed, keep their existing volume targets, and conclude the feed did not work.
Three terms get used interchangeably and should not be. Intent data is one input class among several, covering research behaviour on your site and across publisher networks. Trigger selling is the older term for the same practice, usually limited to news events like funding and hiring. Signal-based selling is the umbrella: any observable event, from any source, that changes what you should do next on an account.
If you are still working out which behavioural inputs are worth buying versus instrumenting yourself, the mechanics of first-party, second-party and third-party intent data come first. This guide assumes the feeds exist and answers the next question, which is what to do with them and when.
Signal-based selling vs traditional prospecting
Traditional prospecting selects accounts by fit and works them in list order. Signal-based selling selects the same accounts by fit and works them in event order. The difference is narrower than most vendor marketing suggests, and the narrowness is the point.
| Dimension | Traditional prospecting | Signal-based selling |
|---|---|---|
| Account selection | Fit criteria applied to a static list | Identical fit criteria, unchanged |
| Work order | Alphabetical, territory, or account size | Event recency and signal precision |
| Trigger to contact | Cadence and rep capacity | An observable buyer event |
| Message basis | Persona and pain hypothesis | The specific event, plus persona |
| Volume | As many accounts as capacity allows | Fewer accounts, worked faster |
| Main failure mode | Right account, wrong month | Right month, wrong account, when fit gating is skipped |
| Infrastructure needed | CRM and a sequencer | CRM, sequencer, event storage, identity resolution |
Use signal-based selling when your total addressable market is larger than your team can work in a quarter, your sales cycle is long enough that timing changes the outcome, and you already have fit criteria you trust. Stay with list-based prospecting when your market is small enough to contact everyone quarterly, because in that case event ordering only changes the sequence of calls you were going to make anyway.
Avoid it entirely when your fit criteria are unsettled. Signals amplify whatever targeting logic sits underneath them, including bad targeting logic, and they amplify it at speed.
The nine signals that actually predict a purchase
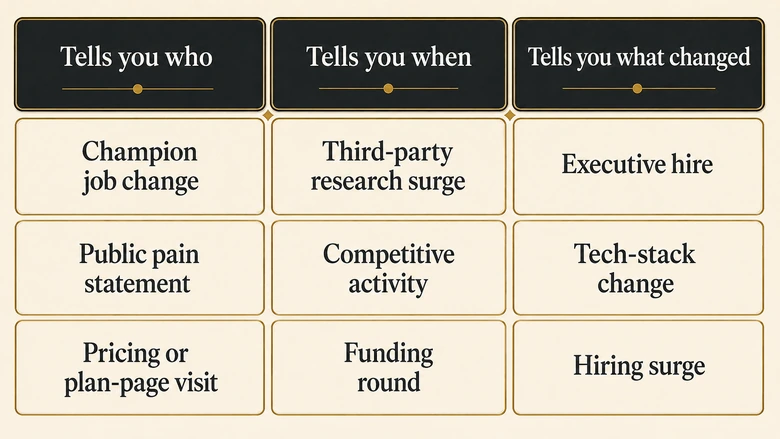
A useful signal taxonomy sorts by what the event tells you, not by where it came from. Two signals from the same vendor can mean completely different things, and two signals from different vendors can mean the same thing twice. The table below is organised by inference.
| Signal class | What fires it | Typical source | What it actually tells you |
|---|---|---|---|
| Pricing or plan-page visit | A known account views commercial pages | Your own site, de-anonymisation vendor | Someone is costing you out. Late-stage, high precision, low volume |
| Executive hire into a buying role | New VP, C-level or head of function starts | LinkedIn, job-change vendors | New budget authority and a mandate to change something |
| Champion job change | A past user or advocate moves companies | Job-change vendors, CRM contact matching | A warm relationship has been transplanted into a cold account |
| Funding round | Seed through growth round announced | Press, Crunchbase, SEC filings | Money exists and a spending plan is being written now |
| Competitive activity | Account engages a competitor or nears renewal | Review sites, technographics, social | An incumbent is being evaluated, not necessarily replaced |
| Tech-stack change | A tool is added to or dropped from the stack | Technographic vendors, site scanning | An integration gap or a displacement opening |
| Third-party research surge | Anonymous topic research above the account baseline | Co-op intent networks | Somebody at the account is researching. Rarely who, rarely why |
| Hiring surge in a function | Sustained req volume in a relevant team | Job boards, careers pages | A structural expansion that creates tooling need later |
| Public pain statement | A named person describes the problem you solve | Social, communities, review text | The highest-context signal available, and the rarest |
The rightmost column is the one that matters and the one most taxonomies omit. A third-party research surge and a pricing-page visit both get labelled “intent,” but one tells you an unidentified person at a company read something, and the other tells you a named account looked at your prices. Treating them as equivalent inputs to the same score is the most common design error in signal programmes.
Two clocks, not one: response time and signal validity
Every signal runs two independent timers, and conflating them is what produces contradictory vendor tables. Separate them and the disagreements stop being disagreements.
The response clock: how long before a competitor acts
The response clock measures competitive urgency. It answers one question: how long before someone else acts on this same event? It is short, and it is short for reasons that have nothing to do with the buyer. Co-op intent data is sold to every vendor in a category at once. Funding announcements are public. Job changes are visible to anyone with a LinkedIn filter. You are racing peers, not the buying cycle.
The validity clock: how long the condition stays true
The validity clock measures whether the condition the signal indicated is still true. It answers a different question: if I contact this account today, is the thing that made them interesting still happening? A new VP hired eight weeks ago is still new. A pricing-page visit from eight weeks ago tells you nothing, because the evaluation it belonged to has either closed or died.
Read the vendor tables again with that distinction in hand. ZoomInfo’s “three to five days” for funding is a response window: move before the other twelve vendors reading the same press release. Amplemarket’s “sixty days” for funding is a validity window: the money is still unspent. Neither is wrong. Both are incomplete, because a single number cannot answer both questions.
IMPORTANT
A short response clock does not mean a short validity clock. Missing the response window costs you the advantage of being first. Missing the validity window costs you the entire reason for the call.
The response clock has a floor that most teams never reach, and it is not a signal problem. It is a routing and instrumentation problem. If an inbound demo request already takes your team four hours to reach a rep, a two-hour response target on a pricing-page visit is fiction. The four separate clocks that make up real response time on inbound leads apply unchanged to signal-triggered work, and the same queues break both.
How long each signal stays worth acting on
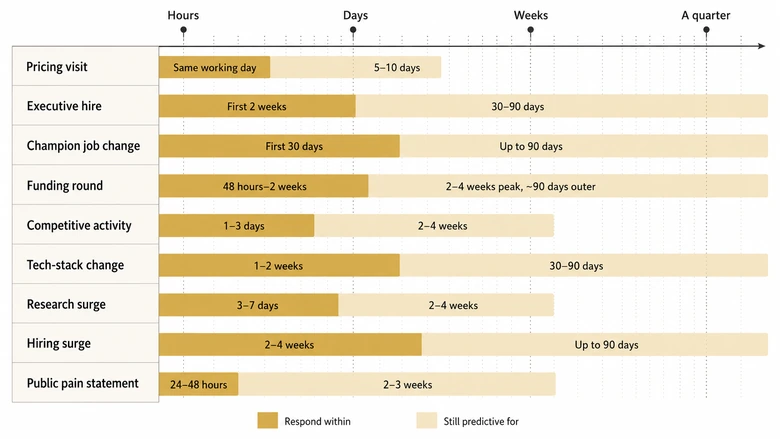
The table below is the operating framework this article exists to publish. Every row carries both clocks and the evidence behind them. Where a window rests on measured research it says so; where it is an operating default chosen for framework design, it says that instead.
| Signal | Respond within | Still predictive for | Evidence basis |
|---|---|---|---|
| Pricing or plan-page visit | Same working day | 5–10 days | Operating default. Vendor-published figures of 24 and 72 hours are response targets, not validity limits |
| Executive hire into a buying role | First 2 weeks | 30–90 days | Best-evidenced row. UserGems reports 70% of budget spent in the first 100 days and 2.5× conversion for VP and Director titles in months one to three |
| Champion job change | First 30 days | Up to 90 days | Same UserGems job-change dataset. Warmth decays slower than novelty |
| Funding round | 48 hours to 2 weeks | 2–4 weeks peak, ~90 days outer | Peak is an operating default. Vendors publish 3–5 days and 60 days for the same event, measuring different clocks |
| Competitive activity | 1–3 days | 2–4 weeks | Operating default, bounded by vendor-published ranges of 7 days to 2 weeks |
| Tech-stack change | 1–2 weeks | 30–90 days | Operating default. One vendor publishes a 90-day expiry; the underlying migration is genuinely slow |
| Third-party research surge | 3–7 days | 2–4 weeks | Operating default. Bombora, which coined the Company Surge term, publishes no decay figure on its data page |
| Hiring surge in a function | 2–4 weeks | Up to 90 days | Operating default. Structural signals move on hiring timelines, not buying timelines |
| Public pain statement | 24–48 hours | 2–3 weeks | Operating default. Response window is short because the statement is public and others read it too |
Two rows deserve expansion, because they are where the published figures diverge most sharply from what the evidence supports.
The executive hire is a quarter, not a fortnight
Vendor tables commonly expire a job-change signal at 14 to 30 days. The available research points the other way. UserGems reports that new executives spend 70% of their budget within their first 100 days, and that Director and VP titles convert at 2.5 times their first-quarter rate compared with after a year in post. Both figures are UserGems’ own internal analysis rather than independent research, and should be read as vendor-reported, but they are directionally consistent with how new leaders behave: audit the inherited stack, find something to fix, buy the fix.
What expires at two weeks is your advantage, not the opportunity. Reach a new VP in week one and you are one of three vendors in the inbox. Reach them in week nine and you are one of thirty, but they are still buying. Treating the 14-day mark as an expiry deletes ten weeks of a live buying window from your pipeline.
The pricing-page visit is not a lead
The opposite error applies here. A known account viewing your pricing page is high-precision and short-lived, but it is not an inbound lead and should not enter the same queue. Nobody filled in a form. Nobody asked to be contacted. The response window is same-day because the evaluation is active; the validity window runs five to ten days because B2B evaluations do not resolve in an afternoon, and a second visit inside that period is a far stronger signal than the first one was.
PRO TIP
Log signal timestamp and ingest timestamp as separate fields. If they are one field, you cannot tell whether a stale signal decayed naturally or sat in a broken pipeline for six days, and every decay rule you write will be measuring your own latency.
Which signal wins when two fire at once
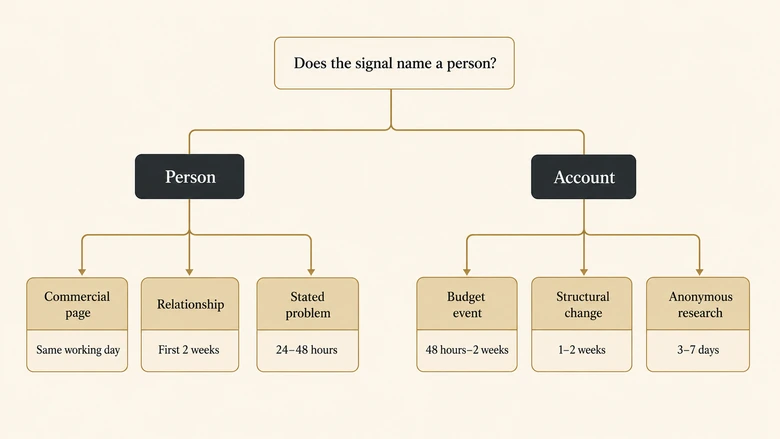
Ranking by signal strength alone breaks the moment an account produces two signals in the same week, which good accounts do constantly. Use precision, not loudness, as the tiebreaker. A signal that identifies a named person beats one that identifies a company, and a signal about your category beats one about the market.
- Named person plus commercial page. A known contact on pricing or plans. Highest precision available. Act same day.
- Named person plus relationship. A champion who has moved, or a new executive you have history with. Act inside 2 weeks.
- Named person plus stated problem. A public pain statement from someone in the buying group. Act inside 48 hours.
- Account plus budget event. Funding, expansion or a new executive with no prior relationship. Act inside 2 weeks.
- Account plus structural change. Tech-stack movement, hiring surge, competitor renewal. Act inside 2 weeks, expect a longer cycle.
- Account plus anonymous research. Third-party surge with no named contact. Lowest precision. Use it to prioritise, never to personalise.
Two rules sit on top of that order. First, stacking beats strength: two independent signals inside 14 days outrank one stronger signal alone, because independent confirmation is the only cheap correction for false positives. Second, fit gates everything. A signal on an account outside your ICP is not an opportunity that arrived early. It is a bad account that arrived fast.
That second rule is where signal programmes most often go wrong in the scoring layer. Signals belong in the prioritisation model, not the qualification model. The criteria and point values that decide whether a record is worth working at all should still be doing that job; signals decide the order of the accounts that already passed.
Three plays, written to the window
A signal without a play is a notification. What follows is the same three signals every competitor guide lists, written against both clocks rather than against a generic “reach out quickly” instruction.
Play 1: the new VP, worked across ten weeks
A VP of Revenue Operations starts at a fit-qualified account. The response window is two weeks and the validity window runs to 90 days, so the play is a sequence rather than a sprint.
Weeks one to two, reach out on the mandate, not the product: what they have inherited and what usually breaks in it. Weeks three to six, when the audit is underway and they have found the problem, send the specific artefact that addresses it. Weeks seven to ten, when budget conversations start, arrive with the business case. Most teams fire once in week one, get silence because the new VP is still in onboarding, and mark the signal dead at exactly the moment it becomes useful.
Play 2: the funding round, worked in two passes
An account announces a Series B. The response window is 48 hours to two weeks, the peak validity window is two to four weeks, and the outer bound runs to roughly a quarter.
The first pass, inside the response window, is not a pitch. It is a relevance claim: what companies at this stage typically hit within two quarters of a raise. The second pass, at three to four weeks, lands when the spending plan has moved from a slide to a budget line and the buying group is actually named. Teams that only run the first pass are competing with every other vendor who read the same announcement on the same morning.
Play 3: the repeat pricing visit
A known account views your pricing page twice in six days. The response window is same-day on the second visit; the validity window is five to ten days from the most recent visit.
The second visit is the play, not the first. One visit is research. Two visits inside a week is an internal conversation happening between them, usually with someone who was not on the first visit. Route it to a human the same day, reference the commercial question rather than the page view, and treat the ten-day mark as a hard expiry rather than a suggestion.
The signal stack, layer by layer
Four layers have to exist before a decay policy can be enforced, and teams routinely buy layer one while missing layer two, which is why so many programmes stall at “we have the data and nothing happens.”
Detection is the feed layer. Third-party research surges come from co-op networks such as Bombora, or from platforms like 6sense and Demandbase that bundle intent with account scoring. Job changes and champion moves come from job-change trackers. Funding and news come from Crunchbase and press monitoring. Community and social signals come from tools built for that surface.
Resolution is the layer teams skip. A signal arrives attached to a domain, an IP range, an email address or a LinkedIn profile, and none of those is an account record until something reconciles them. Without this layer every downstream window is applied to the wrong object, and the same account appears three times in the queue under three identifiers.
Prioritisation applies the two clocks and the tiebreaker order, then produces a ranked queue with automatic expiry. This is where the decay policy actually lives. If it lives in a rep’s judgement instead, it is not a policy.
Execution and measurement is the sequencer plus the reporting that closes the loop by signal class. Salesforce and HubSpot hold the outcome; the sequencer holds the attempt; the class label has to survive the journey between them or the quarterly review has nothing to review.
Why the timing advantage is worth this much work
The case for signal-based selling does not rest on reply rates. It rests on shortlist position, and the research there is unusually clear.
6sense’s 2025 B2B Buyer Experience Report, drawn from roughly 4,000 buyer responses, found that buyers now make first contact with sellers around 61% of the way through their buying journey, up from 69% the year before, which compresses the seller-visible window by six to seven weeks. The average cycle runs 10.1 months, buyers evaluate 5.1 vendors, the vendor contacted first wins eight deals in ten, and buyers select their eventual vendor from the day-one shortlist 95% of the time.
If the day-one shortlist decides the deal 95% of the time, every hour of a signal’s response window is spent competing for a place on a list that has not been written yet.
That is the whole economic argument. Signal-based selling is not a way to write better emails. It is a way to be present during the short unobserved period when the shortlist forms, which is exactly the period the 6sense data says you are absent for.
Where signal-based selling breaks
Four failure modes account for most disappointed programmes, and three of them are structural rather than tactical.
Co-op data is not exclusive. Third-party intent networks sell the same surge to every vendor in the category. If a surge is visible to you, assume ten competitors saw it the same morning. This is the most common complaint in practitioner forums, and it is accurate. The correction is not a better feed; it is pairing bought signals with owned ones nobody else can see.
Signal volume scales faster than capacity. A team that could work 40 accounts a week does not become able to work 300 because a feed surfaced 300. Without a decay policy and a priority order, the extra volume produces the same output with more noise, which reads internally as the feed failing.
The infrastructure is usually the real constraint. Signals arrive as events with timestamps, entity references and properties, and most CRMs were not designed to hold them. Programmes stall on identity resolution and event schema long before they stall on signal quality. This is downstream of a broader question about which behavioural events you own and can define, which the six-layer model for first-party data covers at the architecture level.
Nobody measures signal-to-outcome by class. Teams measure reply rate on signal-triggered sequences in aggregate. That number is always flattering, because the pricing-page rows carry it. Measure conversion per signal class or you will never learn which of your nine feeds is worth renewing.
How to set a decay policy for your signals
Publishing windows is a desk exercise you can finish in an afternoon. Running them requires the timestamps to exist, which is the step teams skip.
Workflow · 90 min
How to set a signal decay policy: from feed inventory to enforced expiry
Produces a written policy giving every signal class a response window, a validity window and an automatic expiry, so stale signals leave the queue without anyone deciding to remove them.
Inventory every signal feed you already pay for
List each source, the signal classes it emits, and the refresh frequency. Most teams find two feeds emitting the same class and one nobody has opened in a quarter.
Classify each feed by inference, not by vendor
Map every feed to a row in the taxonomy above. Split any feed that emits both named-contact and account-only signals into two classes, because they will not share a window.
Assign both clocks to every class
Write a response window and a validity window per class. Start from the matrix above, then adjust for your own sales cycle length before anyone argues about the numbers.
Store signal time and ingest time separately
Add both fields to the signal object in your CRM or warehouse. Without the pair you cannot distinguish a decayed signal from a delayed pipeline, and every window becomes unenforceable.
Set automatic expiry at the validity window
Configure the queue to drop a signal when it passes its validity window rather than waiting for a rep to skip it. Manual triage of stale signals is how capacity gets consumed.
Instrument conversion per signal class
Report meetings and opportunities by class, not in aggregate. Review quarterly and adjust the two windows against what your own data shows rather than against any published table.
How to measure a signal programme
Aggregate reply rate on signal-triggered sequences is the metric most teams report and the least useful one available. It blends nine signal classes with wildly different precision into a single number that the pricing-page rows carry, which means it stays healthy while six of your feeds quietly fail.
Report these four instead, always cut by signal class rather than in aggregate.
Signal yield = Qualified meetings from class ÷ Signals actioned from classSignal yield tells you whether a feed is worth renewing. Expect wide spread. A pricing-page class in the tens of percent and a third-party surge class in the low single digits is a normal, healthy distribution, not a sign the surge feed is broken. It is a sign the two belong in different queues with different effort budgets.
In-window rate is the share of actioned signals that were touched inside their response window. This is the operational metric, and it is usually the one that explains a disappointing yield. If 30% of your executive-hire signals are being worked in week five, the feed is fine and the routing is not.
Expiry rate is the share of signals that aged out of the validity window untouched. A rising expiry rate on a high-yield class is the clearest capacity signal you will get, and it argues for narrowing the fit gate rather than hiring.
Stacked-signal lift compares conversion on accounts with two or more independent signals inside 14 days against single-signal accounts. If the lift is absent, your signals are not independent, which usually means two feeds are reselling the same underlying co-op data under different labels.
Review all four quarterly, and change the published windows when your own data disagrees with them. The matrix in this article is a starting position, not a standard. A team with a six-week sales cycle and a team with a nine-month cycle should not end up with the same numbers, and if they do, neither has been measuring.
Methodology and revision note
Two limitations are worth stating outright, in the same terms this site applies to every framework it publishes.
First, only two rows in the decay matrix rest on published research: the executive-hire and champion-job-change rows, both drawn from UserGems’ internal analysis and labelled as vendor-reported rather than independent. Every other window is an operating default chosen for framework design, bounded where possible by the ranges vendors publish. They are starting points for calibration, not measured market figures.
Second, no public study we could locate measures signal validity separately from response time across contemporary B2B workflows, which is why the vendor tables contradict each other and why this framework had to be constructed rather than cited. If you hold a primary source that corrects any window here, we would rather update the page than defend it.
Vendor-published windows referenced in this article were checked in Q3 2026 and are subject to change without notice on the source pages.
Frequently Asked Questions
Signal-based selling is a B2B method that triggers outreach from observable buyer events rather than from a static list. Funding rounds, executive hires, pricing-page visits and tech-stack changes each indicate an account has entered a buying cycle, and the event determines the timing and the message.
It depends on the signal class and on which question you are asking. A pricing-page visit needs a same-day response but stays predictive for five to ten days. An executive hire needs a two-week response but stays predictive for 30 to 90 days. Response time and validity are separate clocks.
Contacting a target account the week a new VP of Revenue starts. Reaching a former customer who has just moved to a non-customer company. Sequencing an account within days of a funding announcement. Prioritising a known account that viewed your pricing page twice in one week.
No. Intent data is one input class, covering research behaviour on your site and across publisher networks. Signal-based selling is the wider method, using any observable event including funding, hiring, job changes and tech-stack movement. Intent data feeds a signal programme; it does not constitute one.
Because vendors publish one number for two different measurements. A three-to-five-day funding window is a competitive response target. A sixty-day funding window describes how long the budget stays unspent. Both are defensible; neither answers the other question, so the tables appear to contradict each other.





