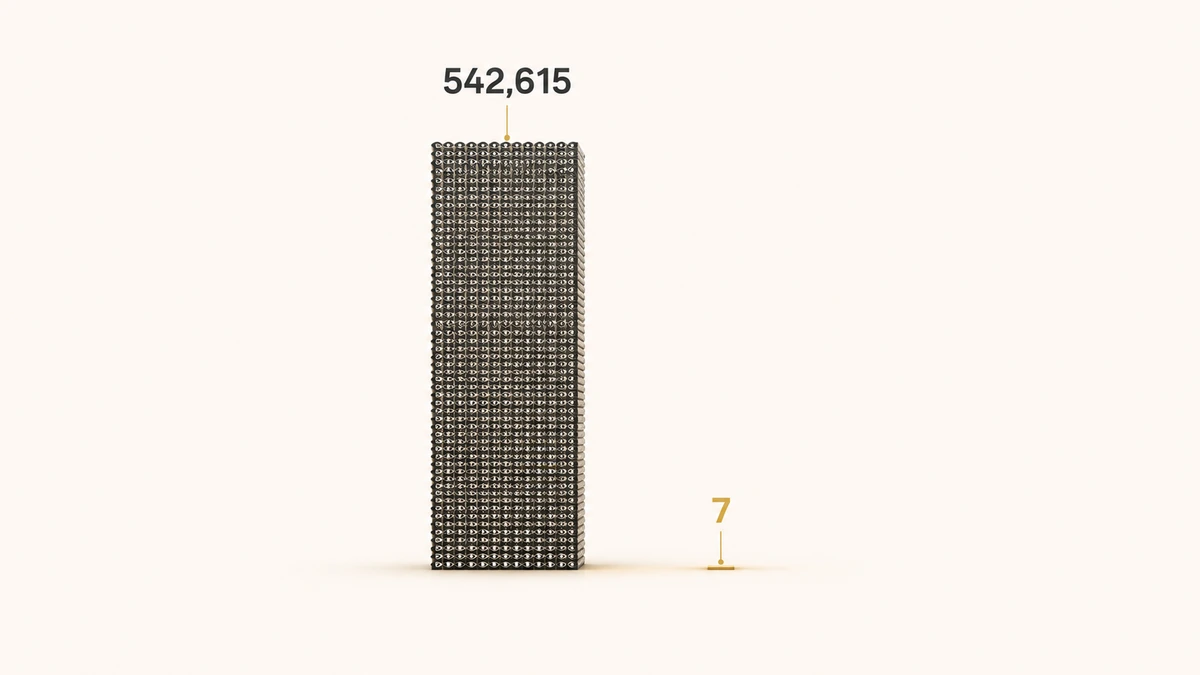
Between 19 March and 31 August 2026, two pages on IVRIS Tech drew 692,400 ordinary Google Web Search impressions at a combined average position of 3.57. They produced seven clicks.
Not seven thousand. Not seven hundred. Seven.
Position was not the problem. After the cutoff used in the original article, the same two pages added another 149,638 impressions from 12–31 August at an average position of 3.48—and zero additional clicks. The anomaly became stronger, not weaker.
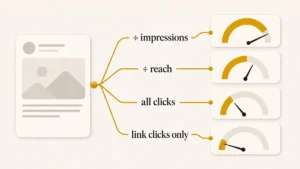
That is why AI search visibility measurement needs more discipline than a single visibility score. A dashboard can show rising impressions, strong average positions, more mentions, and improving share of voice while the commercial outcome barely moves. At the same time, a brand can be described more accurately or displace a competitor in AI answers before any traffic metric notices.
This guide keeps the strongest framework from our original article and updates the evidence underneath it. It uses our own Search Console and analytics data, first-party AI reporting available from Google and Bing, a repeatable prompt-tracking method, and an operating lesson from our exclusive interview with Carmen Hughes, founder of Ignite X.
Direct answer — How do you measure AI search visibility?
Measure AI search visibility with two evidence layers. First-party data shows what actually reached your site or was cited by supported search platforms. A fixed prompt panel shows how often AI systems mention, cite, position, and describe your brand relative to competitors. Keep four core metrics—citation frequency, AI share of voice, AI-referred traffic, and the visibility-to-visit gap—then use diagnostic metrics such as brand inclusion, recommendation position, representation accuracy, competitor displacement, and citation-source mix to explain why the core numbers move.
Key Takeaways
- Keep first-party exposure, prompt-tracking results, and business outcomes separate. They measure different populations.
- Four core measures still carry the load: citation frequency, AI share of voice, AI-referred traffic, and the gap between visibility and identifiable visits.
- Our updated two-page GSC case now stands at 692,400 Web Search impressions, seven clicks, and a 3.571 average position through 31 August 2026.
- The anomaly persisted after the original study window: 149,638 additional impressions and zero clicks from 12–31 August.
- Across 501 exposed query rows, 397 queries were 7–19 words long and generated 511,233 impressions. That pattern is worth investigating, but query length does not identify an AI system.
- Google’s dedicated Generative AI export confirms that the two pages did appear in AI Overviews or AI Mode—but only 216 impressions combined in the 19 March–2 September export, versus 692,400 ordinary Web Search impressions through 31 August. That is exactly why the two datasets must not be conflated.
- Carmen Hughes’s page-clock versus brand-clock distinction remains useful for reporting: citation and representation signals can move before broader brand treatment or pipeline does.
- Tools are collectors, not measurement models. Ahrefs, Semrush, Profound, Peec AI, and OtterlyAI use related but non-identical definitions and datasets.
What AI Search Visibility Measurement Actually Is
AI search visibility measurement is the practice of observing whether an AI system includes your brand, cites your pages or other pages about you, positions you ahead of competitors, describes you accurately, and ultimately sends or influences demand.
That is broader than SEO rank tracking. In classic organic search, the page is the unit: a URL ranks at a position for a query. In AI search, several units compete at once. Your brand may be recommended without a link. Your domain may be cited without the brand being recommended. A third-party review page may be the source that causes your brand to appear. And the generated answer may change on the next run. A September 2026 preprint adds a useful boundary: the query-blind GEO score’s 0.114 citation correlation was weak, while query-conditioned models in the same study reached roughly 0.37 to 0.38.
So “are we visible?” is not one question. For a B2B team it becomes at least five:
- Are we present in the answer?
- Are our own pages cited?
- Do we appear more often or more prominently than competitors?
- Is the description accurate and commercially useful?
- Does any of that presence turn into traffic, branded demand, opportunities, or revenue?
The mistake is not tracking several metrics. The mistake is pretending those metrics are interchangeable readings of one hidden “AI visibility” number.
The Four Core Metrics Worth Keeping
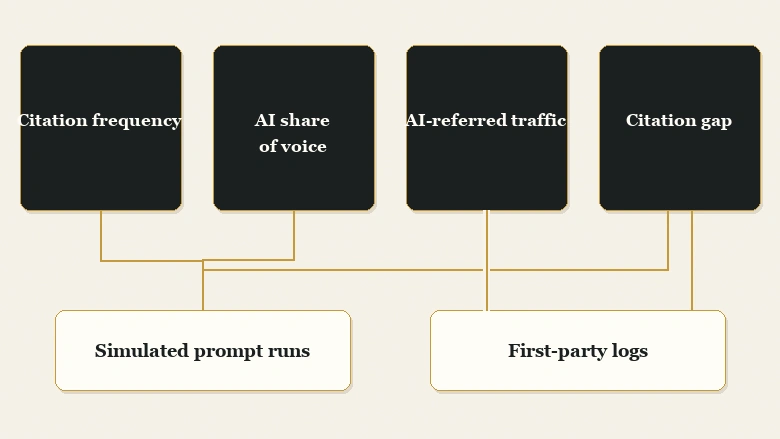
These four measures answer the questions an executive team actually needs answered. They should remain separate because each comes from a different evidence base.
| Core metric | Question it answers | Best evidence source | Main limitation |
|---|---|---|---|
| Citation frequency | How often are our pages or domain used as a source? | Bing Webmaster Tools; fixed prompt tracking; vendor citation datasets | A citation does not prove a buyer noticed or trusted it |
| AI share of voice | How much of the tracked AI answer space do we occupy versus competitors? | Frozen prompt panel or one consistent vendor dataset | The denominator changes by provider and prompt universe |
| AI-referred traffic | How many identifiable visits actually arrived from AI assistants? | GA4, server logs, referrer strings | Misses no-click influence, stripped referrers, direct and delayed branded visits |
| Visibility-to-visit gap | Is AI/search visibility growing faster than identifiable human response? | Read first-party exposure and traffic side by side | It is a diagnostic gap, not a clean cross-platform subtraction |
The fourth row is deliberately not presented as a universal formula. Our earlier version treated the “citation gap” as a subtraction between exposure and sessions. That is useful as a direction, but those counts can come from different systems and populations, so subtracting them can imply more precision than the data deserves.
IMPORTANT
Do not subtract Google AI impressions, ChatGPT referral sessions, and modeled branded visits and call the result an exact “gap.” Put exposure and identifiable response beside each other. If one accelerates while the other stays flat, the gap is real even when its exact size is unknowable.
Use formulas only when the denominator is stable
For a fixed prompt panel, the simplest normalized measures are:
Cited responses ÷ total tracked responses × 100Responses mentioning the brand ÷ total tracked responses × 100Your brand mentions ÷ total mentions of you + tracked competitors × 100Even the phrase AI share of voice is not standardized. For example, OtterlyAI defines share of voice from brand mentions across the tracked set, while Ahrefs Brand Radar uses an impression-weighted comparison. Both can be useful. They are not the same number.
That is why quarter-over-quarter reporting should hold the tool, prompt universe, competitors, market, and engine mix constant. A prettier dashboard does not repair a moving denominator.
Five Diagnostic Metrics That Explain the Core Numbers
The current SERP increasingly talks about presence, prominence, perception, sentiment, and recommendation position. Those concepts belong in the measurement stack—but mostly as diagnostics rather than as five more headline KPIs.
| Diagnostic metric | What it reveals | How to use it |
|---|---|---|
| Brand inclusion rate | Whether the brand appears at all, with or without a citation to your domain | Useful when third-party sources are earning the recommendation for you |
| Recommendation position | Whether you are first, early, buried, or absent in a list or comparison | Separates “mentioned somewhere” from being a primary recommendation |
| Representation accuracy | Whether AI engines describe your category, product, audience, capabilities, and positioning correctly | Manual audit against a canonical fact sheet; track error rate by engine |
| Competitor displacement | Prompts where a competitor disappears or falls behind as your brand enters or rises | Good leading indicator on high-intent comparison and shortlist prompts |
| Citation-source mix | Which domains support the answers that mention or recommend you | Shows whether the lever is your site, reviews, media, directories, communities, or documentation |
These diagnostics become especially valuable when a headline score refuses to move. In our interview with Carmen Hughes, the IVRIS editor’s read distilled the early signals into representation accuracy, citation frequency, competitor displacement, and later score movement. That sequence is more useful operationally than treating every change as simultaneous.
First-Party Evidence and Prompt Tracking Answer Different Questions
The most important distinction in the article remains the simplest one: observed first-party evidence and simulated prompt tracking are not two estimates of the same thing.
First-party evidence records events that actually occurred on supported surfaces. Search Console can now report impressions from Google generative AI features. Bing Webmaster Tools reports citations across supported Microsoft AI experiences. Analytics records identifiable sessions. Server logs record requests that reached your infrastructure. A September 2026 industrial example adds the outcome layer: 76% of BlueTuskr’s managed industrial brands had recorded AI-referral revenue, although the exact sample size and attribution method were not disclosed.
Prompt tracking samples what an AI system says when you ask it a controlled set of questions. It is how you observe mention rate, competitor inclusion, answer position, sentiment, or citations that never send a visit. But it is still a sample of a non-deterministic system.
IMPORTANT
Never average a first-party impression count with a simulated visibility score. One records exposure on a defined platform; the other samples generated answers. Report both, but preserve the boundary between them.
What belongs in each layer
| Evidence layer | Good for | Examples |
|---|---|---|
| First-party | Observed exposure, citations, sessions, engagement, conversions | Google Search Console, Bing Webmaster Tools, GA4, server logs |
| Prompt simulation | Presence, brand inclusion, position, competitor share, sentiment, representation | Manual panel, Ahrefs Brand Radar, Semrush, Profound, Peec AI, OtterlyAI |
| Business outcome | Demand and pipeline after exposure | Branded search, direct traffic, assisted conversions, CRM opportunity data |
If you want a vendor-by-vendor comparison of the simulation layer, use our separate guide to AI SEO and GEO platforms. This page is about choosing a defensible measurement model, not ranking software products.
What 692,400 Impressions at Position 3.57—and Seven Clicks Actually Tell Us
Here is the first-party anomaly that made this article worth writing. These are final Google Search Console Web Search Performance numbers, not Generative AI report impressions. The updated window runs from 19 March through 31 August 2026.
| Page | Impressions | Clicks | CTR | Average position |
|---|---|---|---|---|
/first-match-scoring-revenue-bands/ | 514,109 | 1 | 0.0001945% | 3.5134 |
/assign-points-to-revenue-ranges/ | 178,291 | 6 | 0.0033653% | 3.7373 |
| Combined | 692,400 | 7 | 0.001011% | 3.5710 |
Position was not the problem. A combined average position of 3.57 across 692,400 impressions would normally look like outstanding organic visibility. The pages produced seven clicks.
A later manual export of Google’s dedicated Generative AI report adds an important boundary to that finding: the same two URLs recorded 216 verified generative-AI impressions combined in the 19 March–2 September report. So they clearly did appear in AI Overviews or AI Mode, but the official AI-feature count is tiny beside the ordinary Web Search footprint. That is why this article treats fan-out as a mechanism to investigate, not a label to paste onto 692,400 impressions.
The anomaly strengthened after the original article
| Period | Impressions | Clicks | CTR | Average position |
|---|---|---|---|---|
| 19 Mar–11 Aug | 542,762 | 7 | 0.0012897% | 3.5975 |
| 12–31 Aug | 149,638 | 0 | 0% | 3.4751 |
| 19 Mar–31 Aug | 692,400 | 7 | 0.001011% | 3.5710 |
The original version of this article recorded 542,615 impressions through 11 August. Re-running that same window against final GSC API data now returns 542,762, a difference of 147 impressions; the click total remains seven and average position remains about 3.60. This refresh uses the current final API result rather than silently preserving the older extraction.
More important than the 147-impression revision is what happened next. From 12–31 August, the pages generated another 149,638 impressions, held an average position of 3.48, and produced no additional clicks.
The anti-cherry-picking test got stronger
We also re-ran the sitewide comparison using aggregationType=byPage on both sides so the filtered and unfiltered totals are comparable.
| Metric | Full site, byPage | Excluding the two URLs | Difference |
|---|---|---|---|
| Impressions | 1,141,461 | 449,061 | 692,400 |
| Clicks | 1,247 | 1,240 | 7 |
| CTR | 0.109246% | 0.276132% | −0.166886 percentage points |
| Average position | 12.5043 | 26.2784 | −13.7741 positions |
Those two pages account for about 60.7% of the site’s by-page impressions in the period but only 0.6% of its clicks. Remove them and sitewide CTR rises from 0.109% to 0.276%, while the numerical average position worsens from 12.50 to 26.28. In other words, the pages make the site’s visibility metrics look dramatically stronger while contributing almost no click response.
Some queries ranked around position two and still drew no clicks
The query export makes the position point harder to dismiss. These are examples from the exposed GSC rows:
| Query | Impressions | Clicks | Avg. position |
|---|---|---|---|
| first matching condition scoring revenue band example | 6,762 | 0 | 1.99 |
| how to implement first matching condition scoring rules revenue ranges | 6,735 | 0 | 1.99 |
| first matching condition scoring algorithm revenue ranges | 6,694 | 0 | 1.83 |
| how to assign points to revenue ranges business scoring model | 4,186 | 0 | 2.42 |
| mapping revenue bands to points scoring model | 3,874 | 0 | 2.24 |
These are query-dimension rows, so Search Console privacy and aggregation rules still apply. Page-level totals remain the authoritative source for total clicks and impressions. But the rows are enough to reject a simple explanation that the impressions came from weak rankings buried deep in the results.
The pattern was still accelerating at month-end
The daily export from July through August also shows repeated bursts rather than one isolated day. On 30 July the two pages recorded 22,811 impressions and zero clicks. On 30 August they recorded 25,802 and zero. On 31 August alone they recorded 40,994 impressions and zero clicks.
Across just 26–31 August, the two pages generated 101,499 impressions and zero clicks. Whatever underlying presentation or retrieval behavior produced the Web Search pattern, it was still active at the end of the measurement window.
What we can infer—and what we cannot
Google says AI Mode uses a query fan-out technique, dividing a question into subtopics and searching for each one simultaneously across multiple data sources. That makes fan-out relevant when we see dense families of narrow, repetitive search formulations.
Our query rows contain exactly that kind of pattern: many specific variations around first-match scoring, revenue bands, revenue brackets, parsing, mapping, and point assignment. The pattern is consistent with behavior worth investigating around query fan-out. It is not proof that the 692,400 Web Search impressions came from AI Mode or AI Overviews.
That distinction is non-negotiable. The correct statement is not “692,400 AI impressions.” The defensible statement is: Search Console recorded 692,400 ordinary Web Search impressions at an average position of 3.57 and only seven clicks, alongside unusually repetitive and specific query families.
We also queried the ordinary Search Performance Search Appearance dimension for each exact page and received zero rows, so that dimension did not identify the underlying search surface.
The dedicated Generative AI report does provide direct evidence. In our manual export covering 19 March–2 September 2026, /first-match-scoring-revenue-bands/ recorded 167 generative-AI impressions and /assign-points-to-revenue-ranges/ recorded 49, for 216 combined. Google defines these as impressions where links to the site were shown in supported generative AI features on Search—currently AI Overviews and AI Mode.
THE MEASUREMENT LESSON
The 216 verified generative-AI impressions do not turn the 692,400 ordinary Web Search impressions into “AI impressions.” Google’s generative-AI report isolates supported AI-feature visibility within Web Search. The enormous difference between the feature-specific count and the ordinary page-level Web count is itself the useful finding: unusual Web-query behavior can coexist with direct AI visibility without the two being numerically interchangeable.
Two other dimensions are useful as diagnostics, not attribution. In the exposed device rows, the anomaly is overwhelmingly desktop-reported. In the country rows, the United States accounts for by far the largest impression volume. Neither fact identifies an AI system.
The traffic side of the same period
Our analytics over 30 June to 27 July 2026 recorded 1,182 sessions. Identifiable AI-assistant referrals were small but not obviously low quality:
| Source | Sessions | Engagement rate | Avg. engagement time |
|---|---|---|---|
| Direct | 529 | 29.87% | 24s |
| Google organic | 488 | 56.76% | 47s |
| ChatGPT | 28 | 57.14% | 48s |
| Claude | 18 | 38.89% | 44s |
| Gemini | 14 | 57.14% | 1m 27s |
The useful conclusion is not “AI traffic converts” or “AI traffic does not convert.” The sample is too small for either claim. The useful conclusion is that exposure volume and identifiable visits can move on radically different scales, so a visibility report needs both columns.
Query Length Is a Diagnostic Clue, Not an AI Detector
The original article used query length much more aggressively as an AI signal. The updated 501-row export supports a narrower—and more defensible—conclusion: query length and paraphrase density are useful anomaly flags, not attribution rules.
Across every exposed query row returned for the two exact pages from 19 March through 31 August:
| Query length | Exposed queries | Impressions | Clicks |
|---|---|---|---|
| 1–6 words | 104 | 180,308 | 0 |
| 7–19 words | 397 | 511,233 | 3 |
| 20+ words | 0 | 0 | 0 |
That means 79.2% of the exposed queries were 7–19 words long, and they generated 73.9% of the exposed query impressions. The longest returned query was 18 words. So the stronger story is not “hundreds of 100-word prompts.” It is a dense concentration of specific, repeated 7–19-word formulations around the same narrow tasks.
The 501 exposed rows sum to 691,541 impressions, very close to the 692,400 page-level total, but they contain only three of the seven page-level clicks. That mismatch is a reminder that query-dimension reporting is privacy-filtered and can aggregate differently. Use the page totals for the headline numbers; use the query rows to study the pattern.
USE IT AS A FLAG
Longer task-style queries, clusters of near-duplicate paraphrases, extreme impression-to-click ratios, and sudden bursts can identify rows worth investigating. They do not identify the originating AI system. Treat them as anomaly detection, not attribution.
This is where Google’s query fan-out documentation becomes useful context rather than proof. Fan-out gives us a plausible retrieval mechanism to investigate; the dedicated Generative AI Performance report is what can directly tell us whether a page appeared in Google’s supported generative AI features.
What Google and Bing Now Give You for Free
Google Search Console: verified AI-surface impressions, still no clicks
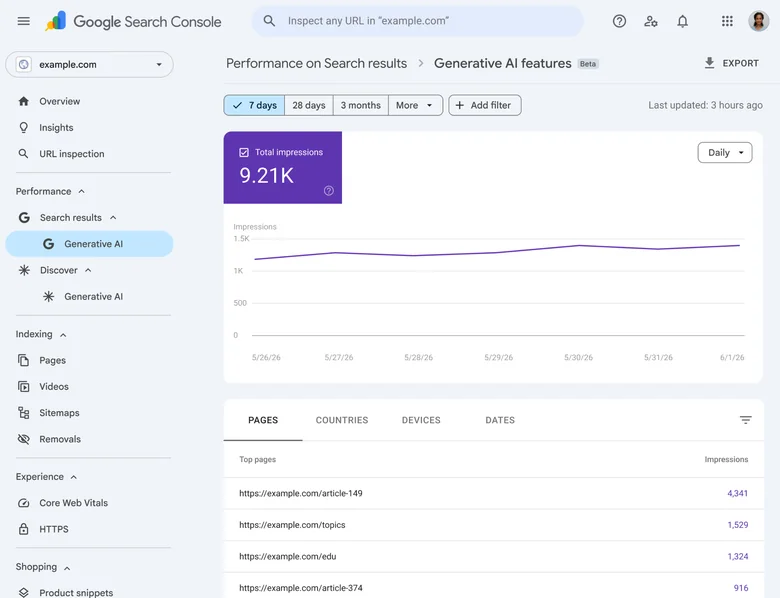
Google’s Generative AI performance report covers impressions from AI Overviews and AI Mode. Google says the report rolled out worldwide on 31 August 2026, subject to properties having enough generative-AI impressions to populate it. Our August 31 Search Console AI rollout analysis separates global availability from the enough-data threshold and documents the accompanying inclusion control.
The report can be grouped by page, country, device, and date. It does not provide click data. That means Search Console can now answer “which pages are being shown in Google’s supported generative AI features?” much better than before, but it still cannot give you a clean AI click-through rate from the same report.
What our own Generative AI report shows
We exported IVRIS Tech’s Search Generative AI Performance report for 19 March–2 September 2026. The two anomalous pages were present, but at a much smaller scale than their ordinary Web Search counts:
| Page | Generative AI impressions | Ordinary Web impressions through 31 Aug |
|---|---|---|
/first-match-scoring-revenue-bands/ | 167 | 514,109 |
/assign-points-to-revenue-ranges/ | 49 | 178,291 |
| Combined | 216 | 692,400 |
This is direct evidence that both pages appeared in Google’s supported generative AI features. It is also direct evidence against casually renaming their entire ordinary Web Search footprint as AI visibility. The feature-specific report sees hundreds of impressions for these URLs, not hundreds of thousands.
The date windows are not perfectly identical—the Generative AI export extends through 2 September while the finalized Web dataset used here ends on 31 August—so this table is a scale comparison, not a subtraction or percentage attribution exercise.
DATA CAVEAT
Google records a known logging error for the Generative AI Search report from 13–17 August 2026 that reduced reported impressions. If your analysis crosses those dates, flag the dip rather than treating it as a real visibility loss.
Bing Webmaster Tools: citations and grounding queries
Microsoft’s AI Performance report in Bing Webmaster Tools provides a different first-party view. It reports total citations, average cited pages, page-level citation activity, visibility trends, and sampled grounding queries used when retrieving cited content.
That grounding-query field is particularly useful because it exposes how a supported AI experience retrieved your page. It is still a sample of Microsoft-supported AI activity—not a census of ChatGPT, Gemini, Claude, and every other engine—but it gives page owners a first-party signal that most commercial dashboards can only simulate elsewhere.
The Carmen Hughes Lesson: Run a Page Clock and a Brand Clock
Measurement becomes more useful when it tells you when a metric should move, not just what the metric is.
In our written interview with Carmen Hughes of Ignite X, she separates two timelines:
- Page clock: how quickly an individual page, profile, article, directory listing, or third-party placement begins appearing as a citation or retrieval source.
- Brand clock: how long it takes AI systems to change the aggregate way they describe or recommend the company across many prompts and sources.
“A new page that cites the brand is a leading indicator. AI engines treating that brand as a category authority is the outcome.”
That distinction gives B2B teams a better way to read early movement. If citations rise in week three but brand share of voice or recommendation position does not, that is not automatically failure. If representation accuracy improves first, that can be an upstream win even while the headline score remains flat.
In the anonymized engagement Carmen described, the brand’s overall score moved from 11/30 to 19/30 over 90 days. But smaller proof points appeared earlier: representation accuracy improved, citation frequency rose, and competitor displacement appeared before the tier crossing. Her point was not that every company should expect the same score movement. It was that a team watching only the lagging score would miss the signals that the operating work had started to land.
A practical 90-day reporting sequence
| Window | Watch first | What not to overclaim |
|---|---|---|
| Weeks 1–4 | Representation accuracy, cited pages, citation frequency, retrieval/grounding queries | Do not call one new citation “category authority” |
| Weeks 4–8 | Brand inclusion, recommendation position, competitor displacement, citation-source mix | Do not assume every model or market will move together |
| Weeks 8–12+ | AI SOV trend, branded demand, assisted conversions, opportunities, broader brand treatment | Do not attribute all delayed demand to AI without a model and stated assumptions |
Which AI Visibility Tools Are Actually Useful?
No single tool answers every question. The better approach is to choose a collector for each evidence job and keep the definitions visible in the report.
| Tool | Best use in this framework | Useful signals | Caveat |
|---|---|---|---|
| Google Search Console | First-party Google AI exposure | AI Overviews + AI Mode impressions by page, country, device, date | No click metric in the Generative AI report |
| Bing Webmaster Tools | First-party Microsoft AI citation evidence | Total citations, cited pages, page activity, sampled grounding queries | Covers supported Microsoft experiences, not the whole AI market |
| Ahrefs Brand Radar | Large-scale discovery and benchmarking | Mentions, citations, modeled impressions, AI SOV, cited pages, custom prompts | Its impression/SOV layer models potential visibility rather than actual audience reach |
| Semrush AI Visibility Toolkit | Teams that want AI monitoring beside an existing SEO workflow | Mentions, cited pages, citations, visibility benchmarks, custom prompt tracking | Its score and datasets are Semrush-specific; do not blend them with another provider’s score |
| Profound | Deep enterprise prompt and answer-engine analysis | Visibility, citations, sentiment, share of voice, positioning | Prompt-driven dataset; useful for trends, not a first-party census of buyers |
| Peec AI | Simple recurring brand/competitor monitoring | Visibility, average position, sentiment, share of voice, source analysis | Track the same engines and prompt set if you want period comparisons |
| OtterlyAI | Daily prompt monitoring and citation investigation | Brand coverage, SOV, rank, sentiment, cited URLs, competitor gaps | Brand coverage and SOV are separate metrics; preserve that distinction in reporting |
The official product documentation illustrates why “AI visibility score” should never be treated as a universal unit. Ahrefs, Semrush, Profound, Peec AI, and OtterlyAI all expose overlapping concepts with different collection methods and definitions.
TOOL SELECTION RULE
Choose the tool whose dataset matches the decision. Use first-party platforms for observed exposure and citations. Use a prompt tracker for controlled brand/competitor comparisons. Use analytics and CRM for outcomes. Do not ask one vendor score to stand in for all three.
How to Build a Repeatable B2B AI Visibility Baseline
A baseline should be boring enough to repeat. The goal is not to discover the perfect score; it is to create a measurement system whose movement you can interpret.
Workflow · 2 hours
Build an AI search visibility baseline you can rerun every month
Record first-party Google AI impressions
Export the Generative AI report for the same monthly date window. Record total impressions and the pages receiving them.
Record Bing citation evidence
Capture total citations, cited URLs, and grounding-query samples. Keep Bing separate from Google rather than creating a blended first-party score.
Create an AI-referral segment in analytics
Track sessions, engagement, conversions, and revenue where an AI referrer is identifiable. State your unattributed/direct share as an error bar.
Freeze a 30–50 prompt panel
Use buyer questions, not variations of your brand name. Keep wording, market, engine, and competitor set unchanged during the measurement period.
Calculate the four core measures
Track citation frequency, AI SOV, AI-referred traffic, and the visibility-to-visit gap as separate lines.
Annotate the diagnostics
Score brand inclusion, recommendation position, representation accuracy, competitor displacement, and citation-source mix so you can explain movement.
Separate page-clock wins from brand-clock movement
Mark newly cited pages and corrected descriptions as leading indicators. Reserve stronger claims for sustained movement across many prompts and business outcomes.
Build the prompt panel around buying decisions
A 50-prompt panel should not be 50 ways to ask “what is [your brand]?” A useful B2B panel samples the questions that create or remove a vendor from consideration.
| Prompt group | Example pattern | Why it matters |
|---|---|---|
| Category discovery | “Best platforms for [job] for a mid-market B2B team” | Measures whether you enter the initial consideration set |
| Problem/solution | “How should a B2B team solve [specific pain]?” | Tests whether the brand appears before the buyer names a product category |
| Comparison | “[Competitor A] vs [Competitor B] alternatives for [use case]” | Reveals competitor displacement and recommendation position |
| Requirements | “Which tools support [integration/security/workflow requirement]?” | Tests factual representation and product-fit claims |
| Risk and proof | “Which [category] vendors are credible for [regulated/high-stakes use case]?” | Surfaces third-party citation sources and trust signals |
Run each prompt on the same engines and schedule. If you change the prompt set because your results are bad, you did not improve visibility—you changed the exam. BrandRadar’s matched 50-prompt UAE test reinforces the control: the same Toyota and Sukoon prompt sets produced materially different citation-source patterns across ChatGPT and Google AI Mode. BrandRadar’s matched 50-prompt UAE test reinforces the control: the same Toyota and Sukoon prompt sets produced materially different citation-source patterns across ChatGPT and Google AI Mode.
What to Put in the Monthly AI Visibility Report
The executive version can fit on one page if the team stops trying to summarize every dashboard card.
| Report line | This month | Previous | Interpretation to add |
|---|---|---|---|
| Google generative-AI impressions | — | — | Which pages gained or lost verified Google AI exposure? |
| Bing citations / cited pages | — | — | Which pages and grounding topics changed? |
| Prompt-panel citation rate | — | — | Did our domain become a source more often? |
| Prompt-panel AI SOV | — | — | Which competitor gained or lost share? |
| Brand inclusion / average position | — | — | Are we merely present, or being recommended early? |
| Representation accuracy | — | — | Which factual errors disappeared or appeared? |
| AI-referred sessions / conversions | — | — | What identifiable demand reached the site? |
| Branded demand / assisted pipeline | — | — | Direction only unless attribution method is explicit |
Add one final narrative line: what changed first? If citations rose but business outcomes did not, say so. If representation improved while the score stayed flat, say so. If traffic rose with no improvement in prompt visibility, investigate whether the visits came from a different AI use case.
What You Still Cannot Measure Cleanly
Honest AI visibility reporting is partly a list of known blind spots.
You cannot reconstruct every AI answer seen by every buyer. Commercial prompt trackers sample controlled queries. Actual users have different wording, context, personalization, geography, and account history.
Google’s Generative AI report does not give you clicks. It verifies supported AI-surface impressions, but the absence of a click field prevents a like-for-like AI CTR inside that report.
You cannot treat all “share of voice” values as portable. Different tools use different prompt universes, weighting, brand matching, and denominators.
You cannot infer the originating AI system from a strange Web-report query. Long queries and fan-out patterns are useful anomaly flags, not attribution.
You cannot see every no-click citation in first-party analytics. If an AI assistant names your company and the buyer never visits, your site has no event to record.
You cannot cleanly attribute delayed influence. A buyer may see the brand in an AI answer, return through direct or branded search days later, then convert after several other touches. Any “AI-influenced pipeline” model needs its assumptions published beside the number.
Those limits are not an argument against measurement. They are the reason the measurement model needs multiple independent lines. Once the report shows a real visibility problem, the work shifts upstream to the content structures and evidence that make pages easier to extract and cite. If you are evaluating outside help, ask an AEO agency or an SEO and LLM visibility agency to show exactly which of these layers it measures before you accept a single score in a proposal.
Frequently Asked Questions
Use first-party platform data and a fixed prompt panel together. Track Google generative-AI impressions, Bing citations, AI referral traffic, citation rate, share of voice, brand inclusion, position, accuracy, and competitor movement. Keep the evidence sources separate rather than blending them into one universal visibility score.
For executive reporting, keep four core lines: citation frequency, AI share of voice, AI-referred traffic, and the gap between exposure and identifiable visits. Use brand inclusion, recommendation position, representation accuracy, competitor displacement, and citation-source mix as diagnostic metrics that explain changes in the core numbers.
Start with Google Search Console and Bing Webmaster Tools for free first-party evidence. For controlled prompt and competitor tracking, Ahrefs Brand Radar, Semrush AI Visibility Toolkit, Profound, Peec AI, and OtterlyAI are useful options. Choose by measurement job because their datasets and metric definitions are not interchangeable.
For an internal fixed prompt panel, divide your brand mentions by total mentions of your brand plus the competitors you track. Vendor formulas can differ: some count mentions while others weight modeled impressions. Keep the provider, prompt universe, competitor set, engines, and market unchanged when comparing periods.
Search Console’s Generative AI performance report shows impressions from AI Overviews and AI Mode and can break them down by page, country, device, and date. It does not currently provide click data, so the report cannot produce a clean AI click-through rate by itself.
No. Longer task-style queries, duplicate paraphrases, fan-out-like patterns, and unusual impression-to-click ratios can flag rows worth investigating, but they do not identify the originating system. In our own case, the dedicated Generative AI report separately confirms 216 impressions across the two pages; that direct feature-specific count is the evidence for AI-surface visibility, not the query length itself.
Use at least several repeated runs on an unchanged prompt set and interpret early page-level movement separately from broader brand change. New citations and corrected representation can appear before share of voice, recommendation patterns, branded demand, or pipeline move, so do not judge the entire program from one snapshot.