
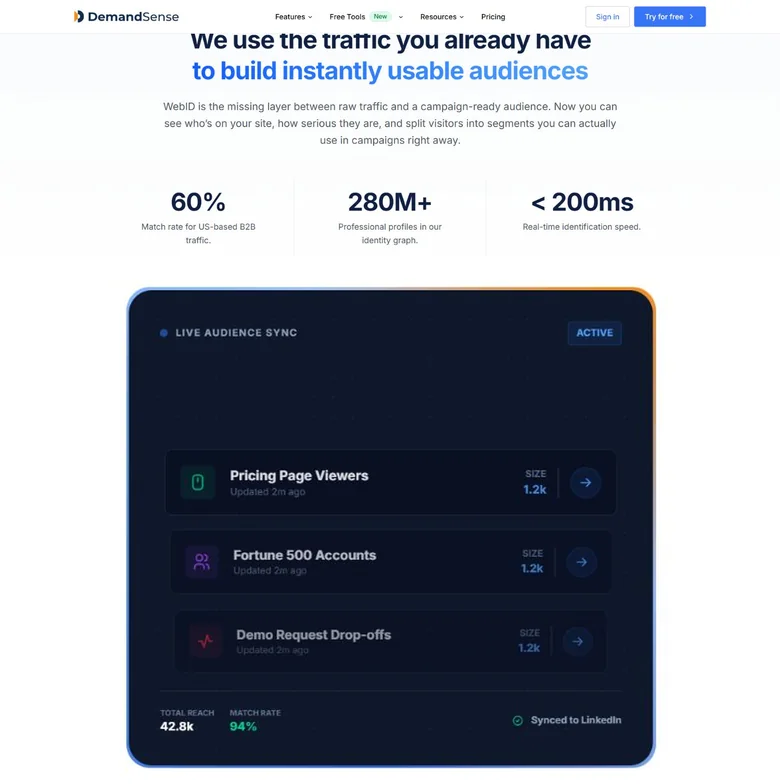
Open DemandSense’s visitor identification page and you will find two numbers labelled match rate. One says 60%, captioned “Match rate for US-based B2B traffic.” The other says 94%, sitting inside a LinkedIn audience-sync panel with no caption at all. Both were on the page when we checked it on 12 August 2026. Neither carries a denominator.
That is not a scandal. It is the normal condition of this category. A visitor identification match rate is the most quoted number in the buying process and the least standardised, and the gap between what vendors advertise and what buyers measure has a mechanical explanation that almost nobody publishes. This page traces where the circulating numbers actually come from, shows the arithmetic that turns one month of one site into four defensible answers, and grades twelve vendors on what they disclose about how their number was produced.
Direct answer — What is a good visitor identification match rate?
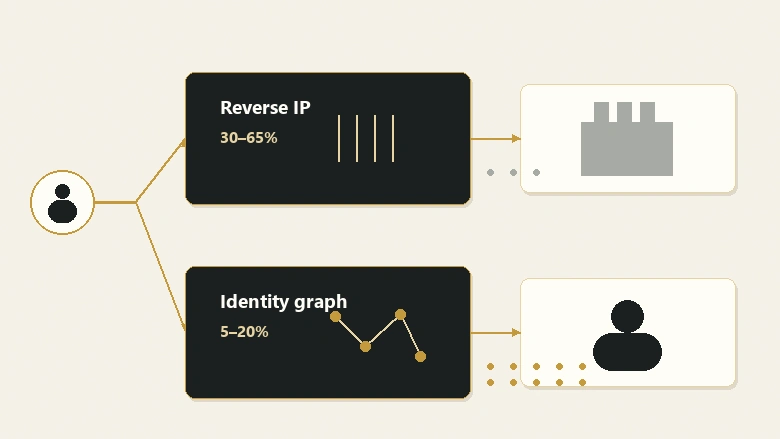
A visitor identification match rate is the share of website traffic a vendor resolves to a known company or person. On US B2B traffic, company-level resolution realistically lands between 30% and 65%; person-level lands between 5% and 20%. No published rate is comparable to another unless the vendor states the population it was measured against and the confidence threshold above which a guess counts as a match. Rates above 70% usually blend the two tiers or shrink the denominator.
Key Takeaways
- Company-level and person-level identification are separate measurements. Adding them together double-counts, because a resolved person almost always resolves a company too.
- Bots were more than 53% of web traffic in 2025, so whether the denominator includes them roughly doubles or halves the answer before any vendor skill is involved.
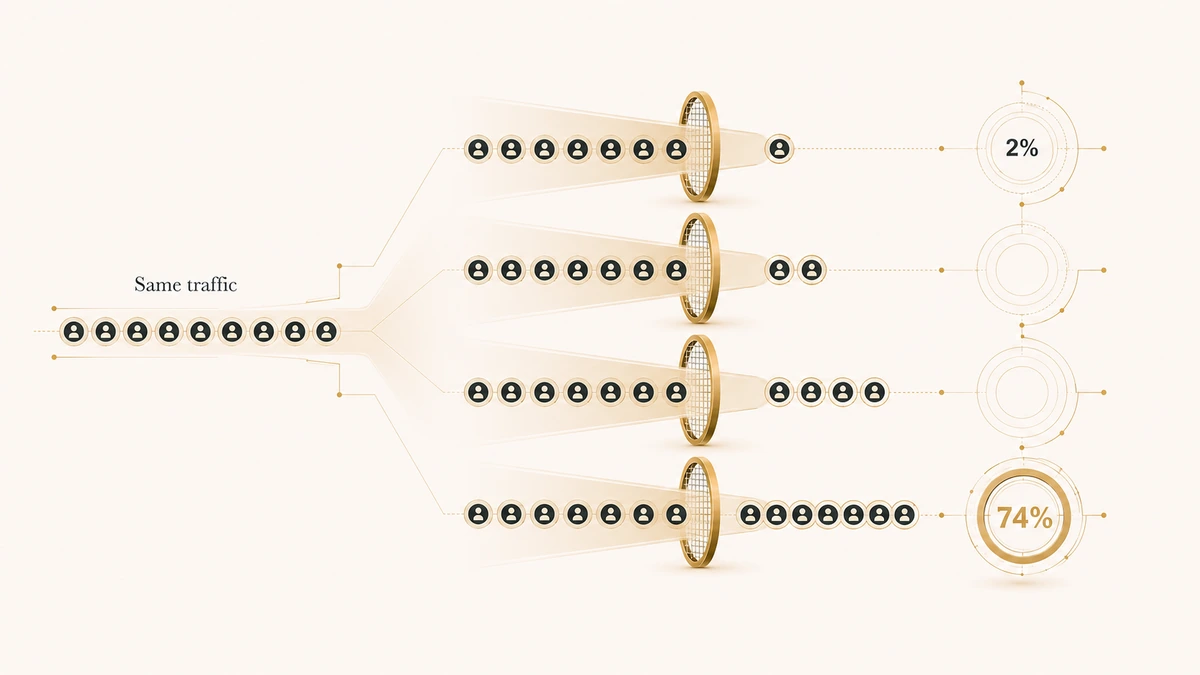
- The same month of the same site honestly produces anything from 2% to 74%, depending only on which denominator you pick.
- Two vendors in this category have publicly said the number should not decide a purchase. One of them declines to publish a percentage at all.
- Six disclosures make a match rate checkable: tier separation, denominator, confidence threshold, accuracy, measurement date, and a test you can run yourself.
What a visitor identification match rate measures
A visitor identification match rate is the percentage of your website traffic that a tool resolves to a known identity. The arithmetic is simple enough that Leadpipe’s glossary states it in one line: if 10,000 people visit your site in a month and the tool identifies 3,000 of them, the match rate is 30%.
Every argument in this article lives in the two words that definition leaves undefined. “People” is a denominator choice. “Identifies” is a numerator choice. Change either and the percentage moves by more than any vendor’s technology does.
Match rate = Resolved units ÷ Population unitsCompany-level and person-level are two different measurements
Company-level identification uses reverse-IP resolution: the visitor’s network address is looked up against a map of which businesses own or route which addresses. Person-level identification uses an identity graph, a database that links browsing signals to named individuals. They fail for different reasons, they cost different amounts, and they resolve wildly different shares of the same traffic.
| Tier | What it resolves | Method | Honest published band (US B2B) | What it cannot do |
|---|---|---|---|---|
| Company-level | The organisation the visitor works for | Reverse-IP resolution | 30% to 65% | Name a person, or survive residential and mobile networks |
| Person-level | A named individual, usually with an email | Identity graph | 5% to 20% | Work at scale outside the US, or without consent in the EU |
| Blended | Nothing, as a measurement | Addition | Not a real band | Be checked, because the two sets overlap |
The blended row is the one that matters commercially. Visitor identification sits upstream of the tools most teams already own, which is why it keeps getting compared against categories it does not belong to; we mapped that boundary in our guide to where demand-gen and lead-gen stacks overlap. A blended number is the easiest way to make an upstream product look like it does more than it does.
The numbers in circulation, and who published them
Before judging any vendor’s claim, it is worth asking where the industry band itself came from. We traced every figure that appears in the top ten results for this keyword back to whoever first published it.
Where each published number actually comes from
| Figure | Published by | Measured against what | Dated |
|---|---|---|---|
| 30% to 65% company, 5% to 20% person | Warmly | Its own production data, described only as 9M+ monthly visits across 1,600+ organisations | Mar 2026 |
| 40% to 70% company, 15% to 35% person | Leadpipe | “Most tools” and “the best tools”, population unstated | No |
| 77%+ company reveal | Unify GTM | Its own customer base, aggregated; labelled as such | Apr 2025 |
| 92% accuracy, not a match rate | Demandbase | Global account identification accuracy | May 2025 |
| 70% to 80% resolution | RB2B | Unstated; tier not specified | No |
| 60% and 94%, both on one page | DemandSense | Unstated; one captioned US B2B traffic, one uncaptioned | No |
| “Up to 45%” | Leadfeeder marketing | Unstated | No |
| 1.7X higher, “#1 in the EU” | Albacross | Relative to an unnamed baseline | No |
The band is a consensus, not a measurement
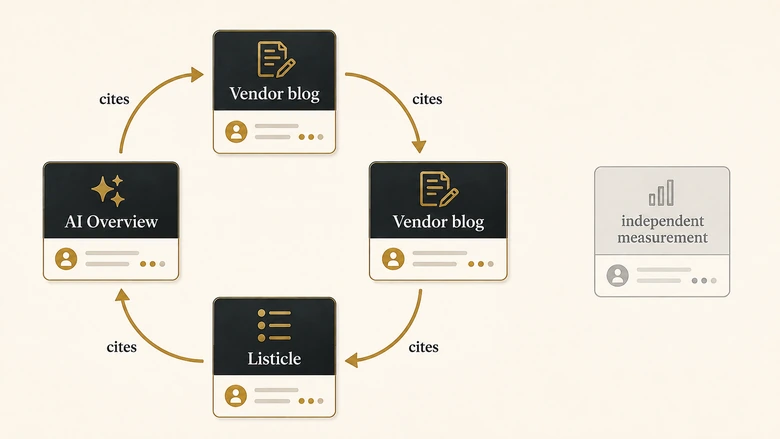
Follow the citations and they close into a loop. Unify GTM’s guide, which is the most methodologically careful page on the SERP, sources its industry band to MarketBetter, Leadpipe and Warmly. Warmly sources its band to its own production data. Leadpipe attributes its band to “most tools” without naming a population. Google’s AI Overview for this keyword then cites Warmly, Unify and MarketBetter as its authorities, which returns the reader to where they started.
Not one figure in the circulating band rests on a measurement taken outside the category it describes.
That is worth stating plainly, because “30% to 65%” is repeated with the confidence of a benchmark. It is not one. It is a range that vendors quote to each other, and the reason it survives is that it is roughly right, not that anyone has audited it. Our view is that this makes it usable as a sanity check and useless as a purchase criterion.
The AI Overview narrows what its own sources said
There is one more step in the chain, and it moves the numbers again. Google’s AI Overview for this keyword, captured on 12 August 2026, publishes a tier called “Realistic Benchmarks” giving 40% to 60% for company-level US B2B traffic and 10% to 20% for person-level. It names Warmly among its sources.
Warmly published 30% to 65% and 5% to 20%. So the summary has trimmed ten points off the bottom of the company range and five off the top, and doubled the floor of the person range, without any of its cited sources reporting the tighter figures. Every edit runs in the same direction: toward a narrower, more confident band than the underlying evidence supports.
This matters for a practical reason. A buyer who reads only the summary now sees 40% as the floor for company-level resolution. A vendor honestly reporting 35% looks below benchmark, when 35% sits comfortably inside the range the summary’s own source published. The band gained confidence at each hop and never gained a measurement.
Five incompatible definitions of a match rate
The clearest statement of this problem was published by a vendor, not a critic. In May 2025, Russell Martin, then Demandbase’s Director of Product Marketing, wrote up what he had learned from more than fifty account-identification bakeoffs and listed five things a vendor might mean by “match rate”:
- The share of traffic matched to a business, after bots are removed
- The share of traffic matched to a business, before bots are removed
- The share of traffic matched to businesses, consumers and bots together
- The share of business traffic scoring above an 80% confidence threshold
- The share of business traffic scoring above a 50% confidence threshold
His conclusion was that a bakeoff between two vendors using different definitions “would not be an apples-to-apples comparison” even with the same tag on the same pages over the same window. He recommended buyers not put much weight on a vendor’s match rate at all.
Bots are now the majority of the denominator
Definitions one and two look like a technicality. They are not. Imperva’s 2026 Bad Bot Report, published in April 2026, found that automated traffic accounted for more than 53% of all web traffic in 2025, up from 51% the year before, leaving human activity at just 47%.
So the choice between “before bots” and “after bots” is not a rounding difference. It is a choice about roughly half the denominator, and it moves the reported rate by about a factor of two before any vendor’s technology is involved. A vendor quoting a post-bot-filter rate and a vendor quoting a pre-filter rate are not close. They are answering different questions.
The confidence threshold is a lever, not a constant
Definitions four and five are the more uncomfortable pair. Many identity products attach a confidence score to each resolution and let the vendor decide which scores count. Martin’s point was that this makes the headline number adjustable at will: a vendor can appear to have the highest match rate by tweaking the definition, and one using a customer-facing confidence score can move the lever whenever it suits a competitive comparison.
Demandbase’s own answer is to publish accuracy instead. It reports a 92% global accuracy rate, meaning it identifies the correct account 92% of the time, on the stated principle that a wrong identification is worse than none. Whether or not you accept that trade, it is the only figure in the category that names what it is measuring.
IMPORTANT
Accuracy and match rate move in opposite directions. Lowering the confidence threshold raises the match rate and lowers accuracy at the same time. A vendor reporting only one of the two has told you almost nothing.
How an honest 40% becomes an advertised 80%
None of this requires anyone to lie. Take one site, one month, and one vendor performing exactly as well in every scenario, then vary only the denominator.
One site, one month, four defensible answers
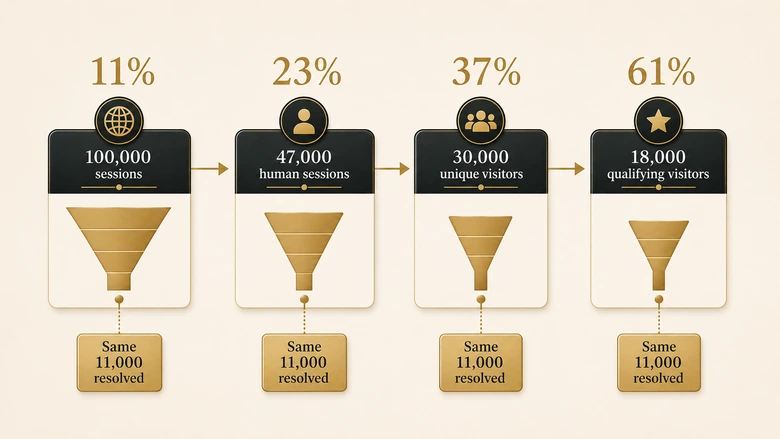
Assume 100,000 monthly sessions. Strip bots at Imperva’s 53% and 47,000 human sessions remain. Those collapse to 30,000 unique visitors, of which 18,000 are US business traffic. The tool resolves 11,000 visitors to a company and 2,400 to a named person.
| Denominator chosen | Company-level | Person-level | Blended, as some vendors present it |
|---|---|---|---|
| All 100,000 sessions | 11% | 2% | 13% |
| 47,000 human sessions | 23% | 5% | 29% |
| 30,000 unique visitors | 37% | 8% | 45% |
| 18,000 qualifying US B2B visitors | 61% | 13% | 74% |
Every cell in that table is arithmetically correct and describes identical performance. The spread runs from 2% to 74%. A vendor quoting 61% and a buyer measuring 37% are both right, and neither will work out why they disagree unless someone names the denominator.
The blended column deserves its own warning. Person-level matches are usually a subset of company-level ones, so adding the two counts most resolved visitors twice. That column is not a stricter measurement of the same thing. It is a category error that happens to produce the largest number on the page.
The five moves that inflate a match rate
- Blend the tiers. Report company and person resolution as one number. Cheapest available lift, and the hardest to detect from outside.
- Shrink the denominator. Move from all sessions to “qualifying B2B traffic”. Legitimate when disclosed, decisive when not.
- Count sessions, not visitors. A resolved visitor who returns four times can be counted four times in the numerator.
- Quote demo traffic. Warmly’s own analysis puts demo match rates at three to five times production, because demo environments are seeded with clean, resolvable traffic.
- Quote a customer aggregate as a product spec. A rate averaged across a vendor’s whole customer base describes their traffic mix, not yours.
Unify GTM is a useful case because it does the fifth thing while explicitly labelling it. It publishes a 77%+ company-level reveal rate, then states in the same breath that this is a customer-base aggregate rather than a person-level claim, and that individual results vary by traffic mix. That is the disclosure working as intended: the number is high, and the reader can tell exactly why.
PRO TIP
On a vendor call, ask one question before any others: “Is that company-level or person-level, and what is the denominator?” A rep who answers both parts without checking is worth continuing with. A rep who reaches for a blended figure has answered you anyway.
What moves your match rate, and what you cannot fix
Once the definitions are settled, most of the remaining variance belongs to your traffic rather than to the vendor. This is the part buyers underestimate, and it is why two companies running the identical tool report rates twenty points apart.
Traffic source changes the answer more than the vendor does
Warmly publishes the most detailed public breakdown here, drawn from its own production data. Email campaign traffic resolves at 70% to 85% company-level; organic search sits at 50% to 65%; direct traffic at 40% to 55%; organic social at 35% to 50%. The pattern holds across the category because it is about who is clicking and from where, not about whose graph is bigger.
| Factor | Direction | Can you change it? |
|---|---|---|
| Email and paid-social traffic | Raises company-level resolution sharply | Yes, by shifting channel mix |
| EU and UK traffic without consent | Collapses both tiers | No, and you should not try |
| Mobile, VPN and residential networks | Defeats reverse-IP resolution | No |
| Remote and hybrid workers | Moves business traffic onto consumer networks | No |
| Small companies with thin digital footprints | Lowers resolution and accuracy together | No, and it is worse for SMB-focused sellers |
| Bot and ad-blocker traffic | Inflates or deflates depending on filtering | Partly, through your own analytics filters |
What no vendor can fix for you
Martin’s fourth problem is the one buyers walk into most often. The obvious way to test accuracy is to compare a vendor’s output against your own CRM records, and that comparison is biased in a direction few people notice: your first-party data skews toward established companies with large digital footprints, which are exactly the accounts every vendor resolves easily. You end up testing the easy half of the population and never testing the accounts the vendors actually differ on.
The honest limit is this. If you sell to enterprises in the US through email and paid channels, the upper half of the published band is achievable. If you sell to small companies, in Europe, or to a mobile-heavy audience, the lower half is your ceiling regardless of vendor, and no procurement pressure will move it. Deciding what to do with the visitors you do resolve is a separate discipline, and how fast you act on a resolved visitor matters more to pipeline than the last five points of match rate ever will.
The match-rate disclosure scorecard
Since the numbers are not comparable, the useful question changes. Not “whose match rate is highest”, which is unanswerable, but “who tells you enough to check”. That is a question with a public, verifiable answer, and it is what this scorecard measures.
What a credible match-rate claim contains
- Tier separation. Company-level and person-level published as two numbers, never one.
- The denominator. Which population: all sessions, unique visitors, bot-filtered traffic, which regions.
- The confidence threshold. The score above which a result counts, and whether the buyer can see or change it.
- Accuracy, separately. How often a match is correct, and how that was verified.
- The date and window. A match rate decays as networks and graphs change; an undated one is unreadable.
- A test you can run. A trial measured against the buyer’s own analytics rather than the vendor’s dashboard.
How we graded these vendors
Each criterion is weighted, and each cell is Y where the disclosure is published and specific, P where it is published but qualified or missing its population, and NV where we did not find it on the pages we checked between 8 and 12 August 2026.
Disclosure score % = Σ(criterion weight × factor), where Y = 1.0, P = 0.5, NV = 0Weights: tier separation 25, denominator 25, confidence threshold 20, accuracy 15, date 10, buyer-runnable test 5.
The scorecard
| Vendor | Headline figure published | Tier 25 | Denominator 25 | Threshold 20 | Accuracy 15 | Date 10 | Test 5 | Score |
|---|---|---|---|---|---|---|---|---|
| Unify GTM | 77%+ company reveal, labelled as a customer aggregate | Y | Y | NV | P | Y | Y | 72.5% |
| Leadpipe | 30-40%+ deterministic person-level, US B2B | Y | Y | P | P | NV | NV | 67.5% |
| Demandbase | 92% accuracy; declines to headline a match rate | P | NV | P | Y | Y | Y | 52.5% |
| Warmly | 30-65% company, 5-20% person | Y | P | NV | NV | Y | P | 50% |
| Dealfront / Leadfeeder | Help centre declines to give a percentage | NV | P | NV | NV | NV | P | 15% |
| DemandSense | 60% US B2B traffic, and 94% uncaptioned | NV | P | NV | NV | NV | NV | 12.5% |
| RB2B | 70-80% resolution, tier unspecified | NV | NV | NV | NV | NV | P | 2.5% |
| Albacross | 1.7X higher than “most intent platforms” | NV | NV | NV | NV | NV | P | 2.5% |
| Vector | None published; 45% appears in a dashboard mockup | NV | NV | NV | NV | NV | P | 2.5% |
| Factors.ai | None published on the pages checked | NV | NV | NV | NV | NV | P | 2.5% |
| Snitcher | None published; testimonial claim only | NV | NV | NV | NV | NV | NV | 0% |
| Visual Visitor | None on the product page checked; SERP article 404s | NV | NV | NV | NV | NV | P | 2.5% |
The distribution is the finding. Two vendors clear 65%. Eight score under 20%. Not one of the twelve publishes all six disclosures, and the most common pattern by far is a headline percentage attached to none of them.
Two results are worth reading closely rather than ranking. Dealfront’s low score comes from a position, not an omission: its help centre states that as each customer is different there is no way to honestly give a percentage of visitors identified, and that a service promising a certain percentage rate is likely basing it on a few accounts. That is the most defensible thing any vendor says about match rates, and our rubric scores it near the bottom because the rubric measures disclosure of a number, not honesty about refusing to give one. Demandbase reaches the same conclusion from the other direction by publishing accuracy instead of resolution.
What we did not do
We installed no tags, bought no seats and measured no vendor’s match rate. IVRIS has tested nothing here and publishes no star rating for any of these products. This scorecard grades what each company chooses to say in public about how its number was produced, which anyone can check with a browser, and it says nothing at all about which product resolves more of your traffic.
IMPORTANT
A high score is not a recommendation and a low one is not a warning. Read the row, not the number. Several vendors here score low because they publish no figure at all, which is a marketing choice rather than a performance signal.
A note on scope, because the method here is deliberately borrowed. Our disclosure grading of enrichment vendors applies the same test to a different population: that page grades what enrichment tools disclose about filling a CRM record, this one grades what identification tools disclose about resolving anonymous traffic. The two measurements should never be averaged, and neither should the two scorecards. That article is written and scheduled but not yet live, so the link resolves once it publishes.
Measure your own match rate on your own traffic
Everything above describes what vendors publish. This describes your traffic, and it is the only number that should decide a purchase. The method matters less than the discipline of holding the denominator fixed, and it is notable that the two people best placed to argue otherwise both recommend the same thing: Demandbase advises running any comparison inside Google Analytics, and Unify GTM tells buyers to measure identified visits against their own analytics totals rather than the vendor’s chosen denominator.
Workflow · 2 hours hands-on over 14 days
How to measure your own visitor identification match rate
Produces two dated match rates with a denominator you chose, measured on your traffic, comparable across vendors.
Fix your denominator first
In GA4, PostHog or Plausible, pull unique users for a 14-day window with internal traffic and known bots excluded. Write the number down before any vendor sees your site. This is the only denominator you will use.
Run every vendor on the same days
Install all trial tags at once and run them across the identical 14-day window. Sequential trials measure different traffic and cannot be compared.
Export company and person resolutions separately
Pull two deduplicated lists per vendor: unique companies resolved, and unique people resolved. Never accept a single combined figure from a dashboard.
Divide both by your own denominator
Compute company-level and person-level rates against the step-one number, not against whatever total the vendor dashboard displays. Expect both to land below the vendor’s published figure.
Verify a 50-row accuracy sample
Draw 50 resolutions at random, not your best-known accounts, and check each against LinkedIn or your CRM. Accuracy is correct matches divided by matches returned, and it is a different number from match rate.
Break the result down by traffic source
Split both rates by channel and by region. A single blended figure hides the exact segment that will disappoint you after the contract is signed.
Which rate should decide your purchase
Use company-level resolution when the next action is account-based: routing an alert to an owner, adding an account to a target list, triggering an ad audience. Use person-level resolution when the next action names a human, and only where you have a lawful basis for it. Never accept a blended number, in either direction, because the two sets overlap and the sum is not a measurement of anything.
Two more rules follow from the arithmetic. Avoid buying on match rate alone when your traffic is mostly mobile, European, or SMB, because in those conditions the vendor you pick explains less of the outcome than the traffic you have; run the pilot anyway, but weight integration quality and accuracy above resolution volume. And avoid comparing a vendor’s published figure against your measured one at all. They are answers to different questions, and the only comparison that means anything is two vendors measured against the same denominator on the same fourteen days.
When the pilot comes in low
If the pilot lands well below the published band, the useful next question is which segment is dragging it down rather than which vendor to swap in. A rate of 22% that is 55% on email traffic and 6% on organic mobile is not a vendor problem. It is a channel-mix fact, and it will follow you to the next contract.
One caution about what a resolved visitor is worth. Identification tells you a company was on your site; it does not tell you they are in a buying cycle, and treating it as though it does is how teams end up with a busy alert feed and a flat pipeline. That distinction is the same one that separates a signal from scored intent data and its provenance types, and it applies here with more force, because a reverse-IP hit is the weakest signal in the set. Where the resolved identity gets written and how it is reconciled with everything else you know about the account belongs to your first-party data operating model, not to the vendor’s dashboard.
Methodology, sources and revision history
SERP captured 12 August 2026 for the keyword “visitor identification match rate”, US, signed out. Vendor pages checked between 8 and 12 August 2026; each URL and finding is recorded in the downloadable scorecard’s Sources sheet, including pages that returned errors. The Demandbase post is verified via a rendered browser session because the domain refuses automated fetches; Visual Visitor’s match-rate article, which ranks in the top ten for this keyword, returned a 404 when we tried to read it, and is recorded as unreachable rather than scored as absent.
Limitations. A Y grades disclosure, not truth: a vendor that publishes a denominator may still have chosen a flattering one. Scores describe the pages we checked on the dates above and nothing else, and a vendor that publishes better information tomorrow is scored wrongly today. The arithmetic worked example uses illustrative traffic volumes chosen to show the mechanism; it is not a measurement of any real site.
Update triggers: any vendor publishing a denominator or confidence threshold, a change in the AI Overview citation set, a new Imperva bot-traffic figure, or 60 days, whichever comes first. Corrections are logged here rather than negotiated. Suggested citation: IVRIS Tech, “Visitor Identification Match Rates”, ivristech.com, August 2026.
Frequently Asked Questions
On US B2B traffic, 30% to 65% at company level and 5% to 20% at person level are the realistic bands. Anything higher usually reflects a narrower denominator or a blend of both tiers rather than better technology. Judge the disclosure before judging the number.
Usually because they measure against qualifying business traffic rather than all sessions, combine company-level and person-level resolutions into one figure, or quote a demo environment. Each move is arguable on its own. Stacked together they turn a genuine 37% into a defensible 80%.
Naming an individual visitor is personal data processing and needs a lawful basis, which in practice means consent for EU and UK traffic. Company-level reverse-IP resolution is treated more permissively. Expect person-level rates near zero on EU traffic without a consent flow, and take legal advice rather than a vendor’s word.
Demo environments run on curated traffic. Warmly’s own analysis puts demo match rates at three to five times production levels. Your traffic mix, the share of mobile and remote visitors, and your regional split all pull the live number down, and none of that is the vendor underperforming.
No, and the two often move in opposite directions. Lowering the confidence threshold resolves more visitors and gets more of them wrong. A 50% match rate at 90% accuracy beats an 80% match rate where half the matches are incorrect, so ask for both numbers or neither is useful.





