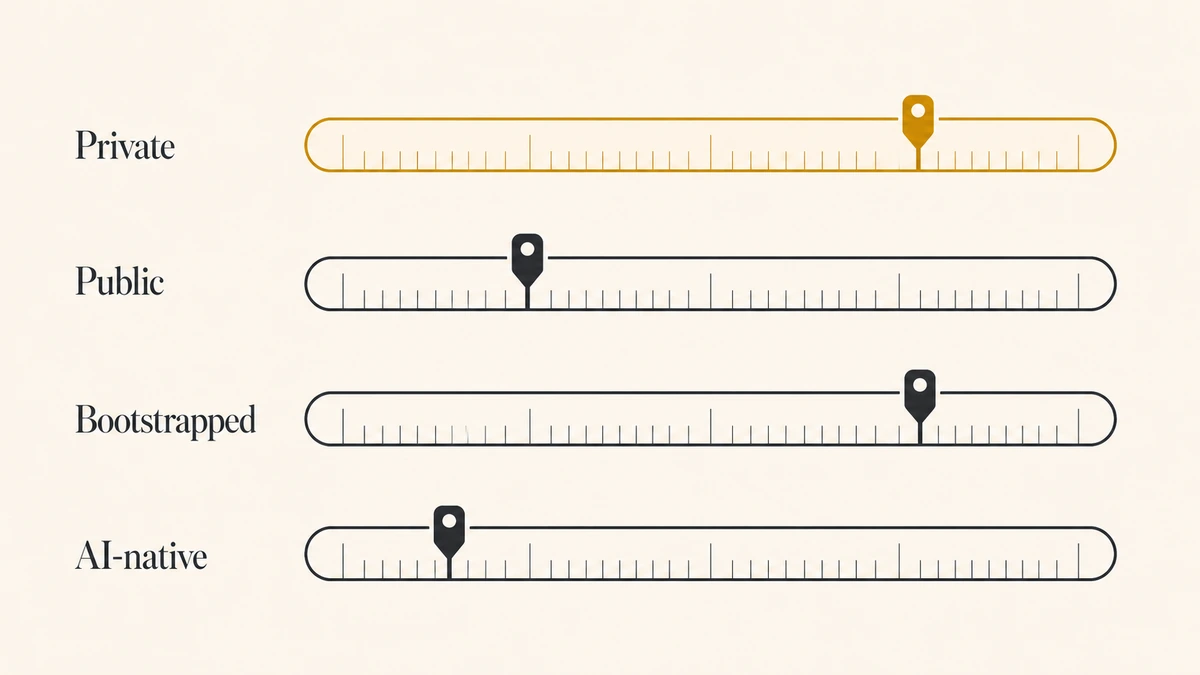
Pull three net revenue retention benchmarks from three credible sources and you will get 101%, 108%, and 118%. None of them is wrong. They measure different companies, in different years, at different contract sizes, under different ownership structures. The figure only means something once you know which of those four things it was measured on.
That gap is not academic. A bootstrapped team at $6M ARR that benchmarks itself against 118% concludes it has a retention crisis, when it is actually sitting a hair above the median for its band. A board deck that quotes a public-company median at a private company invites a question nobody in the room can answer.
What follows attaches a sample, a data period, and a contract-size band to every net revenue retention figure worth quoting in 2026. It also traces where the two most-repeated numbers in this category actually came from. Both turn out to be percentiles that got promoted to medians somewhere along the citation chain.
Direct answer — What is a good net revenue retention benchmark?
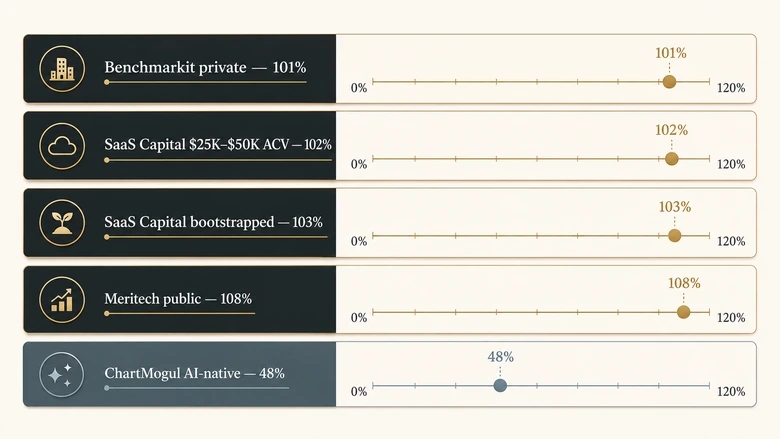
Net revenue retention benchmarks split by sample. Private B2B SaaS medians cluster between 101% and 103%: Benchmarkit reports 101% on 2024 data, and SaaS Capital reports 103% for bootstrapped companies at $3M to $20M ARR. Public software sits higher, at a median net dollar retention of 108% as of March 2026. Average contract value moves the number more than any other variable. Compare yourself only against companies matching your ownership structure and contract size.
Key Takeaways
- Private B2B SaaS medians cluster tightly at 101% to 103%. The wide spreads people quote come from mixing samples, not from real disagreement between surveys.
- Public software runs about 5 to 7 points above private, at a 108% median net dollar retention as of March 2026. Survivorship is doing part of that work.
- The widely quoted 118% enterprise figure closely tracks SaaS Capital’s 117.9% 90th percentile, not any published enterprise median.
- The 97% SMB figure is SaaS Capital’s bottom quartile of the $25,000 to $50,000 ACV band, not a segment median.
- AI-native products break the benchmark entirely: a 48% median NRR, and 32% below the $50 per month price point.
- Quote no NRR figure without three attachments: which sample, which period, which contract-size band.
What Is Net Revenue Retention?
Net revenue retention is the percentage of recurring revenue a company keeps from its existing customer base over a period, after expansion, downgrades, and churn, and excluding revenue from new customers acquired during that period. An NRR above 100% means the existing base grew on its own.
NRR = (Starting MRR + Expansion − Downgrades − Churn) ÷ Starting MRR × 100Two decisions inside that formula cause most of the variance between companies that believe they are reporting the same metric. The first is the cohort window: whether you measure a fixed set of customers over twelve months or re-cut the base every quarter. The second is what counts as expansion, specifically whether contractual price increases land in the numerator or get excluded as inflation.
Both decisions are defensible. Neither is standardised. That is worth holding onto before you compare your number to anyone else’s, and it is the same denominator discipline that governs which ARR figure you are dividing by in the first place.
Three Choices That Move Your Number by Points
Before you compare yourself to any published median, settle these three internally and write the answers down. Each one is worth several percentage points, which is the same order of magnitude as the gap between the segments people argue about.
- Cohort window. A fixed twelve-month cohort measures the same customers at both ends. A rolling quarterly re-cut quietly drops accounts that churned early, which flatters the result.
- Price increases. Counting an annual uplift as expansion raises NRR without a single additional seat sold. Excluding it produces a lower but more honest read on product-driven growth.
- Downgrade versus churn. A customer who cuts from 100 seats to 5 is a downgrade in most models and a churn event in a few. Both reduce NRR, but only one shows up in your logo retention.
- Currency. Multi-currency books measured at spot rates import exchange-rate movement into a retention metric. Constant-currency reporting removes it.
None of the published surveys can normalise for these choices across their respondents, which is the honest limitation sitting underneath every benchmark in this article. Two companies with genuinely identical retention can report NRR three points apart purely on methodology.
NRR and Net Dollar Retention Are the Same Metric
Public companies generally report net dollar retention, or NDR. Private surveys generally say net revenue retention. For nearly all practical purposes these are the same calculation under two names, which matters here because the cleanest public-company benchmark is published as NDR and the cleanest private benchmarks are published as NRR. Comparing them is legitimate. Pretending they came from the same population is not.
Net Revenue Retention Benchmarks by Sample
Every NRR benchmark is a statement about a specific set of companies. Here are the five samples that produce almost every figure in circulation, with what each one leaves out.
| Source | Sample | Period | Headline NRR | What it excludes |
|---|---|---|---|---|
| Benchmarkit, 2025 SaaS Performance Metrics | Private B2B SaaS | 2024 data | 101% median | Blended across contract sizes; the headline carries no ACV segmentation |
| SaaS Capital, 2025 retention benchmarks | Private B2B above $1M ARR | 2024 data | 102% median at $25K to $50K ACV | One published band; other bands sit inside the full report |
| SaaS Capital, bootstrapped benchmarks | 1,000+ bootstrapped private B2B, $3M to $20M ARR | Published April 2026 | 103% median | Equity-backed companies, by definition |
| Meritech Software Pulse | Public software companies | Reported March 2026 | 108% median NDR | Every private company, plus anything that never reached an IPO |
| ChartMogul, The AI Churn Wave | ~200 AI-native, ~2,700 B2B SaaS | January to September 2025 | 48% median for AI-native | Random sampling; companies were scraped and categorised, not surveyed |
Read down the headline column and the spread looks like chaos: 48% to 108%. Read across the sample column and it resolves. These are five different populations, and four of the five are internally consistent with each other once you control for ownership and contract size.
IMPORTANT
A figure of roughly 106% circulates widely as the “venture-backed median.” It has no traceable primary survey behind it. Where a number cannot be traced to a named sample with a stated period, treat it as folklore and leave it out of your board deck.
Sample Size Is the Caveat Nobody Requotes
Segment a survey finely enough and you eventually run out of companies. The segmented figures that travel furthest are often the ones resting on the thinnest data.
Benchmarkit’s 2025 report finds that expansion accounts for 67% of new ARR among companies above $100M ARR, and states plainly that this cut is limited to six companies. ChartMogul flags that its AI-native buckets fall to roughly 50 companies each at higher revenue levels, calling the result directional rather than definitive.
Neither caveat survives the trip into a roundup post. The number gets quoted; the sample note gets dropped. When you encounter a strikingly precise segment figure, the useful question is not whether it is accurate but how many companies produced it.
NRR Benchmarks by ACV Band
Average contract value predicts net revenue retention better than stage, sector, or headcount. Larger contracts mean procurement cycles, multi-year terms, and seat-based expansion paths that small contracts do not have.
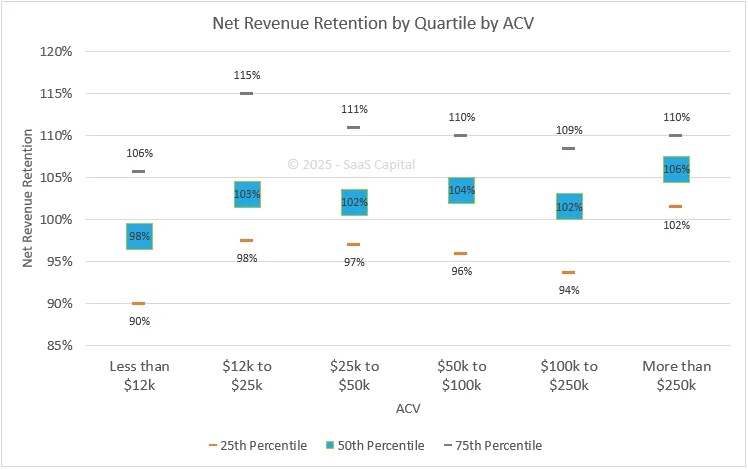
SaaS Capital publishes the cleanest banded figures. For private B2B companies above $1M ARR on 2024 data, the $25,000 to $50,000 ACV band shows a median NRR of 102%, a top quartile of 111%, and a bottom quartile of 97%.
| Segment | Bottom quartile | Median | Top quartile | Sample and period |
|---|---|---|---|---|
| $25K to $50K ACV | 97% | 102% | 111% | SaaS Capital, private B2B above $1M ARR, 2024 data |
| $3M to $20M ARR, bootstrapped | Not published | 103% | 117.9% (90th percentile) | SaaS Capital, 1,000+ bootstrapped private B2B, published April 2026 |
| All private B2B, blended | Not published | 101% | Not published | Benchmarkit, 2024 data |
| Public software | Not published | 108% (NDR) | Not published | Meritech, reported March 2026 |
Note what the table cannot give you. Only one row carries a full quartile spread. Everything else in circulation as a “band median” is either an unpublished cut or an inference someone made from a chart. That is not a reason to ignore banding, but it is a reason to state your source when you cite one.
AI-Native Products Sit Outside Every Traditional Band
ChartMogul’s retention study, covering January to September 2025, found a median NRR near 48% for AI-native products and roughly 40% gross revenue retention. The price-tier breakdown is sharper than the headline: products above $250 per month retain at about 85% NRR, the $50 to $249 tier at 61%, and products under $50 per month at 32%.
The study drew on roughly 200 AI-native companies alongside 2,700 B2B SaaS companies, and the authors flag that bucket sizes get small enough to be directional rather than definitive. Treat those figures as a signal about consumer-priced AI tooling, not as a benchmark for an AI feature inside an enterprise product.
Public and Private NRR Are Two Different Universes
Public software companies reported a median net dollar retention of 108% as of the March 2026 Meritech Software Pulse, which described the metric as close to its lowest point in years while showing early signs of recovery. Against private medians of 101% to 103%, that is a 5 to 7 point gap.
Two forces produce it, and only one is about product quality.
The first is contract size. Companies large enough to go public sell larger contracts, and larger contracts retain better. The second is survivorship. The public sample contains only companies whose retention was strong enough to survive to an IPO. Nobody publishes the NDR of the companies that stalled at $30M ARR and got acquired quietly.
The practical consequence: a private company benchmarking against public NDR is comparing itself to a filtered set of winners. If you need a public comparison because your investors think in those terms, say so explicitly in the deck and note the filter.
Why the Comparison Matters More in a Slow-Growth Year
Retention benchmarks get more scrutiny when new-logo growth is hard, and 2024 was hard. Benchmarkit’s data puts median ARR growth at 26% across its population, while private companies and smaller public companies both sat at a 7% median. Respondents planned for 35% in 2025, which is a gap between ambition and recent performance rather than a forecast.
When growth compresses, NRR stops being a health metric and becomes the growth plan. A company at 103% NRR generates 3% growth from its existing base before a single new deal, and that base contribution is the most predictable line in the model. It is also the line a board will benchmark hardest, because it is the one least dependent on market conditions.
This is the practical case for getting the comparison set right rather than reaching for the most flattering figure. Anchoring on 108% when your peers sit at 103% converts a solid result into a manufactured problem, and it usually costs a quarter of misdirected effort before anyone rechecks the source.
Where the 118% and 97% Figures Actually Come From
Two numbers dominate secondhand NRR writing. “Enterprise SaaS retains at 118%.” “SMB SaaS sits at 97%.” Both get quoted as segment medians. Neither is one.
The 118% figure tracks almost exactly onto SaaS Capital’s 117.9% reading at the 90th percentile for bootstrapped private B2B companies at $3M to $20M ARR, where the median is 103%. A 90th-percentile result describes the top tenth of a population. Requoted as an enterprise median, it sets a target that nine out of ten companies in the original sample failed to hit.
The 97% figure has the same problem in the other direction. In SaaS Capital’s published data, 97% is the bottom quartile of the $25,000 to $50,000 ACV band, a band whose median is 102%. It describes the weakest quarter of a mid-market sample. Requoted as an SMB median, it tells small-contract companies that underperformance is normal.
The 21-point spread between the “enterprise” and “SMB” NRR benchmarks is not a gap between two segments. It is the distance between the 90th percentile and the bottom quartile of overlapping private-company samples.
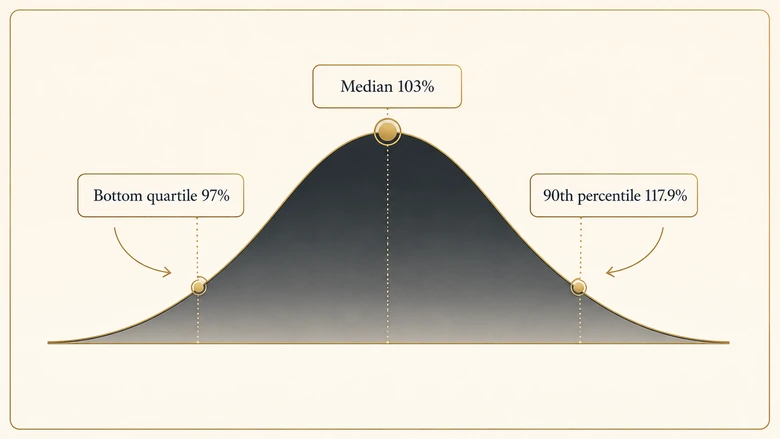
This is not a criticism of the underlying research. SaaS Capital labels its quartiles clearly. The distortion happens downstream, in roundup posts that strip the percentile label and keep the number, which is the same failure mode that produces unreliable figures across the wider SaaS metric set.
PRO TIP
Before quoting any NRR benchmark, find the word “median,” “quartile,” or “percentile” in the original source. If the number you are about to use does not carry one of those three labels in its own publication, you are almost certainly repeating a percentile as an average.
NRR vs GRR: What the Spread Reveals
Gross revenue retention strips expansion out of the calculation. It measures only what you kept: starting revenue minus downgrades and churn, divided by starting revenue. GRR can never exceed 100%.
GRR = (Starting MRR − Downgrades − Churn) ÷ Starting MRR × 100Benchmarkit’s 2025 report puts median GRR at 88% on 2024 data, down from 90% three years earlier. SaaS Capital’s bootstrapped sample reports 91% median GRR, with the 90th percentile reaching 100%.
The gap between your two numbers is the diagnostic. A company at 103% NRR and 91% GRR is expanding roughly 12 points to cover its losses. A company at 103% NRR and 78% GRR is running the same headline on a much leakier base, and is one enterprise renewal away from a bad quarter.
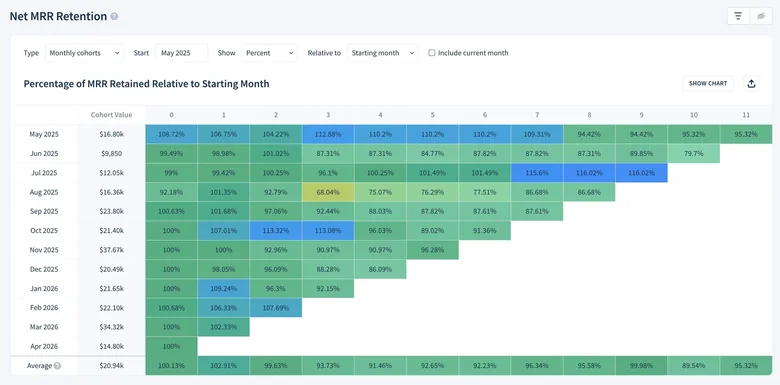
Watch the spread when it widens. A rising NRR paired with a falling GRR usually means expansion inside a handful of large accounts is masking broad-based churn underneath, which is a concentration risk rather than a retention win. That distinction is where churn rate diagnostics earn their place next to the retention headline.
Expansion Is Carrying More of the Number Every Year
The reason GRR keeps slipping while NRR holds near 101% is that expansion is doing progressively more of the work. Benchmarkit’s 2024 data puts median expansion ARR at 40% of total new ARR, up five percentage points year over year, against a traditional split closer to 30%.
That share climbs steeply with scale. At the $50M to $100M ARR band, expansion reaches a median of 58% of new ARR. Above $100M ARR it reaches 67%, though on a sample of six companies.
The strategic read matters more than the exact figure. A benchmark-matching NRR built on 40% expansion is a different business from the same NRR built on 15% expansion and unusually low churn. The first is compounding inside its base; the second is running a tight ship on a base that is not growing. Published medians cannot tell those two apart, and neither can a board that only looks at the headline.
How to Pick the Right NRR Benchmark
To benchmark net revenue retention defensibly, match the sample before you compare the number. Five steps, and the whole exercise takes about fifteen minutes once you have your own figure in hand.
Workflow · 15 min
How to choose a defensible NRR benchmark for your company
Match your ownership structure, contract size and reporting window to a named survey, then quote the figure with its sample attached.
Fix your ownership structure
Write down whether you are bootstrapped, equity-backed private, or public. Public NDR benchmarks are off-limits as a self-comparison for private companies unless you label the filter.
Calculate your average contract value
Divide total ARR by active customer count. Place yourself in a band: under $25K, $25K to $50K, or above $50K. This single number governs which benchmark applies.
Select the survey that matches both
Pick one named source covering your structure and band. Bootstrapped at $3M to $20M ARR maps to SaaS Capital; blended private maps to Benchmarkit; public maps to Meritech.
Read the quartile, not just the median
Locate the bottom quartile, median, and top quartile in that source. Judge yourself against the full distribution rather than a single point, which prevents percentile-as-median errors.
Restate the figure with its sample attached
Write the benchmark as source, sample, period, and band in one line. If you cannot fill all four fields, the number is not ready to go into a board deck.
What Good Looks Like at Your Stage
If you are bootstrapped between $3M and $20M ARR, 103% is your median and 118% is your stretch, not your baseline. If your ACV sits between $25,000 and $50,000, 102% is par and anything under 97% puts you in the bottom quarter of your peers. If you are public, 108% is the current bar and it has been falling.
And if you sell an AI-native product under $50 per month, none of the traditional bands apply to you. Benchmark against the 32% figure and treat any month above it as progress. Getting these comparisons right is the difference between a metric that guides decisions and one that just fills a dashboard slot.
What These Benchmarks Cannot Tell You
Being straight about the limits is part of using the data well. Four things no published NRR benchmark captures, however well you match the sample:
- Concentration. A 110% NRR where one customer supplies a third of expansion is fragile in a way the number cannot express. Two companies at identical NRR can carry completely different risk.
- Cohort age. Young bases churn harder. A company two years into selling will read lower than a ten-year-old peer at equal product quality, purely from cohort mix.
- Contract length. Multi-year contracts defer churn rather than preventing it. NRR looks strong right up to the renewal cliff, and no survey adjusts for term structure.
- Methodology drift. Every respondent applied their own answers to the cohort and price-increase questions above. The medians are aggregates of inconsistent definitions.
Use benchmarks to locate yourself roughly, then argue from your own cohort data. Anyone who tells you a single percentage point of NRR difference is meaningful across companies is reading more precision into these surveys than they contain.
Frequently Asked Questions
For private B2B SaaS, anything at or above 103% beats the bootstrapped median reported by SaaS Capital, and 101% matches Benchmarkit’s blended private median on 2024 data. Public software companies should measure against 108%. Below 100% means your existing base is shrinking and new sales are covering the gap.
Take the starting recurring revenue for a fixed cohort of customers, add expansion, subtract downgrades and churn, then divide by that starting figure. Exclude every customer acquired during the period. Fix your cohort window and your treatment of price increases first, because both choices move the result by several points.
It means every dollar of recurring revenue you held a year ago is now worth $1.25, from upsells and seat growth alone, after absorbing all churn. At 125% the existing base grows a quarter each year with zero new logos. That sits above the 90th percentile of every private sample published in 2026.
It means expansion revenue exceeded all losses by 20 percentage points over the period. It is frequently cited as an enterprise standard, but no published survey reports 120% as a segment median. The closest real figure is SaaS Capital’s 117.9% at the 90th percentile for bootstrapped companies at $3M to $20M ARR.
Because each survey covers a different population. Public samples run higher than private ones because of contract size and survivorship. Contract-size bands move the figure by 10 points or more. And percentiles routinely get requoted as medians downstream, which manufactures spreads that the underlying research never reported.