Someone on your team screenshots the LinkedIn Page analytics dashboard, points at a 14% click-through rate, and asks why the paid campaigns only manage 0.5%. Both numbers are on the screen. Both are labelled CTR. Neither one is wrong, and comparing them is meaningless.
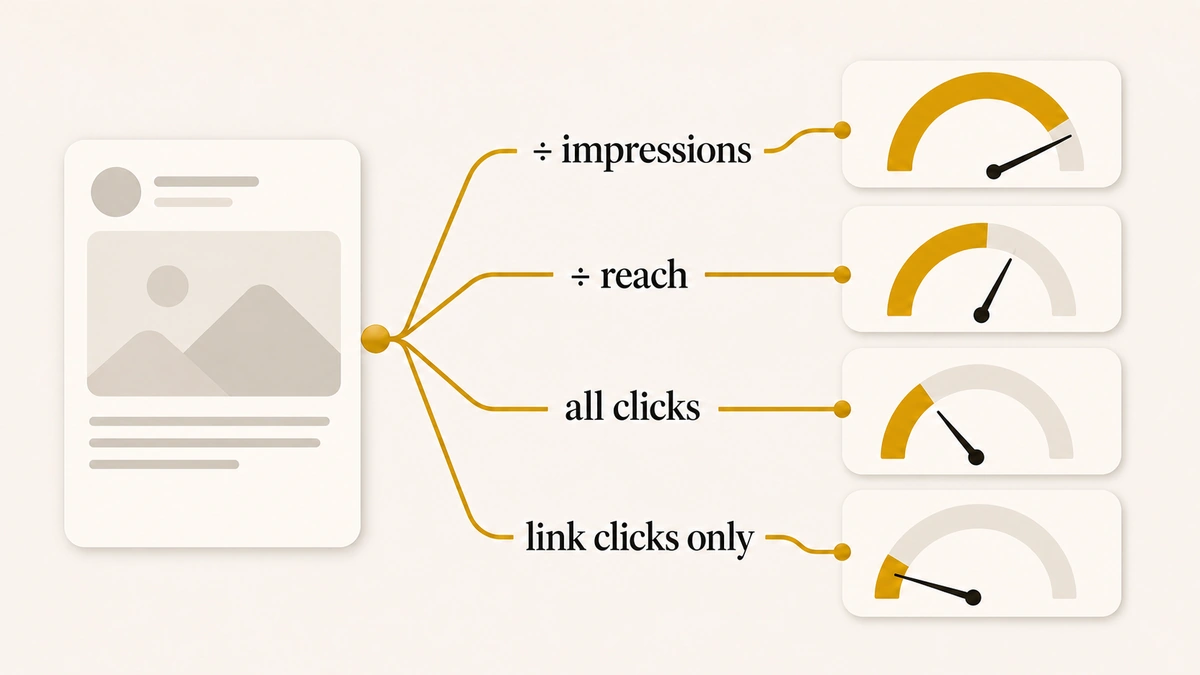
LinkedIn organic CTR is the most inconsistently reported metric in B2B social. Published benchmarks for the same thing range from about 3% to comfortably into the double digits, which is a spread of roughly 5x. That is not measurement error or a difference in sample quality. Every one of those numbers is arithmetically correct. They divide different things by different things, and almost nobody publishes which.
Direct answer — what is the average organic CTR on LinkedIn?
There is no single average, because “CTR” names at least three different calculations on LinkedIn. Link clicks divided by impressions typically lands in the low single digits, and 3% to 5% is widely treated as good. LinkedIn’s own dashboard reports a higher figure because its clicks metric counts clicks on your company name and logo, not just your link. Social Status divides link clicks by reach instead of impressions, which raises the result again.
Key Takeaways
- LinkedIn’s native CTR counts clicks on “your content, company name, or logo” over impressions, so it is not a link click-through rate and should never be compared with a paid CTR.
- A comparable organic benchmark is link clicks divided by impressions. Cleverly puts a good result at 3% to 5% of impressions.
- Paid Sponsored Content sits at 0.44% to 0.65%. The gap versus organic is mostly definitional, not a performance gap.
- Published engagement rates by post type already include clicks, so treating a 7% document-post engagement rate as a click rate double-counts.
- No public dataset reports CTR by follower band. What exists is impressions per post by band, which is enough to model expected link clicks.
What counts as a good LinkedIn organic CTR
A good LinkedIn organic CTR is 3% to 5% of impressions when measured as link clicks divided by impressions, according to Cleverly’s 2026 LinkedIn benchmarks. That is the figure to use if you want one number and you are willing to define the metric properly first.
The reason that number feels low to anyone reading their own dashboard is that the dashboard is not reporting the same thing. Before any benchmark is useful, you need to know which of three calculations produced it, because the three answers to “what is my organic CTR” can differ by a factor of five on identical posts.
The rest of this page gives you the four published benchmarks with their formulas exposed, the post-type and follower-band data that does exist, and the one calculation worth standardising on.
Paid and organic LinkedIn CTR are different metrics
Paid LinkedIn CTR and organic LinkedIn CTR are not two readings of one metric. They have different numerators, different denominators, and different behaviour, and a team that benchmarks one against the other will reach the wrong conclusion in both directions.
On the paid side the definition is stable. An ad’s CTR is link clicks over impressions, the platform enforces it, and every published benchmark uses it. ZenABM’s analysis of 161,256 LinkedIn ads across 211 companies puts median Sponsored Content between 0.24% and 0.55% depending on format, with the platform-wide range usually quoted as 0.44% to 0.65%.
| Paid (Sponsored Content) | Organic (Page posts) | |
|---|---|---|
| Numerator | Link clicks only | Depends on the source |
| Denominator | Impressions | Impressions or reach |
| Typical published figure | 0.44% to 0.65% | 3% to 5%, or higher |
| Definition enforced by | LinkedIn Campaign Manager | Whoever wrote the blog post |
| Audience | Targeted, largely cold | Followers and their networks |
Warm audiences click more, and that is real
The audience difference matters as much as the arithmetic. An ad is shown to people who have never chosen to hear from you. An organic post reaches followers who already opted in, plus whoever their engagement pulls in. Warmer audiences click more. That is a real effect, and it is layered on top of the definitional gap rather than explaining it away.
IMPORTANT
If your reporting puts organic and paid CTR in the same column of the same table, the organic column will look five to twenty times better every month. It is not. Label the two metrics separately or drop one.
Because the paid definition is the stable one, it is the better place to start when someone asks whether a click rate is healthy. Our breakdown of what a strong LinkedIn ad CTR looks like by format and industry sets those thresholds, including why Thought Leader Ads clear 2.68% while Text Ads sit at 0.02%.
Four published benchmarks, four different formulas
Four widely cited sources report a LinkedIn organic click or engagement rate. Each one is internally consistent. None of them measures the same quantity as the others, and only one publishes its formula prominently.
| Source | Published figure | Numerator | Denominator | What it actually measures |
|---|---|---|---|---|
| LinkedIn Page analytics | Your own dashboard number | Clicks on content, company name, or logo | Impressions | All post clicks, including brand-name clicks |
| Social Status | Double digits, rolling monthly | Link clicks | Reach | Link clicks per person reached |
| Cleverly | 3% to 5% (good) | Link clicks | Impressions | Link clicks per view |
| Socialinsider | 5.20% (engagement, not CTR) | Clicks, reactions, comments, shares | Impressions | All interaction of any kind |
Social Status states its formula plainly: “Post CTR = Link Clicks divided by Reach.” Reach counts distinct people; impressions count displays, and one person can generate several. Swapping impressions for reach in the denominator shrinks it, and a smaller denominator produces a bigger percentage on identical click data. That single substitution is enough to move a low-single-digit figure into the teens.
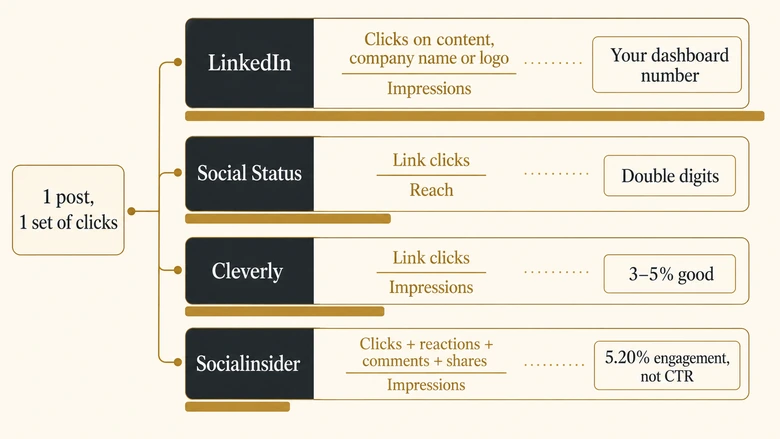
The Socialinsider row is the one that catches most teams. A 5.20% engagement rate is not a click rate at all, but it sits next to click data in the same reports and gets quoted as if it were.
What LinkedIn counts as a click on your post
LinkedIn defines a click as an action on your content, your company name, or your logo. That definition comes from LinkedIn’s own documentation, and it is the reason native dashboard CTR runs so far above every link-based benchmark.
Here are the four definitions from LinkedIn’s Page content analytics documentation, quoted directly:
- Clicks: “Shows the number of clicks on your content, company name, or logo by a signed in member. This doesn’t include interactions, such as reposts, reactions, and comments.”
- Impressions: “The number of times your post was shown on LinkedIn. This number is an estimate and may not be precise.”
- Members reached: “The number of distinct members and Pages that saw your post. This number is an estimate and does not include repeat displays.”
- Click-through rate: “Shows the number of clicks your post received divided by the number of impressions your post received.”
Read those together and the mechanism is obvious. LinkedIn’s CTR is clicks over impressions, and clicks includes people tapping your company name to see who posted. Someone who reads your post, clicks your logo out of curiosity, and never touches your link has contributed to your click-through rate.
There is a second, quieter distortion. Clicks are counted per signed-in member, so one person clicking three times counts once. Impressions are not deduplicated, so that same person seeing the post three times counts three times. A deduplicated numerator over an undeduplicated denominator drags the result down, partly offsetting the inflation from brand clicks. The two effects do not cancel cleanly, and neither is visible in the reported number.
PRO TIP
LinkedIn’s engagement rate carries the same problem. Its documentation defines interactions as “clicks, reactions, comments, and shares”, so every published engagement rate built on LinkedIn’s formula already contains the inflated clicks figure inside it.
LinkedIn organic benchmarks by post type
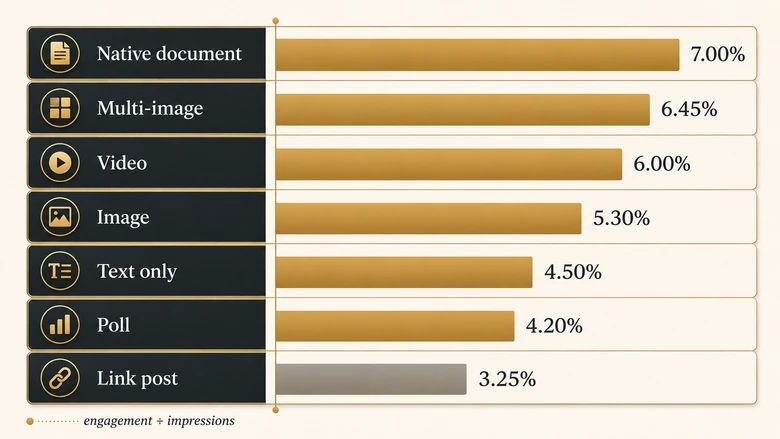
Organic performance varies more by post format than by almost any other variable. The largest published dataset is Socialinsider’s LinkedIn benchmark study, covering 1.3 million posts from 16,645 business pages between January 2024 and December 2025.
One caveat governs the whole table. Socialinsider reports engagement rate, not CTR, and states it uses LinkedIn’s formula, which means clicks are already inside these numbers alongside reactions, comments and shares. Treat them as a ranking of format strength, not as click rates.
| Post type | Engagement rate (engagement ÷ impressions) | Includes clicks? |
|---|---|---|
| Native document (carousel PDF) | 7.00% | Yes |
| Multi-image | 6.45% | Yes |
| Video | 6.00% | Yes |
| Image | 5.30% | Yes |
| Text only | 4.50% | Yes |
| Poll | 4.20% | Yes |
| Link post | 3.25% | Yes |
Why link posts rank last on every format table
Link posts finish last, and that single row explains a practice most B2B teams follow without being able to justify it. Putting the link in the first comment rather than the post body is a response to link posts underperforming on every format ranking published. Whether the workaround still helps is contested, but the data behind the habit is real.
Metricool’s 2026 LinkedIn study, built on 673,658 posts from 63,108 accounts, reports the same format ordering from a separate sample: carousels lead on interactions, clicks and shares, while image and video posts make up roughly 75% of what pages actually publish. Average clicks per post rose from 97.54 to 102.32 year over year, a 4.90% increase, which Metricool attributes to clicks and other low-visibility actions carrying more of the engagement load than reactions now do.
What a click means changes by format
Format also shifts what a click means. A document post earns clicks from people swiping through slides, which register as content clicks and never send anyone to your site. A link post earns fewer clicks in total but a far higher share of them leave LinkedIn. Our library of LinkedIn ad examples broken out by format shows the paid mirror of the same pattern, where Document Ads and Carousel Ads carry different CTR economics from Single Image.
LinkedIn organic reach by follower band
No public dataset reports LinkedIn organic CTR by follower band. This is worth stating plainly, because tables claiming to show it circulate widely and none of them cite a source that measured it. Socialinsider, the largest study available, publishes zero CTR figures.
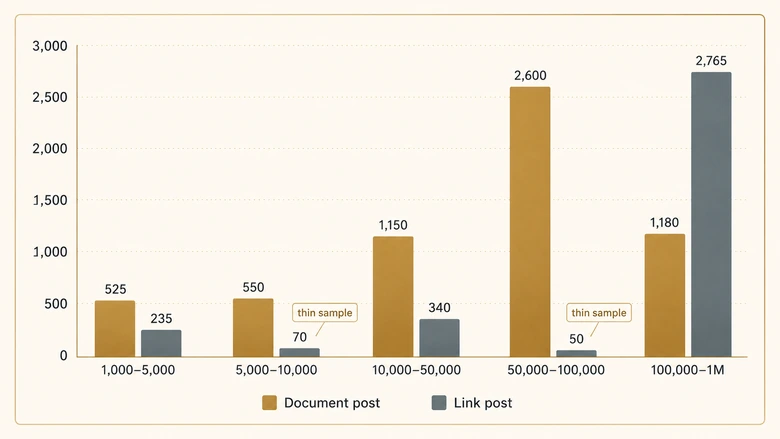
What does exist is median impressions per post by follower band, which is the denominator half of the calculation. Combined with a click rate, it produces something more useful than a percentage anyway: how many link clicks a post of your size should actually deliver.
| Page followers | Document post impressions | Link post impressions | Expected link clicks at 1% | Expected link clicks at 3% |
|---|---|---|---|---|
| 1,000 to 5,000 | 525 | 235 | 5 | 16 |
| 5,000 to 10,000 | 550 | 70 | 6 | 17 |
| 10,000 to 50,000 | 1,150 | 340 | 12 | 35 |
| 50,000 to 100,000 | 2,600 | 50 | 26 | 78 |
| 100,000 to 1M | 1,180 | 2,765 | 12 | 35 |
The impression columns are Socialinsider’s published medians. The two right-hand columns are derived, not measured: they apply a 1% and a 3% link-click rate to the document-post impressions in each row. The formula is deliberately simple so you can substitute your own rate.
Expected link clicks = Median impressions × Link click rateWhere the segment data thins out
Two rows in that table are unreliable and it would be dishonest to present them smoothly. Link posts at 5,000 to 10,000 followers show 70 impressions, and at 50,000 to 100,000 they show 50, both far below the bands beneath them. Those are thin-sample artefacts rather than a real collapse in reach. Even a 1.3 million post dataset gets sparse once it is cut by format and follower band at the same time, which is one more reason to treat segment-level benchmarks as directional.
The practical reading is that a 5,000-follower page publishing document posts should expect somewhere between 5 and 17 link clicks per post. Not a percentage. A number of humans, small enough that a single week of data tells you almost nothing and a quarter tells you a lot.
How to calculate a LinkedIn organic CTR you can compare
To calculate a comparable LinkedIn organic CTR, divide link clicks by impressions and exclude every other click type. This is the only version of the metric that lines up with published benchmarks and with your own paid reporting.
Organic link CTR = Link clicks ÷ Impressions × 100Workflow · 15 min
How to calculate a comparable LinkedIn organic CTR
Produces an organic click-through rate you can benchmark against published figures and against your own paid campaigns.
Export post-level analytics, not page-level
Open Page admin view, go to Analytics, then Content, and export the post-level XLS. Page-level summaries blend formats and hide the click breakdown you need.
Isolate link clicks from total clicks
Total clicks include company name and logo clicks. Where the export does not separate them, use UTM-tagged destination sessions as your link-click count instead.
Divide by impressions, never by reach
Use the impressions column, not members reached. Reach in the denominator inflates the result and breaks comparability with paid benchmarks.
Segment by post format before comparing
Calculate separately for link posts, document posts and video. A blended organic CTR across formats moves whenever your content mix moves.
Set your baseline over a full quarter
At typical B2B page sizes a single post produces single-digit link clicks. Ninety days of posts is the shortest window that yields a stable number.
Separating link clicks from total clicks
Step two is where most measurement projects stall. If your export does not split link clicks out, UTM parameters on every LinkedIn destination URL will do it, and the analytics session count becomes your numerator. That approach has the added benefit of counting clicks that actually arrived rather than clicks that were registered.
It also exposes the limit of the whole exercise. A click tells you an anonymous member went to your site; it does not tell you which company they work for, and LinkedIn passes no identity through to your analytics. Closing that gap needs a separate layer, and the honest version of that conversation starts with what visitor identification match rates actually deliver before you build reporting that assumes every click becomes a named account.
A rising CTR is not automatically good news
One last piece of judgement. A rising organic CTR is not automatically good news. Cutting your posting volume to only the strongest topics lifts the rate while shrinking total clicks, and a page that optimises the percentage instead of the absolute number can report improvement all the way down.
Frequently Asked Questions
Measured as link clicks divided by impressions, 3% to 5% is widely treated as good for organic LinkedIn posts. Anything materially above that usually indicates a different formula, most often reach in the denominator or LinkedIn’s native clicks metric, which counts company name and logo clicks alongside link clicks.
Sponsored Content averages 0.44% to 0.65%, well below organic figures. Most of that gap is definitional rather than performance: ad CTR counts link clicks only, over impressions, on a cold targeted audience. Organic benchmarks often count more click types over a smaller denominator, on a warmer opted-in audience.
For a genuine link CTR over impressions, 7% would be excellent and worth verifying. Check the formula first. If the number came from LinkedIn’s dashboard it includes company name and logo clicks, and if it came from a tool dividing by reach it is inflated relative to every impression-based benchmark.
The habit exists because link posts rank last on engagement rate at 3.25%, below every other format. Moving the link to a comment can protect reach, but it adds a step for the reader, so total link clicks sometimes fall even as impressions rise. Test it on your own page rather than assuming.
Almost always the numerator. LinkedIn defines clicks as actions on your content, company name, or logo, so profile-curious readers who never touched your link are counted. Recalculate using link clicks only, or UTM-tagged sessions, and the figure typically drops into the low single digits.