Direct answer — What is the average CTR for LinkedIn ads?
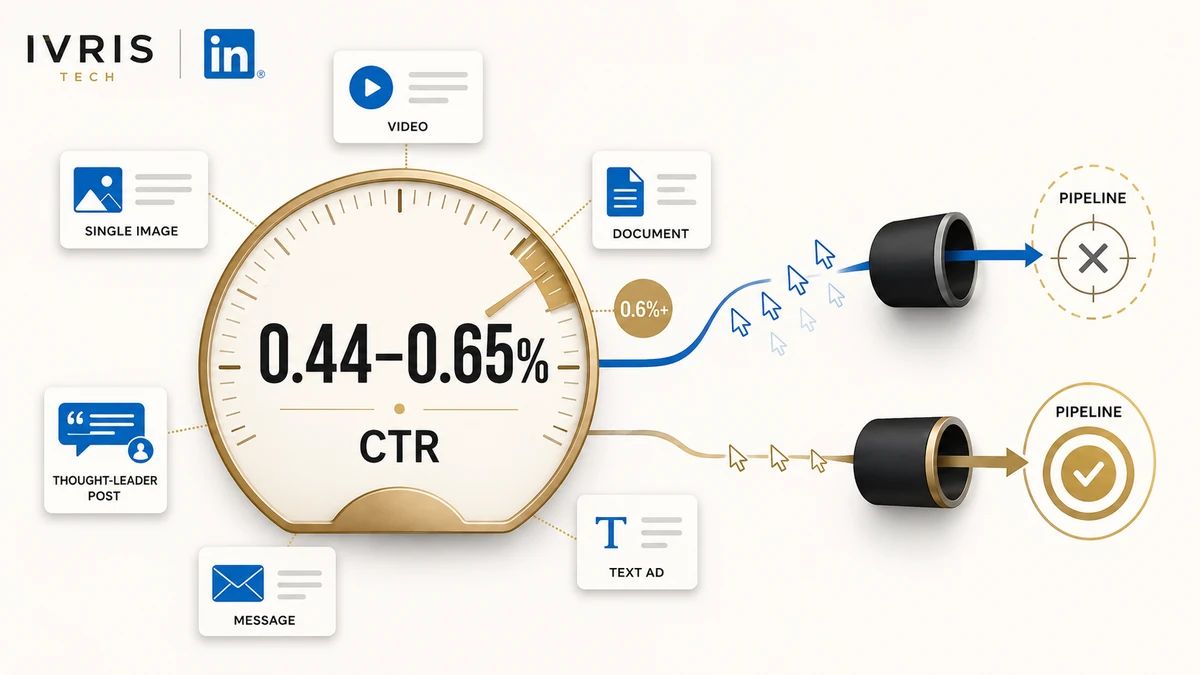
The average CTR for LinkedIn ads (Sponsored Content) is 0.44% to 0.65% globally in 2026, the consensus band across The B2B House, Factors.ai, and ZenABM. It moves sharply by format: Single Image sits near 0.5%, Video spans 0.24% to 0.71%, and Thought Leader Ads reach 2.68% (ZenABM, 2026). These are benchmark medians, not account targets, and Message Ads (3%+) use a different metric. A “good” Sponsored Content CTR is roughly 0.6% or higher.
Ask ten B2B marketers what the average CTR for LinkedIn ads should be and you’ll get ten answers, most of them quietly wrong. Some quote a single platform-wide number. Some compare their feed ads to Google Search and panic. A few chase a high click rate that never turns into a single booked meeting. The number you actually need depends on the ad format, the industry, and what the campaign is supposed to do.
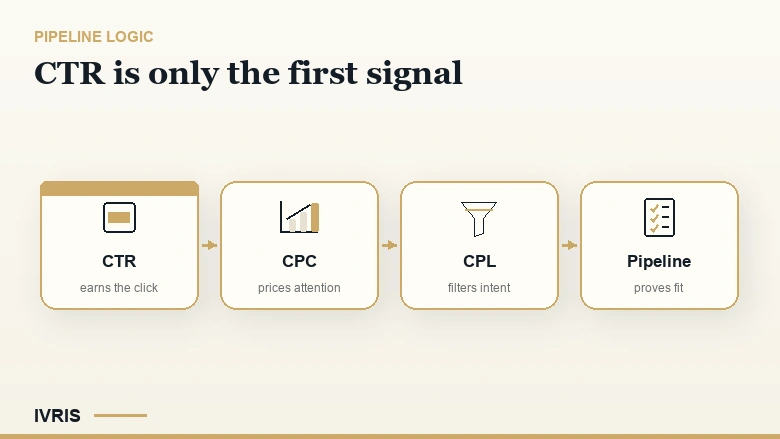
This is the benchmark reference we wish existed when a client forwards a dashboard and asks, “is this good?” Every figure below carries a named source and a year, the spread is shown where publishers disagree, and the costs that sit underneath the click rate (CPC, CPL, and lead quality) are part of the picture, not an afterthought. The average click-through rate for LinkedIn ads is the starting line, not the finish.
Key Takeaways
- The 2026 average CTR for LinkedIn Sponsored Content is 0.44% to 0.65% globally, with most first-party 2026 datasets landing near 0.61% (The B2B House, Digital Applied, ZenABM).
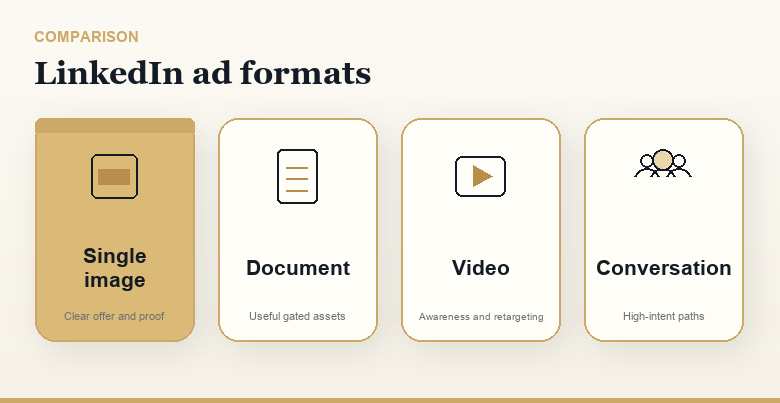
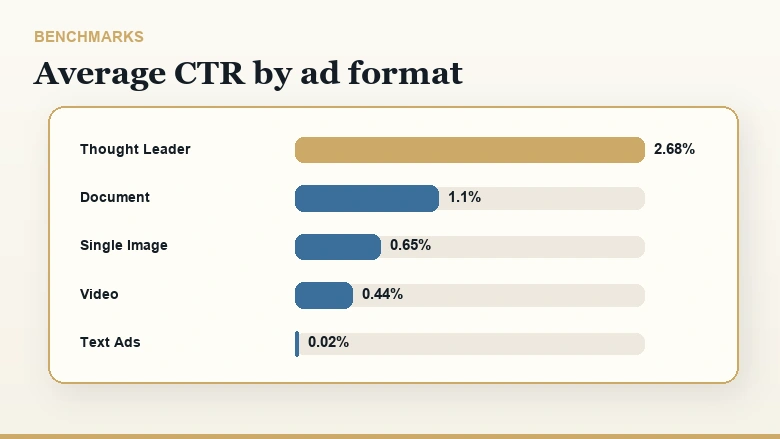
- Format decides almost everything: Thought Leader Ads hit 2.68% and Message Ads run 3%+, while Single Image sits near 0.5%, Video spans 0.24% to 0.71%, and Text Ads bottom out at 0.02% (ZenABM, 2026).
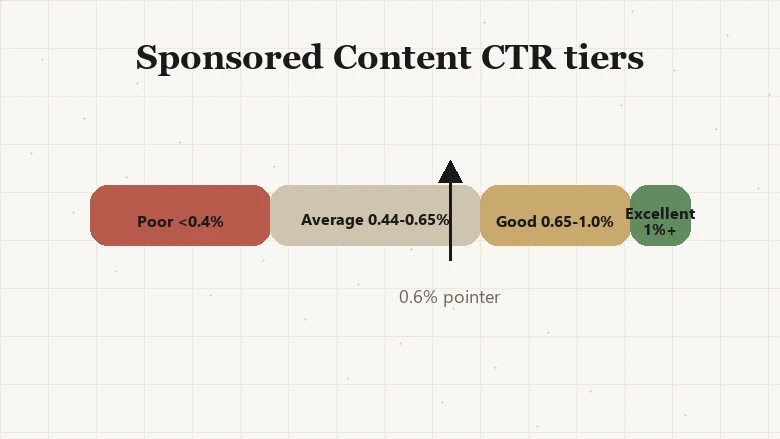
- A good Sponsored Content CTR is about 0.6% or higher; below 0.4% is relevance-penalty territory (Factors.ai, Digital Applied, 2026).
- Benchmarks are medians, not targets. Your own historical account data is the more honest yardstick.
- CTR is a weak predictor of revenue. ZenABM found click rate negatively correlates with pipeline (rho = -0.170), so read it next to CPC, CPL, and conversion rate.
Here is the fastest way to read your own number. The tiers below are for Sponsored Content, the format most B2B teams run, judged against the global benchmark band.
| Tier | Sponsored Content CTR | What it means |
|---|---|---|
| Poor | Below 0.40% | Relevance-penalty territory; LinkedIn effectively charges more per click (Digital Applied, 2026) |
| Average | 0.44% to 0.65% | The global benchmark band (The B2B House, Factors.ai, ZenABM, 2026) |
| Good | 0.65% to 1.0% | Above the band, usually tight targeting plus native creative (Factors.ai, Quimby, 2026) |
| Excellent | 1.0% and up | Top-quartile, most often retargeting or Thought Leader Ads |
What is the average CTR for LinkedIn ads?
The average CTR for LinkedIn ads is the share of people who click an ad after seeing it, calculated as clicks divided by impressions, times 100. For Sponsored Content in 2026 it sits at 0.44% to 0.65% globally, a band that has held steady across The B2B House, Factors.ai (citing Powered by Search), and ZenABM’s first-party data. Roughly one click for every 150 to 230 impressions.
CTR = (Clicks ÷ Impressions) × 100Two 2026 first-party datasets land at the upper-middle of that band. Digital Applied’s April 2026 report puts cross-industry Sponsored Content CTR at 0.61%, up a hair year over year. Quimby Digital reports the same 0.61% global figure. So if you want one number to quote, 0.61% is the defensible 2026 central estimate, with 0.44% to 0.65% as the honest range around it.
One caveat worth stating plainly: that 0.44% to 0.65% band traces back to data timestamped “as of February 2024” on several pages that now carry a 2026 title. The number is durable, not freshly re-measured every quarter. Treat it as a stable consensus, and check the year on any benchmark before you quote it.
Average CTR by LinkedIn ad format (2026)
LinkedIn ad CTR varies more by format than on any other major platform, so a blended “platform average” is close to meaningless on its own. The table below collects the per-format medians, the threshold that counts as good for each one, and who reports the figure. Where publishers disagree, the spread is shown rather than hidden behind false precision.
| Ad format | Avg CTR (2026) | “Good” benchmark | Source / note |
|---|---|---|---|
| Sponsored Content (Single Image) | 0.44% to 0.56% | 0.6%+ (below 0.4% is poor) | The B2B House 0.56%, Digital Applied 0.54%, ZenABM 0.42% median, B2Linked 0.44% (2022) |
| Video Ads | 0.24% to 0.71% | Judge on view rate, not clicks | Wide spread: ZenABM 0.24%, The B2B House 0.44%, Digital Applied 0.71% |
| Carousel Ads | 0.32% to 0.40% | 0.3%+ | The B2B House 0.40%, ZenABM 0.32% |
| Document Ads | ~0.43% | 0.4% to 0.5% | The B2B House and ZenABM both report 0.43% |
| Event Ads | ~0.55% | n/a | The B2B House and ZenABM both report 0.55% |
| Thought Leader Ads | 2.68% | 2.0%+ | ZenABM 2026 (highest-CTR format, ~6x Single Image); Digital Applied models it lower at 0.94% |
| Message Ads (Sponsored InMail) | 3.2% to 3.6% | 7%+ is stellar | B2Linked 3.2%, Factors.ai 3.2%, The B2B House 3.6%; different metric, EU targeting restricted |
| Conversation Ads | ~12% (single source) | n/a | The B2B House (50% open rate); different metric, EU targeting restricted |
| Text Ads | 0.02% to 0.025% | n/a | Lowest-CTR format: B2Linked 0.025%, ZenABM 0.02%, Factors.ai 0.024% |
| Dynamic / Spotlight Ads | ~0.08% | n/a | Right-rail; B2Linked and ZenABM both report ~0.08% |
Average LinkedIn ad CTR by format, 2026. Primary sources: ZenABM (161,256 ads across 211 companies), The B2B House, Digital Applied, Factors.ai, B2Linked. Figures are benchmark medians, not account targets.
Why Thought Leader and Message Ads look so high
Thought Leader Ads (TLAs) sponsor an organic post from a person’s profile, so they read as a peer’s opinion rather than a brand placement. ZenABM’s 2026 dataset of 161,256 ads puts their median CTR at 2.68%, roughly six times Single Image, at a fraction of the cost per click. That is the single biggest CTR lever most B2B teams still under-use.
Message and Conversation Ads sit in the inbox, not the feed, so their 3% to 12% click rates are a different metric entirely. The B2B House says plainly that these formats “don’t follow the standard sponsored content metrics.” They also carry an availability catch: LinkedIn restricted EU-member targeting for Sponsored Messaging to new campaigns from December 2021 and existing campaigns from January 2022, so they’re effectively off the table for EU audiences. Never blend their CTR into a Sponsored Content average. If you want to see what each of these formats looks like in the wild, the patterns in our roundup of the ad creative behind these format gaps show why some convert and others burn budget.
LinkedIn ad CTR by industry (2026)
LinkedIn ad CTR by industry ranges from roughly 0.4% in Legal Services to 0.84% in Media and Publishing, with most B2B verticals clustering between 0.5% and 0.8%. The table pairs CTR with the cost figures that matter for budgeting, and flags how well-sourced each row is so you can weight it accordingly.
| Industry | Avg CTR | CPC | CPL | Confidence |
|---|---|---|---|---|
| B2B SaaS / Software | 0.39% to 0.93% | $6.04 | $79 | Confirmed |
| Financial Services | 0.45% to 0.49% | $6.84 | $148 (highest) | Confirmed |
| Healthcare | 0.58% to 0.62% | $5.48 | $129 | Confirmed |
| Education | 0.42% to 0.79% | $4.18 | $112 | Confirmed |
| Manufacturing | 0.49% to 0.81% | $5.61 | $84 | Confirmed |
| IT & Cybersecurity | 0.71% | $6.41 | $103 | Single source |
| Professional Services | 0.66% | $5.32 | $97 | Single source |
| Management Consulting | 0.64% | $6.18 | $98 | Single source |
| Media & Publishing | 0.84% (highest) | $4.31 | $64 | Single source |
| Legal Services | 0.42% (lowest) | $7.95 (highest) | n/a | Single source |
| Nonprofit | n/a | $3.12 (lowest) | $48 (lowest) | Single source |
LinkedIn ad CTR, CPC, and CPL by industry, 2026. Sources: Digital Applied (April 2026), The B2B House (updated December 2025), Chartis Interactive (January 2025). “Confirmed” means two or more independent sources agree; “single source” means one publisher reports it.
Read the ranges, not the points. SaaS is the clearest example: The B2B House reports Software and Internet at 0.39%, its lowest vertical, while Digital Applied puts B2B SaaS at 0.74% and Chartis measures 0.93% for website-visit campaigns specifically. The honest blended read for SaaS is roughly 0.4% to 0.75%, and the spread comes from how each publisher slices objectives and audiences, not from one being wrong.
What counts as a good CTR for LinkedIn ads?
A good CTR for LinkedIn Sponsored Content is about 0.6% or higher, sitting at the top of the 0.44% to 0.65% average band, with 1% or more counted as strong. Below roughly 0.4%, Factors.ai and Digital Applied both treat the ad as paying a relevance penalty on every click. The threshold is format-specific, though, so a “good” number for a TLA looks nothing like a “good” number for a Single Image ad.
Is a 2% CTR good? For Sponsored Content, yes, it would be excellent, well above the benchmark band. For Message Ads (3% to 12%) or Thought Leader Ads (2.68% median), 2% is only average or slightly below. That is the trap with a single “good CTR” number: 2% can be a triumph or a disappointment depending entirely on the format you ran. LinkedIn CTRs also look low next to paid search, which is the wrong comparison; the demand-capture math is different, as our guide to where Google Search ads fit on the demand-capture side lays out.
IMPORTANT
Benchmarks are medians across many accounts, not goals for yours. A campaign can sit below the median for good reasons (cold audience, awareness objective) or above it for bad ones (a tiny remarketing pool clicking repeatedly). Your own 90-day account history is the more reliable target.
When to judge yourself against which benchmark
Pick the benchmark that matches the job the campaign is doing, not the platform-wide average. Comparing an awareness video to a lead-gen Single Image benchmark will make a healthy campaign look broken. Use this decision guide.
- Awareness or thought leadership: judge against Thought Leader Ads (2.0%+) or video view rate, not feed CTR. Clicks are not the point; reach and influenced pipeline are.
- Lead generation: judge Single Image and Document Ads against 0.5% to 0.65%, and prefer native Lead Gen Forms, which convert far better than off-platform pages (more on that below).
- Retargeting warm audiences: expect 2 to 3 times the cold-audience CTR, roughly 0.9% to 1.4% (Stackmatix, 2026). If a retargeting pool is not beating cold prospecting, the audience or frequency is off.
- Cold prospecting: the 0.44% to 0.65% band is your line. Sub-0.4% means the creative or targeting needs work before you scale spend.
If LinkedIn sits inside a wider paid program, decide who runs and reports it before you obsess over the number. Our shortlist of the specialist tools and agencies that run LinkedIn ads covers when to bring that in-house versus hire it out.
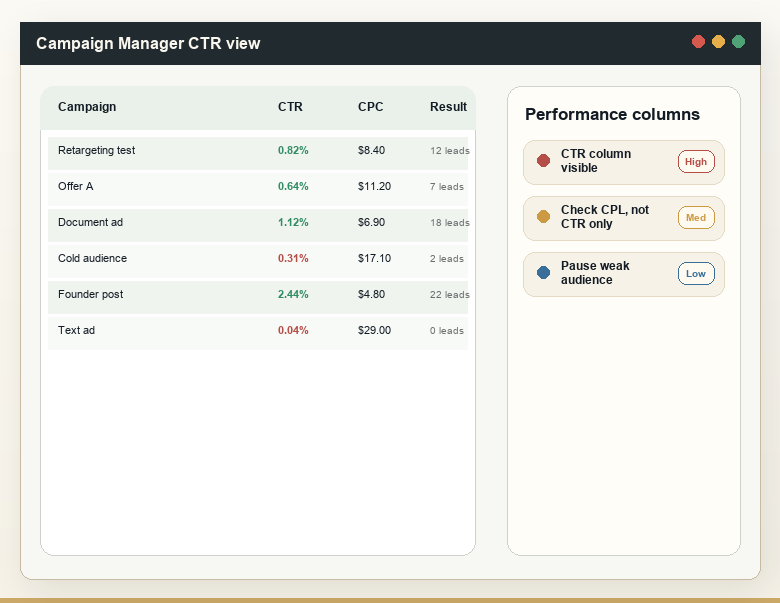
How CTR ties to CPC, CPL, and lead quality
CTR only matters because of what sits underneath it: cost and quality. A higher click rate usually means a lower effective cost per click, because LinkedIn’s auction rewards relevance. The 2026 cross-industry average CPC is $5.58 globally (The B2B House) to $5.74, up 9% year over year (Digital Applied), with CPM near $33.80. B2B SaaS runs hotter, $10.48 to $15.72 per click across 2025 (HockeyStack’s report on 70+ SaaS companies and $28M in spend).
CPM follows the same competitive pattern. Digital Applied’s 2026 cross-industry CPM is $33.80, but it swings from $19.80 in Nonprofit to $42.10 in Financial Services and $48.20 in Legal Services, the two verticals that also carry the highest cost per click. The reason CTR, CPC, and CPM move together is the auction: LinkedIn rewards relevant ads with cheaper impressions, so a weak click rate quietly inflates every cost line beneath it. That feedback loop is why a sub-0.4% CTR is expensive twice over, once in wasted impressions and again in a higher effective bid.
Cost per lead is where the click rate cashes out. The 2026 cross-industry CPL is $94, up from $87 in 2025, with a wide $15 to $350 spread and steep regional gaps: roughly $230 in North America against $80 in APAC (The B2B House). The single biggest CPL lever is the form itself. Native Lead Gen Forms convert at 6.1%, about five times the rate of off-platform landing pages, because pre-filled fields cut drop-off to 28% against 65% on external pages (Digital Applied, 2026). When you compare your numbers across channels, pull every channel’s click data into one report so a strong LinkedIn CTR is judged on cost per qualified lead, not raw clicks.
Here is the uncomfortable part. A high CTR does not predict revenue. ZenABM’s 2026 analysis found click-through rate negatively correlates with pipeline (rho = -0.170). An ad that begs the click (“free iPad,” anyone) can post a great CTR and a terrible cost per qualified lead. The Reddit threads are full of teams reporting a “decent 2.8% CTR” alongside almost no conversions. Read CTR as a creative-relevance signal, then let CPL and conversion rate decide whether the campaign is actually working.
How to lift a below-benchmark LinkedIn CTR
If your CTR sits under the format benchmark, the fix is almost always targeting tightness or creative fit, in that order. Work through these before touching bids.
- Tighten the audience. “All marketing managers” wastes LinkedIn’s main advantage. Stack function, seniority, company size, and one behavioral or list-based qualifier.
- Make the ad look native. Heavily designed corporate creative reads as an ad instantly and gets lower CTR. Real screenshots, real faces, and a single clear claim outperform polished brand assets.
- Match format to objective. Running Video against a lead-gen benchmark, or Single Image for awareness, guarantees a disappointing number. Pick the format the goal actually calls for.
- Test Thought Leader Ads. At a 2.68% median, a TLA from a willing executive is the fastest CTR upgrade available, if you can supply the content.
- Layer in retargeting. Warm audiences click 2 to 3 times more often than cold ones. A small website-retargeting pool will lift blended CTR quickly.
- Refresh creative every two weeks. By the third week on the same audience, CTR collapses from fatigue. Rotate three to five variants on a 14-day cadence.
PRO TIP
Run single-format, single-audience, 14-day tests instead of launching four formats at half-budget. One clean variable produces real signal; a four-format launch produces a dashboard nobody can read.
How we compiled these benchmarks
These benchmarks are triangulated from nine published 2026 LinkedIn ad datasets rather than lifted from any single page. The two largest first-party anchors are ZenABM (161,256 ads across 211 companies, $5.5M in spend, 29 countries) and HockeyStack (70+ B2B SaaS companies, $28M in spend, three years of data). Around those we cross-checked The B2B House, Digital Applied, Factors.ai, B2Linked, Chartis, Quimby Digital, and Total Product Marketing.
Three rules kept the numbers honest. First, every figure carries a named source and a year, and where publishers disagree we show the range instead of a single false-precise point. Second, each industry row is tagged “confirmed” only when two or more independent sources agree. Third, we left out anything we could not attribute, including unsourced forum anecdotes and a widely-repeated 0.14% to 2.02% “platform” range that one publisher only cites rather than measures. Benchmarks shift, so we refresh this page every 60 to 90 days; the figures above reflect data published through June 2026.
Frequently Asked Questions
For LinkedIn Sponsored Content, a good click-through rate is roughly 0.6% or higher, at the top of the typical 0.44% to 0.65% average band; 1% or more is strong, and below about 0.4% is poor (Factors.ai, Digital Applied, 2026). Message Ads and Thought Leader Ads run far higher and should be judged on their own format-specific benchmarks.
For Sponsored Content, yes. A 2% CTR is well above the 0.44% to 0.65% average and would be excellent (The B2B House, ZenABM, 2026). But context decides it: for Message or Conversation Ads (3% to 12%) or Thought Leader Ads (2.68% median), 2% is only average or below. Always benchmark against the specific ad format you ran.
The 5-3-2 rule is an organic content-mix guideline, not a paid-ads CTR metric. For every 10 posts, share 5 pieces of curated content from others, 3 of your own, and 2 personal posts, keeping self-promotion to about 30%. It shapes profile engagement, which can warm an audience before retargeting, but it does not set an ad benchmark.
The 5-5-5 rule is an organic engagement habit, not an ad metric: spend about five minutes a day doing five small actions, such as commenting on five posts or engaging five people, to build steady visibility. Like the 5-3-2 rule, it is a personal-brand routine and has no bearing on your paid LinkedIn ad CTR.
Because CTR measures curiosity, not intent. ZenABM’s 2026 data found CTR negatively correlates with pipeline (rho = -0.170), so a catchy ad can win clicks from people who never buy. Switch the offer to something only a real prospect wants, use native Lead Gen Forms, and judge the campaign on cost per qualified lead instead.