

Search meeting no show rate and page one returns four different numbers: 20-40%, 10-30%, 10-25% and 6.5%. They are not competing estimates of the same thing. One counts conference rooms that stayed empty, one counts people who registered for an event and never turned up, one counts desks, and one counts prospects who skipped a booked sales demo.
Google’s AI Overview stacks them anyway. It opens with a single formula, then lists benchmarks for B2B sales meetings, free webinars and medical appointments underneath it, as though one denominator could serve all three.
None of those numbers is fabricated. They answer different questions. The problem is that a revenue team comparing its own attendance figure against “the industry benchmark” has no way to tell which question it just answered. This page separates the four metrics, files every published B2B figure under the population and denominator it actually measures, and gives you a reporting standard you can implement this quarter.
Direct answer — What is the meeting no-show rate?
The meeting no-show rate is the share of scheduled meetings where the required attendee did not join. Calculate it as attendee no-shows divided by attendance decisions, meaning held meetings plus attendee no-shows. Exclude cancelled, rescheduled, pending and invalid bookings from that denominator. Published B2B figures run from 6.5% to 28.1%, but they measure different populations and denominators, so they are not a range you can average.
Key Takeaways
- Four unrelated metrics rank for this one phrase. Room-occupancy no-shows (20-40%), event-registration no-shows (10-30%) and sales-meeting no-shows (6.5-28.1%) share a name and nothing else.
- The denominator moves the headline more than behaviour does. The same 60 no-shows read as 6.00% or 8.82% depending on which records you divide by.
- RevenueHero publishes 6.5%, 13.5% and “20-40%” across three of its own pages. Each is defensible in context; none is a market benchmark.
- Pending meetings quietly deflate live dashboards. In RevenueHero’s one-week snapshot, 17.33% of meetings had no final outcome yet.
- Show rate is not 1 minus no-show rate unless cancelled, rescheduled, pending and unverified records are already excluded.
- Reminder evidence is strong in healthcare and thin in B2B. Cochrane found a risk ratio of 1.14 for SMS reminders; no equivalent B2B trial exists.
What a meeting no-show rate measures
A meeting no-show is a valid, uncancelled meeting whose scheduled start has passed, where the host was available and the required external attendee never joined. Every word in that sentence is doing work. Strip any of it out and you get a different metric.
The formula most pages publish divides no-shows by total scheduled meetings. That version is easy to compute and wrong in a specific way: “total scheduled” includes meetings that were cancelled with three days’ notice, meetings that were moved to next Tuesday, and meetings that have not happened yet.
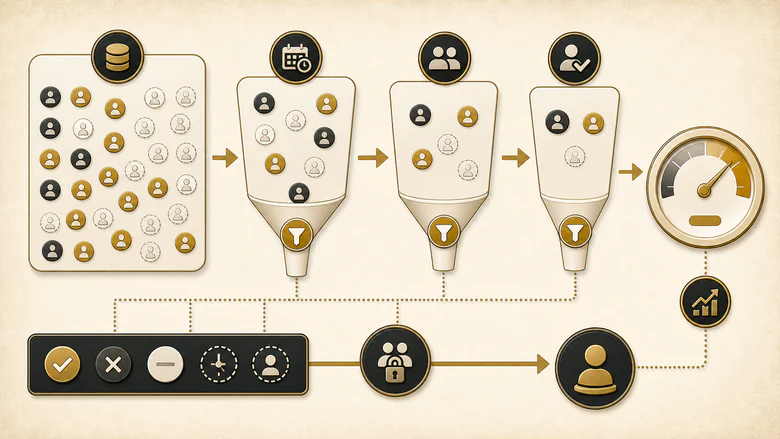
Attendee no-show rate = Attendee no-shows ÷ (Held meetings + Attendee no-shows)The denominator is deliberately narrow. It contains only meetings that reached an actual attendance decision. A prospect who cancelled made a decision, but not an attendance one, and a meeting still sitting in next week’s calendar has made no decision at all. Both belong in their own rates, reported beside this one rather than folded into it.
This distinction is the same one that separates a booked meeting from a held meeting in the stage definitions most funnel models gloss over. Booked is a scheduling event. Held is an outcome, and only outcomes belong in an attendance rate.
Four different metrics rank for this one phrase
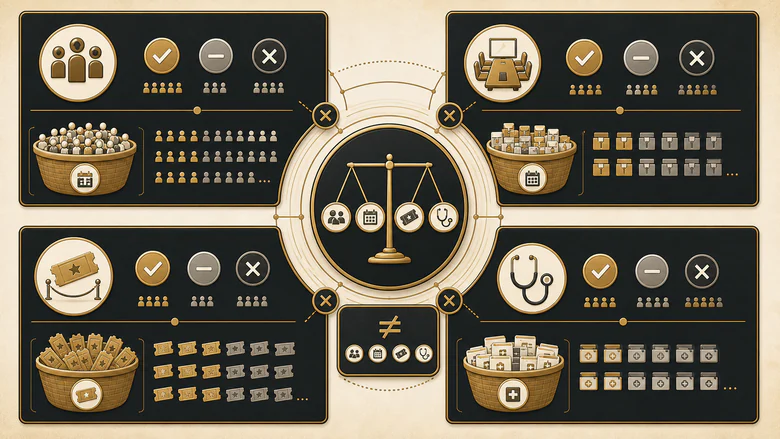
Before comparing your number to anything, check which of these four things the source was counting. All four rank on page one for the same query, and only one of them is about sales meetings.
| What is counted | Denominator | Published figure | Source |
|---|---|---|---|
| Prospect skips a booked sales meeting or demo | Booked meetings, or attendance decisions | 6.5% to 28.1%, source-specific | RevenueHero, Reply.io, Salescadia |
| Booked meeting room stays empty | Room bookings with no detected occupancy | 20-40% without check-in policies | Mapiq, March 2026 |
| Booked workplace room or desk stays empty | Room and desk bookings | 10-25% in many workplaces | Vantage Space |
| Registrant does not attend an event | Event registrations | 10-30%, varies by event type | Getmobly |
| Patient misses a healthcare appointment | Scheduled appointments | 5-15%, cited in AI Overview | Healthcare literature |
Notice that Mapiq’s workplace figure and RevenueHero’s sales-meeting glossary figure are both “20-40%”. Two unrelated phenomena, measured by different instruments, arriving at the same printed range. One is derived from occupancy sensors detecting whether anyone walked into a room. The other describes prospects declining to attend software demos.
IMPORTANT
Room-occupancy no-shows are measured by sensors, not by people. If your source mentions check-in policies, auto-release or desk booking, it is measuring facilities utilisation and cannot be compared with a sales attendance rate.
The event-registration denominator is the one that catches B2B teams most often, because registration-to-attendance is a real metric they also track. It is just a different one. A webinar registrant who never joins was never a booked meeting with a named owner and a scheduled slot, and pooling the two produces a number that describes neither.
What the published B2B numbers actually say
Restricting the field to B2B sales meetings leaves four quantitative public sources worth citing. Here they are with the details that determine whether they apply to you.
| Source | Date | Sample | Population | Reported figure | Denominator | Outcome maturity |
|---|---|---|---|---|---|---|
| RevenueHero benchmark | Dec 2024 | n = 6,428 | Vendor customer meetings, 15 industry labels | 6.5% (419 / 6,428) | All meetings in a one-week window | Immature; future meetings acknowledged |
| RevenueHero analysis | Aug 2025 | n not disclosed | Customers booking 50+ meetings per month | Median 13.5%, mean 15.9% | Not defined | Not disclosed |
| Reply.io demo analysis | Aug 2023 | n = 2,900 | Reply.io’s own inbound demos | 13.3% overall | Booked meetings | Not disclosed |
| Salescadia / MedLeague | Mar 2026 | n = 2,420 | One five-rep team selling MCAT test prep | 28.1% (679 / 2,420) | Tracked meetings | 12-month reconciliation |
Four sources, four populations, four denominators. Not one of them discloses how it treated both cancellations and reschedules. That is zero out of four for the single methodological detail that determines whether two attendance rates can be compared at all.
The Salescadia figure deserves its caveat up front: MedLeague sells MCAT test preparation to individual students. It is a careful piece of analysis and a poor B2B benchmark, because the buyer is a consumer and the purchase is personal. Its 28.1% is the top of the “range” people quote, and it is not measuring B2B software buyers at all.
One vendor, three numbers
RevenueHero is the most-cited source in this SERP and the most transparent one in the set, which is exactly why its three published figures are worth tracing.
- 6.5% in the December 2024 benchmark report, from 419 no-shows across 6,428 meetings in a single week.
- 13.5% median (15.9% mean) in the August 2025 analysis, across 18 weeks of customers booking 50 or more meetings a month.
- “20-40 percent” in its September 2025 glossary page, presented as industry averages with no sample, source or method attached.
A roughly sixfold spread inside one brand. Each figure is defensible where it sits: the first is a one-week operational snapshot, the second is a cohort median with a stated inclusion rule, the third is an unsourced summary. The trouble starts when they leave home.
Google’s AI Overview for this query currently reports “B2B SaaS medians at 13.5% and top-performing teams achieving under 5.5%”, crediting a third-party page. Those are RevenueHero’s August 2025 cohort median and its top-decile figure. A vendor’s customer cohort became a repeater’s blog post, and the repeater became the AI Overview’s evidence for a “B2B SaaS” benchmark. No step in that chain is dishonest. The population boundary simply falls off at each hop.
This is the same provenance decay that turns a single vendor dataset into an apparent consensus across the lead-to-meeting benchmark literature, where one number gets cited so widely it reads as replication.
The booking-delay gradient
The most useful B2B finding in the public record is not a headline rate. Reply.io analysed 2,900 of its own booked demos and reported no-show rates by how far ahead the meeting was scheduled: 6.9% for same-day meetings, 9.6% for next-day, and 23.0% for meetings booked eight or more days out.
That gradient is a within-source comparison, which is what makes it usable. The same team, the same logging rules, the same definition of a skipped meeting, varying only by delay. It is observational, so it shows association rather than cause. Faster-booking prospects may simply be more motivated. But it is the cleanest B2B signal available, and it points the same direction as the healthcare literature.
What the one-team cases can and cannot tell you
Beyond those four, the public record thins into vendor case studies without samples: a phone-booked show rate of 50% against a stated 95% baseline, a customer story reporting a move from 20% to 10%, a six-month video test described as a “15% reduction” without stating whether that is absolute or relative. Each is a plausible operational story. None discloses enough to reuse as evidence, and the same disclosure problem runs through demo-funnel benchmarks generally.
How the denominator changes the headline
Here is why two teams with identical behaviour can report different rates. Take 1,000 scheduler records containing 20 invalid entries, 150 meetings still in the future, 80 cancellations, 70 rescheduled originals, 620 held meetings and 60 attendee no-shows. The numerator never moves.
| Denominator | Calculation | Reported rate | What it includes |
|---|---|---|---|
| All records | 60 ÷ 1,000 | 6.00% | Invalid and pending records |
| Valid bookings | 60 ÷ 980 | 6.12% | Still contains pending meetings |
| Eligible past valid | 60 ÷ 830 | 7.23% | Includes cancellations and reschedules |
| Attendance decisions | 60 ÷ 680 | 8.82% | Held plus attendee no-shows only |
A 47% relative difference between the loosest and tightest denominator, with not one meeting behaving differently. This is an IVRIS illustration built from invented counts, so the arithmetic is reproducible and no external population is being represented. The point is the spread, not the numbers.
Invalid records matter more than they look. Duplicate bookings, internal test meetings and malformed contacts sit in most schedulers, and they inflate the denominator while never being capable of producing an attendance outcome. Removing them is the same hygiene step as validating a lead before it enters any conversion calculation.
Duplicates are usually an integration artefact rather than user error. When a scheduler and a CRM both create records, or a reschedule arrives as a cancel event followed by a create event, one meeting can land as two rows. That is the same class of silent field-mapping failure that strips UTM data out of form submissions, and it fails without an error either time.
Pending meetings deflate live dashboards
The clearest public example comes from RevenueHero’s own December 2024 report, which states plainly that “some meetings that are still scheduled and set to happen in the future” were in the dataset.
The report gives 6,428 meetings, 4,895 completed and 419 no-shows. Subtracting leaves 1,114 records, or 17.33% of the sample, with no final attendance outcome. Divide the same 419 no-shows by the 5,314 meetings that did reach an outcome and the rate reads 7.88% rather than 6.52%.
IMPORTANT
That 7.88% is not a corrected RevenueHero benchmark. The 1,114 residual records may contain future, cancelled, rescheduled or simply unclassified meetings, and IVRIS has no visibility into the mix. It is an illustration of denominator sensitivity, not a restatement of anyone’s finding.
The operational lesson survives regardless of what those 1,114 records were. Any dashboard reading a live scheduler will include meetings that have not happened, and the shorter the reporting window, the larger that share becomes. A one-week view is mostly future.
Why show rate rarely equals 1 minus no-show rate
Almost every page states this identity and almost none states its condition. Show rate is the complement of no-show rate only when the denominator contains exactly two possible outcomes.
Held rate = Held meetings ÷ (Held meetings + Attendee no-shows)Once cancelled, rescheduled, pending, host-failed or unverified records are in the denominator, the two rates stop summing to 100% and the gap is silently absorbed. Teams then reconcile two dashboards that disagree by several points and conclude one system is broken, when both are correct about different questions.
Host failure deserves its own line. When the rep does not show, the meeting did not happen, but classifying that as an attendee no-show blames the buyer for an internal miss and quietly suppresses a real operational problem. Keep it separate and report it. The same applies to unverified records: a past meeting with missing or conflicting evidence is a data-quality item, not an attendance outcome, and forcing it into either bucket corrupts both.
Outcome completeness is the companion metric that keeps the headline honest. A team can lower its no-show rate by leaving hard records unclassified, by moving silent absences into cancellations, or by excluding difficult segments. Reporting the share of eligible meetings that reached any classification at all removes that incentive, which is why it belongs on the dashboard next to the rate rather than buried in a quarterly metrics review.
A reporting standard you can implement
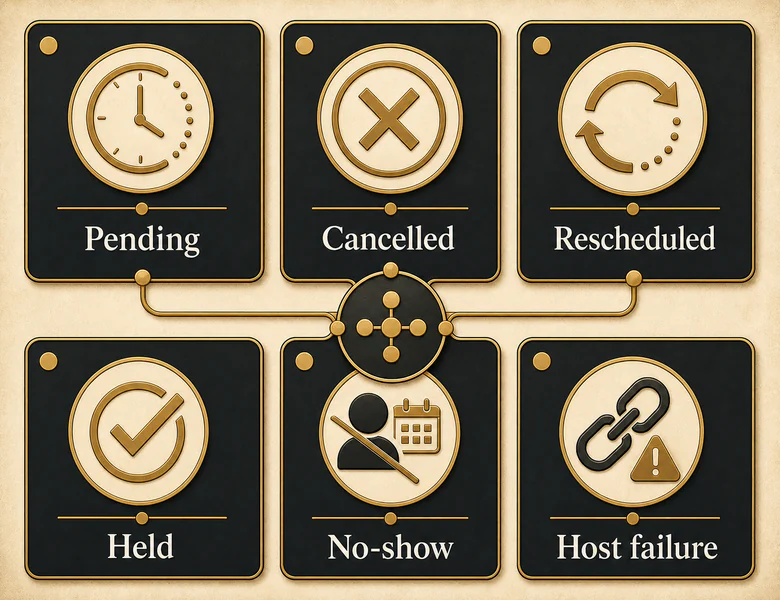
These are the states a meeting record can occupy. The definitions are IVRIS operating conventions, built from the taxonomies that HubSpot, Calendly and Google Calendar already expose. They are not a vendor standard.
| Status | Definition | Where it belongs | Never |
|---|---|---|---|
| Booked | Valid meeting created with a scheduled start and a reachable required attendee | Valid-booking cohort | Not yet an attendance outcome |
| Invalid | Duplicate, test, spam, internal-only or out-of-scope record | Booking-quality reporting | Any attendance denominator |
| Pending | Scheduled start plus grace period has not elapsed, or outcome unverified | Pending rate and cohort maturity | A completed-outcome denominator |
| Declined | Required invitee answered “No” before the start | Pre-meeting response reporting | Counted as a no-show |
| Cancelled | Explicitly cancelled before start, not replaced by a linked occurrence | Cancellation rate | Attendance-decision denominator |
| Rescheduled | Moved or replaced by a new linked occurrence, lineage preserved | Reschedule rate; judge the replacement | The original counted as a no-show |
| Held | Required attendee participated past your minimum threshold, host available | Held-rate numerator | Inferred from calendar acceptance alone |
| Attendee no-show | Start plus grace elapsed, meeting valid and live, host ready, attendee absent | No-show numerator | Used for host failure or unverified records |
| Host failure | Host did not make an eligible meeting available | Separate operational metric | Charged against the buyer |
| Unverified | Past and eligible, but outcome evidence missing or conflicting | Data-quality queue | Forced into held or no-show |
An accepted calendar invite is not attendance. RSVP states answer what the invitee intended beforehand; attendance answers what happened at the scheduled time. Calendly makes this explicit at the product level, since its no-show button only becomes available after the scheduled start has passed.
Workflow · 20 min
How to calculate your attendee no-show rate
Produces a no-show rate that can be compared against a published benchmark, provided the benchmark discloses the same denominator.
Export every meeting record for one closed period
Pull from the scheduler, not the CRM, and include created timestamp, scheduled start, status and outcome. Pick a period that ended at least two weeks ago.
Remove invalid records
Delete duplicates, internal test meetings, spam bookings and anything outside the reporting scope. Count what you removed and report it separately as booking-quality leakage.
Apply a grace period and drop pending meetings
Set a fixed grace threshold, 15 minutes past scheduled start is a common choice, and exclude any meeting whose start plus grace has not elapsed.
Move cancellations and reschedules to their own rates
Pull out explicitly cancelled meetings and rescheduled originals. Evaluate each replacement meeting on its own outcome and keep the link back to the original.
Separate host failures and unverified records
Check join logs or call dispositions. Where the host never made the meeting available, classify it as host failure. Where evidence is missing or contradictory, send it to a data-quality queue.
Divide no-shows by attendance decisions
Divide attendee no-shows by held meetings plus attendee no-shows. Publish the outcome-completeness percentage beside it so anyone reading the rate can see how much was classified.
The step teams skip most often is the third one. Without a fixed grace threshold, “did they show up?” gets answered differently depending on who is looking, and a prospect who joined eleven minutes late counts as held on one dashboard and missed on another. Write the threshold down, apply it everywhere, and state it whenever you publish the rate.
How to check whether a benchmark applies to you
Run any published figure through these nine checks before comparing it with your own. If tests 4 through 7 cannot be answered from the source, do not compare, and do not average it with anything.
- Population. B2B sales meetings, or healthcare, recruiting, education or consumer appointments?
- Meeting type. Discovery, demo, qualification, onboarding or success review?
- Cohort rule. Meetings grouped by when they were booked, or by when they were scheduled to start?
- Outcome maturity. Had every meeting passed its start plus grace and verification cutoff?
- No-show definition. Attendee absence, missed without notice, late cancellation, or all non-attendance combined?
- Cancellation and reschedule treatment. Stated explicitly, and handled the same way as yours?
- Denominator. All bookings, eligible past meetings, confirmed meetings, or attendance decisions?
- Statistic type. Weighted mean, company mean, median or raw cohort rate?
- Source mix. Inbound, outbound, phone-booked, self-scheduled or event leads, and is it stratified?
Two rules follow from this. Never average a mean with a median, and never treat repeated citations of one dataset as independent confirmation. Most apparent agreement in this topic traces back to a small number of original sources being quoted by pages that did not run the analysis.
Test 9 catches the comparison teams get wrong most often. Inbound hand-raisers and cold-outbound bookings produce different attendance rates for reasons that have nothing to do with reminder quality, in the same way a marketing-qualified lead and a sales-qualified lead describe different commitments rather than different amounts of the same thing.
What the evidence supports about reducing no-shows
Tactical advice on this topic runs well ahead of the evidence. Here is what the public record actually grades out at.
| Lever | B2B evidence | Contextual evidence | Grade | Safe reading |
|---|---|---|---|---|
| Shorter booking-to-meeting delay | Reply.io: 6.9% same-day, 9.6% next-day, 23.0% at 8+ days across 2,900 demos | Repeated healthcare association, including a 51,529-appointment clinic study | B | Strong directional association; no causal B2B percentage established |
| SMS and phone reminders | Weak or undisclosed | Cochrane: 8 RCTs, 6,615 participants, RR 1.14 (95% CI 1.03-1.26), moderate certainty | B in context | Sensible practice; the B2B effect size is unknown |
| Personalised pre-meeting video | One six-month split test, “15% reduction”, basis not stated | None | C | A case example, not a transferable effect |
| Instant scheduling and handoff | Customer story reporting 20% to 10% alongside other changes | None | C | Before-and-after with major confounding |
| Booking method and lead source | 50% show for phone-booked versus a 95% baseline, no sample | None | D | Segment and investigate; do not infer channel quality |
| Qualification depth | Named as a strong model signal, no effect size published | None | D | A plausible confounder worth segmenting by |
| Time-zone clarity | No method-complete public estimate located | None | D | Implement as hygiene; the evidence gap is real |
| Low-friction rescheduling | No controlled public B2B evidence located | None | E | Measure as a separate reschedule rate and test it |
The Cochrane review is the only Grade A-adjacent evidence anywhere near this topic, and it is healthcare. Eight randomised trials covering 6,615 participants found SMS reminders lifted attendance from 67.8% to 78.6%, a risk ratio of 1.14. That is a real result about patients attending clinics. It is not a licence to promise a B2B percentage, and any page quoting it as one has crossed a population boundary without saying so.
PRO TIP
Segment your own no-show rate by booking delay before buying anything to fix it. If your gradient looks like Reply.io’s, the cheapest intervention available is shortening time-to-meeting, which is a routing and availability problem rather than a reminder problem.
That routing angle is usually where the real gain sits. Compressing the gap between a request and a booked slot depends on how fast the response chain actually moves, and the levers there are measurable in a way that reminder cadence is not. Once attendance is being measured cleanly, the stage-by-stage diagnosis of where demos are lost becomes tractable, because you finally know which stage the loss belongs to.
One warning on targets. A falling no-show rate is not self-validating. It can fall because attendance improved, or because difficult prospects stopped being booked, or because unresolved records stopped being classified. Report booking volume, cancellation rate, reschedule rate and outcome completeness alongside it, or the number becomes a measure of reporting discipline rather than buyer behaviour.

Method, sources and revision history
Evidence for this page was collected in July 2026 from public sources only. IVRIS did not run any of the underlying studies, and each organisation retains ownership of its own research and statistics. Figures were taken from original reports and product documentation rather than from pages summarising them.
Sources were included when the publisher disclosed enough to place the figure: a sample, a population, a data period or a stated metric definition. Pages quoting precise ranges without any traceable original were recorded as exclusions rather than inputs, which is why several widely-repeated percentages do not appear above.
Two figures on this page are IVRIS calculations rather than reported findings, and both are labelled where they appear: the four-denominator illustration, built from invented counts, and the pending-meeting residual derived by subtracting RevenueHero’s published completed and no-show counts from its published total. The status definitions are IVRIS operating conventions built on top of published product taxonomies, not an industry standard.
Last reviewed: July 2026. Revision history: first published July 2026. Suggested citation: IVRIS Tech, “Meeting No-Show Rate: Benchmarks and Denominator Rules”, July 2026.
This page is reviewed quarterly against the live SERP, semiannually against its source ledger, and immediately if a source corrects or withdraws a figure, or if HubSpot, Calendly or Google Calendar change their attendance-status semantics. Corrections and additional public datasets are welcome.
Frequently Asked Questions
Divide attendee no-shows by attendance decisions, which means held meetings plus attendee no-shows. Exclude cancelled, rescheduled, pending and invalid records first. Dividing by all scheduled appointments instead is the most common error, because it mixes meetings that never reached an attendance outcome into the denominator.
There is no defensible average. Public B2B figures run from 6.5% to 28.1%, but they measure different populations, denominators and time windows, so averaging them produces a number describing no real group. Compare within a single disclosed source instead, and check its denominator before using it.
Event no-show rates are commonly quoted at 10-30%, and free webinars run considerably higher. That metric divides absentees by registrations, not by booked meetings, so it cannot be compared with a sales-meeting no-show rate. Registration is a much lower-commitment act than accepting a scheduled slot.
No. A cancellation is an explicit decision made before the meeting, and a no-show is an absence at the scheduled time. Report cancellation rate separately against eligible past meetings. If you count late cancellations as no-shows, state that rule openly, because it makes your figure incomparable with sources that do not.
No. Mark the original as rescheduled, preserve the link between it and its replacement, and judge attendance on the replacement meeting. Counting the original as a no-show double-penalises a prospect who rearranged in good faith, and inflates your rate against any source that handles reschedules properly.
No. An RSVP records intent before the meeting; attendance records what happened at the scheduled time. An accepted invite can still become held, no-show, cancelled or rescheduled. Verify attendance from join logs or call dispositions, and treat records with missing evidence as unverified rather than assuming either outcome.