
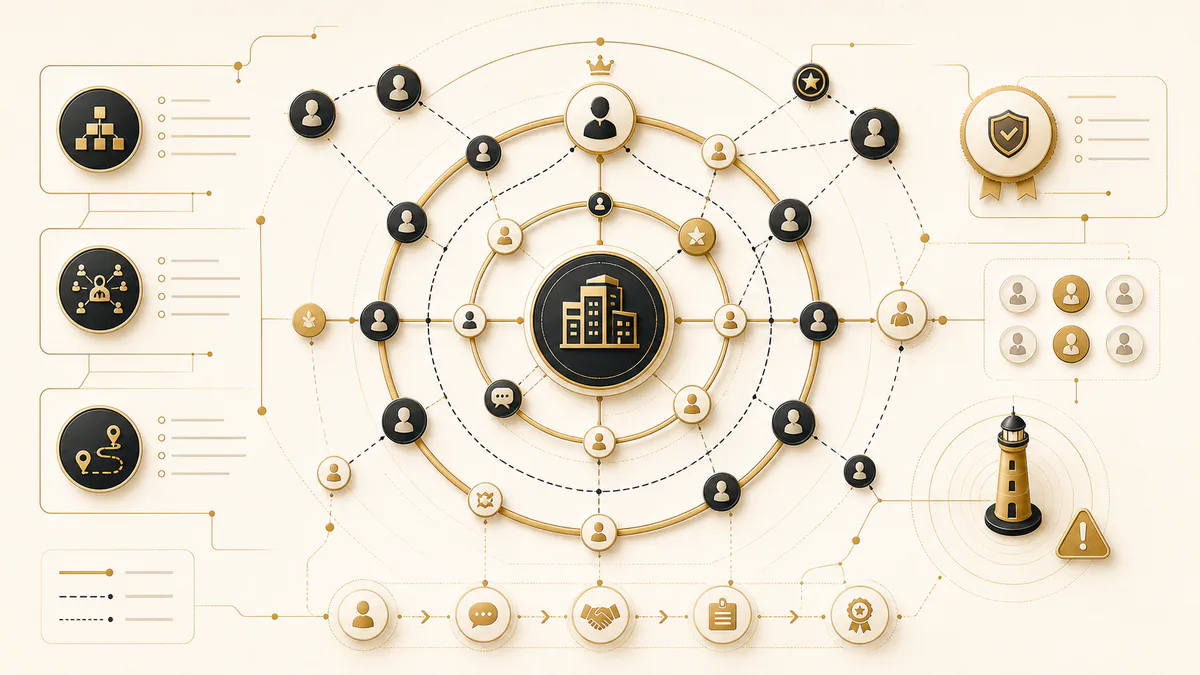
Most relationship maps in B2B sales fail the same quiet way. The diagram looks finished. Every box carries a name, a title and a colour. But nobody on the account team can say when the green box was last verified, who decided it was green, or what would have to happen for it to turn amber.
That gap matters more than the diagram. A map is a claim about an account: who can shape this decision, who your team can actually reach, and how much of that you can prove. Most tools record the first two as opinions and never record the third at all.
This page sets out a method for building a relationship map that survives being questioned. It separates access from influence, treats evidence confidence as a field rather than a feeling, and turns single-thread risk into a number you can calculate. Every formula here is reproducible, and none of it predicts whether you will win.
Direct answer — What is relationship mapping in sales?
Relationship mapping in sales is the practice of modelling the people involved in a specific buying decision, the formal and informal connections between them, and the selling team’s access to each person. Unlike an org chart or a contact list, a useful relationship map separates buying influence from seller access, and records the evidence, date and confidence behind every relationship claim it makes.
Key Takeaways
- Access and influence are different measurements. Frequent contact with a cooperative user proves neither authority nor sway.
- CRM activity data shows frequency and recency. It does not show trust, support or influence, and platform vendors say so in their own documentation.
- Single-thread risk is concentration, not headcount. Four mapped contacts can carry the dependency of roughly two.
- Evidence confidence belongs on the map as a field. Unknown must stay unknown rather than defaulting to neutral or zero.
- No public study shows that using a relationship map causes higher win rates. Maps reveal gaps and trigger actions; that is the defensible claim.
What a relationship map is in B2B sales
A relationship map is a decision-scoped model of the stakeholders in an account, the connections between them, and the routes your team has to each one. The phrase “decision-scoped” carries most of the weight. The same person can hold different influence over a security review, a renewal and an expansion, so a map built for one decision does not automatically describe another.
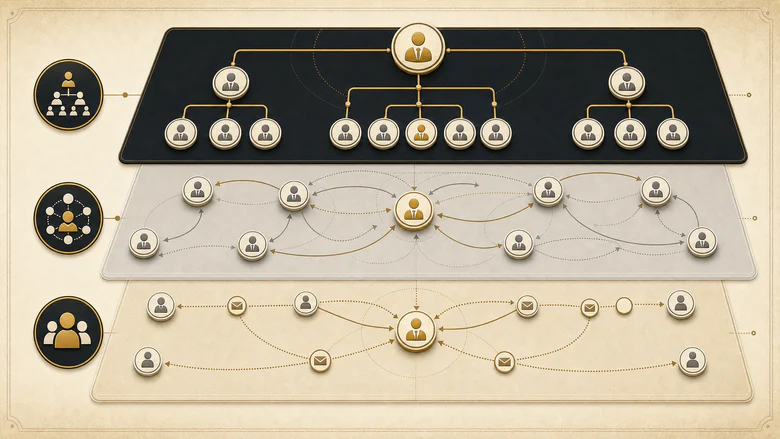
Three separate networks sit underneath a single map, and confusing them is the most common structural error. The first is formal structure: who reports to whom. The second is decision participation: who is actually involved in this purchase, which is what a B2B buying committee describes. The third is seller access: which of your people can reach which of theirs, through what channel, and how recently.
What a map can establish is coverage, dependency and staleness. What it cannot establish is value, competitive position, budget reality or forecast probability. A complete-looking map on a deal with no business case is still a deal with no business case.
Relationship map vs org chart, contact-role list and buying-committee map
An org chart records reporting lines, a contact-role list records deal association, a buying-committee map records decision participation, and a relationship map records all three plus the evidence behind them. The four are routinely used as synonyms, which is why teams end up believing they have a map when they have a list of names. Keeping them apart is a modelling problem before it is a discipline problem, and the fix is to give each of those four records a distinct home in the data model so that role, evidence and engagement stop competing for the same field.
| Artefact | What it records | What it omits | Use it when |
|---|---|---|---|
| Org chart | Official reporting structure and formal titles | Informal influence, seller access, evidence, dates | You need to understand formal authority and escalation paths |
| Opportunity contact-role list | Contacts attached to a deal, each with a declared role. Salesforce defines these as specifying “the part that each contact plays in a deal” | Connections between people, access quality, confidence | You need CRM hygiene and reporting on who is attached to what |
| Buying-committee map | Who participates in a defined decision and the role each plays | Relationship edges, access routes, concentration risk | You need to know whether every required role is represented |
| Relationship map | Stakeholders, formal and informal edges, seller access routes, dated evidence and confidence | Deal value, competitive position, win probability | You need to find access gaps, stale routes and dependency |
The practical test is whether the artefact can answer “how do we know?” An org chart cannot be wrong about a reporting line without someone changing jobs. A relationship map can be wrong about influence the moment a project reorganises, and it has no way to tell you unless it stores when each claim was last checked.
The four distinctions that decide whether a map is useful
Four pairs of concepts get collapsed in almost every relationship-mapping guide, and each collapse produces a specific, predictable error in the field. Keeping them apart is the difference between a map that changes what your team does and a picture that makes everyone feel prepared.
| Commonly merged | Why they are different | The error it produces | What to record instead |
|---|---|---|---|
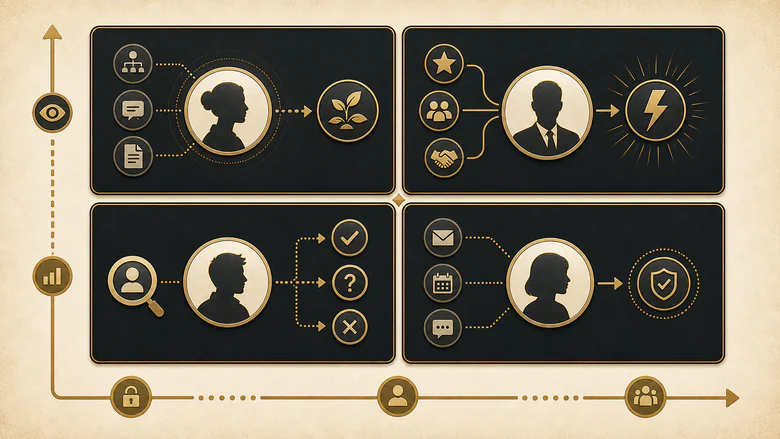
| Access and influence | Access is your ability to reach someone. Influence is their ability to shape the decision. | The most responsive contact is treated as the most important one | Two separate scores, never averaged into one |
| Influence and authority | Authority is the formal right to approve or veto. Influence is observed sway, which can sit anywhere. | Title is read as power; a quiet architect who rewrites the requirements is missed | Formal authority and observed sway as separate criteria |
| Activity and relationship strength | Activity counts messages. Strength involves reciprocity, depth and durability. | A high email count is mistaken for a working relationship | Reciprocity and route resilience alongside frequency |
| Observed stance and fact | A stance is a dated observation about one issue. A label is a permanent judgment. | Someone becomes “a blocker” forever on the basis of one meeting | The observation, its date, the issue, and a confidence level |
The activity distinction has the strongest evidence behind it, and it comes from the platform vendors themselves. Microsoft’s documentation for Dynamics 365 Sales states that its relationship health score is produced by “weighting relevant activities by type,” normalised to a 0 to 100 range with bands of good at 60 to 100, fair at 40 to 59 and poor at 0 to 39. Administrators can change how much any activity type contributes, by up to 50 percent, and set how often the organisation expects sellers to contact a customer.
Two further details in that documentation deserve to be better known. Email duration is not measured; it is estimated at 2.5 minutes to read and 5 minutes to write. Appointment time is multiplied by the number of your team members present. Neither is a flaw. They are reasonable engineering choices, openly documented. But they mean a relationship health score is a local configuration carrying disclosed assumptions, not a measurement that can be compared between two companies.
IMPORTANT
Microsoft’s own FAQ is explicit that the “Who Knows Whom” feature uses only interaction frequency in its basic tier, and frequency plus recency in its enhanced tier. Frequency and recency are evidence of contact. Treating either as evidence of trust is a category error, not a shortcut.
The data model behind a map that survives scrutiny
To record evidence properly, a relationship map needs eight entities rather than the two most tools provide. People and links alone cannot express “we think Priya reports to Marcus, one person told us in March, and nobody has checked since.”
| Entity | Minimum fields | Why it exists |
|---|---|---|
| Account | ID, name, segment, owner, review date | Shared scope across the team |
| Decision or initiative | ID, type, stage, date, required roles | Makes influence decision-specific rather than permanent |
| Stakeholder | Identity, title, function, unit, employment-verification date | Separates the person from a temporary role |
| Decision-role assignment | Role, participation, authority, dates, evidence | Allows multiple and changing roles per person |
| Formal reporting edge | Direction, source, verification date, confidence | Official hierarchy, with provenance |
| Informal influence edge | From, to, type, decision scope, evidence, date, confidence | Observed decision shaping that no org chart shows |
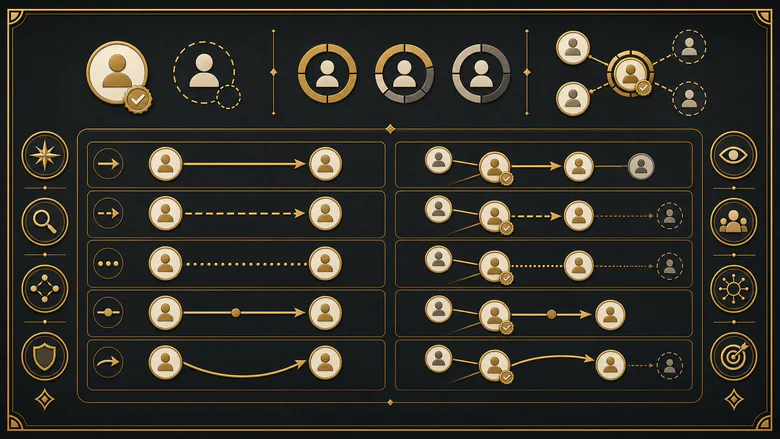
| Seller-stakeholder edge | Owner, direct or brokered, channel, last interaction, reciprocity, resilience | Your team’s actual access, which is not a property of the buyer |
| Evidence event | Date, source, observation, recorder, corroboration, review date | Stops labels detaching from the thing that produced them |
The evidence-event entity is the one teams skip and the one that makes the rest work. Without it, every score is an opinion with a number attached. It also exposes a coverage problem most CRMs hide: Clari, analysing nearly 300 million emails and 40 million meetings, reported that on average 50 to 70 percent of the people reps communicate with do not exist as contacts in CRM. That figure is a vendor analysis from 2019 with no disclosed organisation count, so treat it as an illustration of a known gap rather than a benchmark. Closing that gap is partly a data enrichment and capture problem, not only a mapping one.
How to score access, influence and evidence confidence
Score three axes separately, using observable anchors, and never merge them into a single number that hides which one is weak. Access, influence and evidence confidence fail independently, and a combined score conceals exactly the failure you need to see.
Each dimension below is scored 0 to 4. Blank means unknown, and unknown must stay blank rather than becoming zero. A zero means you have evidence of absence or contradiction; a blank means you have not looked.
| Axis | Dimension | Score 0 | Score 2 | Score 4 | Never infer from |
|---|---|---|---|---|---|
| Access | Access state | No known route, or route closed | Direct route exists but interaction is limited | Multiple reliable routes or self-initiated access | Friendliness or job title |
| Exchange depth | No exchange | Relevant information exchanged | Mutual planning, sensitive constraints, coordinated action | Message volume | |
| Reciprocity | One-way pursuit, or explicit rejection | Responds and shares limited information | Repeatedly initiates, reciprocates and follows through | Politeness | |
| Route resilience | No viable route | One stable route | Multiple independent routes across functions or levels | Number of contacts | |
| Influence | Formal authority | No authority in this decision | Owns a relevant workstream | Final or delegated decision authority | Seniority alone |
| Decision participation | Not participating | Participates in one stage | Core member shaping the end-to-end decision | Attendance on an invite | |
| Gate or resource control | No control observed | Controls one useful resource or route | Can materially unblock or halt progress | Department name | |
| Internal connectivity | No verified internal links | Two verified relevant links | Central broker across functions and levels | Org-chart position | |
| Observed sway | No observed sway, or contrary evidence | Input changes a local discussion | Repeatedly changes major choices or coalition behaviour | Confidence of delivery | |
| Evidence confidence | Source quality | Anonymous, speculative or contradicted | Single plausible internal observation | Direct record plus independent verification | How much you like the answer |
| Specificity | Vague label only | Specific claim without context | Actor, action, context, date and consequence | Sentiment adjectives | |
| Corroboration | Contradicted | One source | Multiple independent sources or direct records | Repeated copies of one source | |
| Identity and role verification | Known false, or person departed | Identity known, role stale or partial | Role plus decision participation verified | An old signature block | |
| Edge verification | Known false or contradicted | Reported by one source | Observed repeatedly, direction verified | An org-chart line |
Average the dimensions within each axis and multiply by 25 to produce a 0 to 100 score. Equal weights are a transparent default rather than a validated optimum, and any team that changes them should record the change and the date.
One adjustment matters more than the weights: evidence decays. Apply a freshness factor to the access score, using a half-life your organisation picks and publishes.
F = 2 ^ (−days since last meaningful interaction ÷ half-life in days)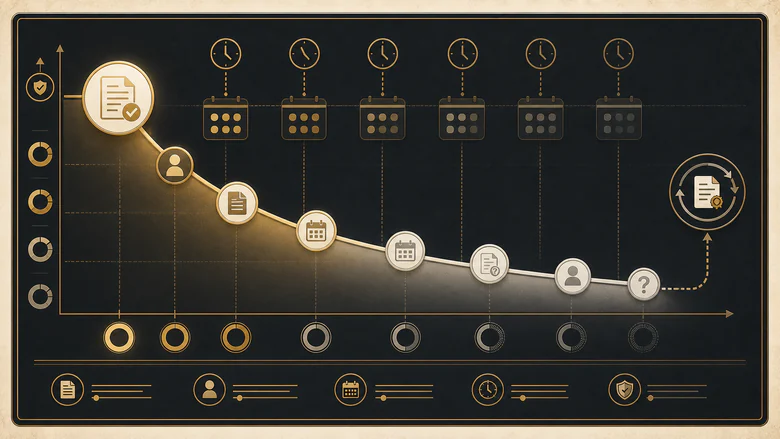
A 45-day half-life is a reasonable starting point for an active enterprise cycle, and the worksheet lets you set anything from 14 to 120 days. No public evidence supports a universal half-life, so the number is a setting to calibrate, not a benchmark to adopt. A “meaningful interaction” excludes automated opens, generic marketing sends and unanswered outbound.
PRO TIP
Run the freshness factor before your next pipeline review rather than during it. A relationship scored 4 on access six months ago and never revisited will drop below half its original weight, and that drop is usually the most useful thing on the page.
How to measure coverage and concentration risk
Concentration risk is the share of your total verified relationship capacity that sits with one person. Counting contacts does not measure it, because several contacts can represent one route, one function, or one seller’s personal rapport.
Start by combining the three axes into a single capacity value per stakeholder. Multiplication is deliberate: high access cannot compensate for no influence, and apparent influence cannot compensate for weak evidence.
v = (Access ÷ 100) × (Influence ÷ 100) × (Evidence confidence ÷ 100)p = v ÷ ΣvThe concentration index adapts the sum-of-squared-shares form used in competition analysis, where the Herfindahl-Hirschman Index is calculated by squaring each share and summing the results. We borrow only the mathematics. Antitrust thresholds are not account thresholds and are not imported here.
RCI = Σ (p²)ERC = 1 ÷ RCISCD = max (p)A worked example
Take an account with four mapped contacts, each scored on the three axes.
| Stakeholder | Access | Influence | Evidence confidence | Capacity v | Share p |
|---|---|---|---|---|---|
| VP Engineering (champion) | 80 | 75 | 85 | 0.510 | 0.611 |
| Director of Operations | 60 | 40 | 70 | 0.168 | 0.201 |
| Procurement lead | 25 | 60 | 50 | 0.075 | 0.090 |
| Day-to-day end user | 90 | 15 | 60 | 0.081 | 0.097 |
| Total | 0.834 | 1.000 |
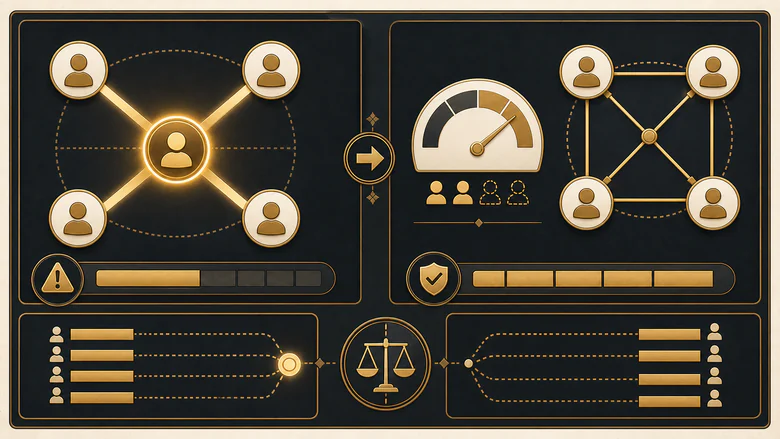
RCI is 0.611² + 0.201² + 0.090² + 0.097², which comes to 0.432. The Effective Relationship Count is 1 ÷ 0.432, or 2.3. Single-Contact Dependency is 0.61.
Four names sit on that map. The account behaves as though it has 2.3 relationships, and 61 percent of its verified capacity depends on one engineer. The end user, despite the highest access score of anyone, contributes under 10 percent because influence is low. That is the whole argument for scoring the axes separately, in one number.
| Single-Contact Dependency | Band | What it means | Action |
|---|---|---|---|
| 0.60 and above | Critical | One relationship carries most of the account | Open independent role-specific threads; assign seller-side backup |
| 0.45 to 0.59 | High | Heavy dependency with thin support | Verify route independence before the next decision gate |
| 0.30 to 0.44 | Moderate | Reasonable distribution, residual dependency | Maintain freshness; develop backup in the concentrated role |
| Below 0.30 | Distributed | No single contact dominates | Monitor change events; confirm role coverage separately |
These bands are operational defaults, configurable in the worksheet and versioned when you change them. No public dataset validates them for sales accounts, and any team publishing them as an industry benchmark would be inventing one. Low concentration also does not imply complete coverage: a well-distributed map can still be missing procurement entirely, which is why role coverage is measured separately and why the tactics in selling to a buying committee start with required roles rather than contact count.
What each map condition should trigger
Each combination of scores should produce a specific action, because a map that changes nothing about the account plan is decoration. The conditions below cover most of what a real account throws at a team.
| Map condition | Primary action | Do not infer |
|---|---|---|
| High influence, low access, high confidence | Build a connector, sponsor or peer route with a named introduction hypothesis | Do not raise forecast confidence because the person is now on the map |
| High access, low influence | Use for discovery and introductions; test whether they can mobilise others | Do not confuse responsiveness with decision power |
| High influence and access, low confidence | Reverify employment, role, participation and internal edges; seek corroboration | Treat the apparent strength as provisional until verified |
| High authority, resistant observed stance | Identify the exact criterion or risk driving it; bring the relevant specialist | Do not label a permanent blocker |
| Single-Contact Dependency at or above 0.60 | Open independent threads across distinct roles and functions; assign a second seller | More contacts on the same route do not reduce concentration |
| Strong day-to-day contact, missing critical role | Create role-specific access before the next decision gate | A champion cannot substitute for procurement or security |
| Many contacts, low reciprocity or stale evidence | Convert activity into mutual next steps; retire stale edges | Email volume alone is not coverage |
| Stakeholder leaves | Reverify structure; preserve context; identify replacement and adjacent routes | Do not transfer the old role or stance to the replacement |
| Team assessments conflict | Lower confidence, record dated evidence, resolve in account review | Do not average opinions into false precision |
After the sale, the map measures continuity
Post-sale mapping tracks three things a pre-sale map does not separate: day-to-day access, renewal authority and executive sponsorship. A team can have excellent daily contact with power users and no verified route to the person who signs the renewal, which reads as a healthy account right up until it does not.
| Lifecycle stage | The role that matters | The risk it carries |
|---|---|---|
| Onboarding | Implementation owner and daily users | Continuity is lost when the buying team hands over and never returns |
| Adoption | Internal advocates and connectors | Usage looks healthy while no one senior can describe the outcome |
| Expansion | Adjacent business-unit decision-makers | The existing champion has no authority outside their own function |
| Renewal | Economic approver and procurement | First contact with the approver happens during the renewal itself |
Treating these stages as distinct mapping problems rather than one long relationship is the same discipline that account-based experience applies to the wider lifecycle, and turnover is the reason it matters. Every departure invalidates a set of edges at once.
How to keep the map current
Update the map on events, not on a calendar alone. A quarterly review catches drift; an event trigger catches the change that actually invalidates a claim.
Workflow · 45 min
How to build a relationship map: six steps from blank sheet to actions
Produces a scored, evidence-backed relationship map for one decision, with concentration risk and role coverage calculated and each gap converted into an owned action.
Define the decision, then list stakeholders
Name the specific decision the map covers and its required roles. Enter every known or suspected participant, marking each as verified or hypothesised. Do not reuse a map built for a different decision.
Log the relationship edges
Record formal reporting lines, informal influence edges and your team’s access routes as three separate edge types. Give each a direction, a last-observed date and a confidence score.
Record evidence before scoring anything
Write the exact observation, its source, the observation date and who recorded it. Score nothing you cannot point at an evidence row for.
Score access, influence and confidence separately
Apply the 0 to 4 anchors to each dimension. Leave unknowns blank rather than entering zero. Set the freshness half-life for your sales motion before the scores are read.
Calculate concentration and role coverage
Read the Relationship Concentration Index, Effective Relationship Count and Single-Contact Dependency. Check each required role for at least one verified route.
Convert every gap into an owned action
Match each flagged condition to its action, assign an owner and a due date, and set the next review. A map with no actions attached has not finished being built.
The triggers that should force an update outside any review cycle: a stakeholder changes role or leaves, a new approver appears, an introduction succeeds or fails, a mutual commitment lapses, two team members record contradictory evidence, or a renewal window opens. Ownership matters as much as cadence, and putting a named owner on map maintenance is the same governance question that revenue operations answers for every other shared data object.
What the public evidence does and does not show
No public study demonstrates that using a relationship map causes higher win rates. The honest summary of the evidence is narrower and more useful than the claim most vendor pages make.
What the research does support is that decisions involve many people and that the count varies by how you measure it. Gartner, surveying 632 B2B buyers in August and September 2024, found buying groups ranging from five to 16 people across as many as four functions, with 74 percent showing unhealthy conflict and consensus-reaching groups 2.5 times more likely to report a high-quality deal. Forrester’s State of Business Buying, 2026, published in January 2026, describes 13 internal stakeholders and nine external influencers in a typical decision, with procurement acting as a decision-maker in 53 percent of cycles.
These figures are not interchangeable, and one source shows why with unusual clarity. Foundry’s Role & Influence of the Technology Decision-Maker reported an average of 28 people in its 2024 edition, up from 25 in 2023 and 20 in 2022, from 938 respondents across Foundry’s IT publications. Its 2025 edition reports 26. A single research programme, measuring consistently, has produced four different numbers in four years. Cite the edition, not the number. The full reconciliation of who counted what belongs in our B2B buying group statistics analysis, which compares the studies side by side.
Where vendor multithreading numbers stop being evidence
Vendor analyses of multithreading sit in a different evidence class again. UserGems reports that multithreaded opportunities showed a five-times higher win rate and 57 percent larger deals across more than 5,000 opportunities, with 70 percent of opportunities having a single point of contact. The direction is plausible and matches what account teams observe. But the cohort sizes, the absolute win rates, the data period and the definition of “multithreaded” are not disclosed, and opportunities that attract more stakeholders may simply be better opportunities. Use it as an illustration, never as a target.
The safe claims are these: a map can make assumptions, access gaps, missing roles and contact concentration visible; one-contact reliance creates continuity risk; CRM activity indicates frequency and recency and nothing more; and buying-group size varies by context, population and counting rule. Everything beyond that is currently unsupported.
Methodology, worksheet and how to cite this page
Every score on this page is a disclosed operational model rather than a validated instrument. The dimensions draw on published organisational-buying and social-network research; the specific weights, half-life and risk bands are IVRIS design choices, set to transparent defaults so you can change them and see what changes. None of them estimates win probability, and comparing scores across two organisations running different settings is meaningless.
Download the worksheet and source ledger
The worksheet implements the whole method with live formulas: stakeholder register, relationship edges, evidence log, the three-axis scorecard, concentration, role coverage, map legend, action playbook, the public source ledger and an editable settings sheet.
The source ledger carries every claim used here with its original organisation, direct URL, publication date, sample, population, denominator, limitations and a transparency score out of six. It also records which links were confirmed live on 24 July 2026 and which were blocked to automated checks. Six of the source URLs originally collected for this article had moved or broken within a day of collection, which is the practical reason the ledger exists.
How to cite this page
Original organisations retain ownership of their research. IVRIS did not conduct any of the underlying studies. What we contribute is the separation of access, influence and evidence confidence, the concentration model, the action mapping and the maintained ledger. When you quote a figure, cite the original source. When you quote the method, the worked example or the concentration formulas, cite this page.
Suggested citation: IVRIS Tech, Relationship Mapping for B2B Sales: How to Measure Access, Influence and Account Risk, method and worksheet, version 1.0, 24 July 2026.
Version 1.0, published 24 July 2026. Evidence last reviewed 24 July 2026. Next scheduled review: October 2026. Update triggers: a transparent multithreading or mapping study with disclosed cohorts and controls; a CRM platform changing its relationship-score logic; new buying-group research with materially different scope; a primary source moving, breaking or going behind a paywall; or a change to our own weights, half-life or bands.
Frequently Asked Questions
An org chart shows formal reporting lines and titles. A relationship map adds three things an org chart cannot carry: who is participating in a specific decision, which informal influence edges exist between people, and how strong and how recent your own team’s access to each person is.
Score observable behaviour rather than impressions. Rate access state, exchange depth, reciprocity and route resilience on a 0 to 4 scale with written anchors, then apply a freshness factor based on days since the last meaningful interaction. Record the evidence behind each score with its date.
Concentration risk is the share of your verified relationship capacity that depends on one person. It is not the same as contact count: four mapped contacts can behave like 2.3 relationships if one person carries most of the access, influence and evidence weight between them.
There is no universal number. Published buying groups range from five to 16 people in Gartner’s 2024 survey and 28 in Foundry’s 2024 technology study, because they count different populations. Cover the roles the decision actually requires, then check concentration rather than headcount.
CRM can automate the activity layer: interaction frequency, recency, job-change alerts and stale-contact flags. It cannot automate influence or evidence confidence, because both need human observation of what people actually did. Platform relationship scores are configurable local settings whose weights an administrator chooses, so they are not portable measurements between companies.
No public study shows that using a map causes higher win rates. Vendor analyses associate multithreading with better outcomes, but they do not disclose cohorts, controls or absolute rates. What a map reliably does is reveal missing roles, stale access and concentration so teams can act on them.





