

Most buying committee templates ask you to name a champion, an economic buyer and a technical evaluator, then declare the account mapped. That map holds up right until the forecast review where someone asks how you know the VP of Finance actually releases budget, and the honest answer is that it says so on their LinkedIn profile.
A map built from job titles is a guess with formatting. The template below starts from a different unit: the decision function a purchase requires, the evidence that a named person performs it, and whether your team can actually reach that person. It ships as a working spreadsheet with a coverage score you can audit line by line, plus a rule that stops a comfortable total from hiding an uncovered veto.
Direct answer — What is a buying committee mapping template?
A buying committee mapping template is an opportunity-level record of the people who perform the decision functions a specific purchase requires. A useful one stores more than names and roles: it records the evidence behind each classification, the person’s formal authority, influence, relationship access and engagement, plus the next verification action. The IVRIS template turns those fields into a coverage score and separately flags any uncovered approval or veto function.
Key Takeaways
- Map decision functions, not a fixed role list. One person can hold several functions, and one function can be shared by several people.
- Confidence belongs to a field, not a person. You can be certain someone works at the account and still be guessing about their budget authority.
- Presence, access and engagement are three separate things. Knowing a finance approver exists is not the same as being able to reach them.
- The coverage score is 0.40 presence + 0.30 access + 0.30 engagement, weighted by importance and stage. It is an evidence measure, not a win probability.
- A critical uncovered function stays flagged no matter how high the total climbs. In our worked examples, the map scoring 66.5 is riskier than the one scoring 67.3.
- The full template, coverage calculator and CRM field dictionary are free to download, with no email required.
Download the editable workbook here: IVRIS Buying Committee Mapping Template v1.0 (XLSX) and the vendor-neutral CRM field dictionary (CSV). Both are ungated. Nothing in either file phones home.
What a buying committee map has to show
A buying committee map is a record of who performs each decision function for one specific purchase, what evidence supports that classification, and how usable the relationship is right now. It is attached to an opportunity, not to an account, because the same person can play completely different parts in two deals at the same company. That anchoring choice is also a systems decision, because it determines which CRM object can actually hold that record before an opportunity exists, and whether the group can be scored at all while it is still forming.
Three artefacts get confused with each other constantly. They do different jobs, and only one of them survives a deal review.
| Artefact | What it records | Use it when | Where it fails |
|---|---|---|---|
| Contact list | People associated with an account, usually by title and email | You need reach for outreach or campaign targeting | Association is not involvement. A contact record proves nothing about this purchase. |
| Org chart | Reporting lines and formal hierarchy | You need to understand escalation paths and structure | Hierarchy is not influence. The most senior name is often not the one who shapes the criteria. |
| Committee map | Decision functions, the people performing them, the evidence, access and engagement | You need to know what is verified, what is assumed, and what is missing | It decays fast. Without review triggers it becomes a snapshot of a deal that has moved on. |
The difference matters because contact volume feels like progress. Adding a fourth end user to an opportunity raises your contact count and changes nothing about whether the purchase can be approved. If you want the background on group composition and terminology before you start mapping, the B2B buying committee guide covers what the group is and how it forms; this page covers how to record and verify it. The same distinction shows up at stage level in the enterprise sales funnel, where exit criteria depend on functions being covered rather than meetings being held.
Map decision functions, not a fixed role list
A decision function is a purchase-specific task or authority, such as releasing budget, evaluating architecture or reviewing contract language. Starting from functions instead of personas solves the problem that every competing template creates: an argument about whether the right answer is four roles, five, eight or ten.
This is not a new idea, it is the original one. Webster and Wind defined the buying centre through the activities of users, influencers, deciders, buyers and gatekeepers, and were explicit that more than one role may be exercised by the same individual (Webster and Wind, “A General Model for Understanding Organizational Buying Behavior,” Journal of Marketing, April 1972, vol. 36, no. 2, pp. 12-19). Half a century of template design has quietly converted those activities into job descriptions. The template below converts them back.
Eleven functions cover most B2B purchases. The list is meant to be edited, and marking one “not applicable” with a written reason is a valid, encouraged answer.
| ID | Decision function | What it controls |
|---|---|---|
| F01 | Need or problem ownership | Whether the problem is worth solving, and what a solution has to do |
| F02 | Business outcome accountability | The result the purchase must produce, and who answers if it does not |
| F03 | Budget control | Allocating, releasing, reallocating or withholding the funds |
| F04 | Formal approval or signature | The explicit right to approve, reject, veto or sign |
| F05 | Technical evaluation | Architecture, integration, performance, data and feasibility |
| F06 | Security, privacy, compliance or regulatory assurance | Risk exposure and governance sign-off |
| F07 | Operational implementation | Delivery, configuration, migration and ongoing operation |
| F08 | Procurement and commercial process | Sourcing policy, competitive process and commercial terms |
| F09 | Legal review | Rights, obligations, liabilities and contract language |
| F10 | End-user or adoption representation | The operational effect on the people who will use or support it |
| F11 | Other purchase-specific function | Whatever this particular deal genuinely requires. Rename it. |
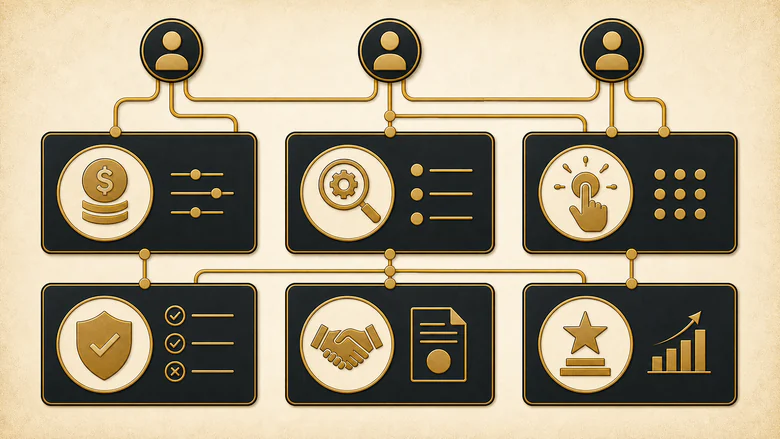
Two structural rules follow, and they are the reason a fixed role list eventually lies to you. One person may perform several functions, which is normal in a 40-person company where the founder owns the need, the budget and the signature. One function may be shared by several people, which is normal in an enterprise where three architects each hold a veto over a different integration. A template with one row per persona cannot represent either case honestly.
Influence, advocacy and resistance are deliberately not on that list. They are attributes of a person in a deal, not functions a purchase requires, and treating them as required slots is how teams end up inventing a champion because the template has an empty box. Where the map spans several products or business units at one account, keep the account-level view in your account-based experience layer and the opportunity-level functions here.
What you can infer, what you must verify, and what stays unknown
Every stakeholder record contains several independent claims, and they can legitimately have different evidence strengths. You might be certain that someone is employed at the account, fairly confident they are involved in this opportunity, and purely guessing that they can approve budget. Collapsing that into one “confidence in Sarah” score throws away the only information that would tell you what to do next.
So confidence is recorded per field. The role classification, the formal authority, the stance: each gets its own score, and each needs its own evidence.
| Score | Status | What justifies it | Example |
|---|---|---|---|
| 0 | Unknown | No usable evidence | An unnamed “finance team” in your notes |
| 25 | Single-source inference | One indirect source | A job title, a profile, one content download |
| 50 | Corroborated inference | Two independent indirect sources | Title plus a second stakeholder naming their role |
| 75 | Direct evidence | The person states or demonstrably performs the function | They explain their approval responsibility on a call |
| 100 | Verified and corroborated | Direct evidence plus an independent second source or formal artefact | Their statement plus a procurement plan or approval workflow |
Two rules keep that ladder honest. The independence rule: two references to the same original information count as one source, so a title plus an enrichment record that copied the same title is not corroboration. The contradiction rule: where active evidence conflicts, the confidence used for scoring drops to a maximum of 25 and the field is marked Contradicted until someone resolves it. Contradictory evidence never gets averaged into a comfortable middle.

The table below is the part worth keeping on a wall. It separates what a signal is allowed to suggest from what it is allowed to prove.
| Function or claim | Can be inferred from | Must be verified as | Insufficient on its own |
|---|---|---|---|
| Budget control | A senior finance or functional title | The ability to allocate or release funds for this purchase | A CFO title |
| Formal approval | Seniority, or a signature on a past contract | A stated or documented right to approve or veto this purchase | Being the most senior person you have met |
| Technical evaluation | An architecture, IT or engineering remit | Named responsibility for evaluating this solution | Attendance at one demo |
| Legal review | A legal or contracts remit | Involvement in this specific contract | Sitting in the legal department |
| Advocate behaviour | Positive sentiment in conversation | Buyer-owned actions that advance internal support | Friendly calls and fast replies |
| Resistance | An expressed concern | A named gate, an unresolved condition and a consequence | Difficult questions |
That last row is where most CRM data quietly turns into fiction. A security reviewer asking hard questions about data residency is performing an assurance function correctly, and labelling them a blocker tells your team to route around the one person whose sign-off you need. Record the condition, not a personality. The same discipline applies upward: seniority is a reason to investigate authority, not evidence of it, which is the argument behind our executive outreach qualification criteria.
Engagement signals need the tightest boundary of all. Person-level activity can help you discover a candidate worth verifying. Account-level intent cannot identify which named individual performs a decision function, because it is probabilistic and aggregated by design, as our B2B intent data guide sets out. In this template, anonymous account intent can never raise a named person’s engagement score. It can only create a task.
PRO TIP
Make “Unknown” a controlled value in every dropdown, not a blank cell. A blank invites the next person to fill it with a plausible guess. “Unknown” creates a verification task with an owner and a due date.
How to build the map in six steps
To build a buying committee map, define the purchase, select the functions it requires, attach people to those functions, record the evidence behind each classification, then review the gaps. The workbook is set up to be filled in this order, and the whole first pass takes about half an hour for a live opportunity.
Workflow · 30 min
How to build a buying committee map: six steps from purchase scope to next action
Produces an auditable, opportunity-level record of who performs each required decision function, how strong the evidence is, and which gap to work next.
Define the purchase and the current stage
Fill in Opportunity Setup. Write down what is in and out of scope. One map per opportunity, renewal, expansion or defined use case, never one per account.
Select the applicable decision functions
On Required Functions, mark each of the eleven Yes, No or Unknown, and write the reason. Set importance 1 to 3 and stage relevance before you name a single person.
Add the people you know and the ones you suspect
On Committee Map, add a row per person per opportunity. Where you know a function exists but not who performs it, add a row named “Unknown person” and assign the function anyway.
Attach evidence to every material field
On Evidence Ledger, log what supports each claim, its date, who captured it, and its independent source group. Set role, authority and stance confidence separately.
Record access, engagement and the next action
Score relationship access and engagement against the published scales. Every row gets a named internal relationship owner and a next verification action with a date.
Read the critical gaps before the total score
Open Coverage Scorecard. Work the flagged critical gaps first, then the lowest-coverage high-importance functions. Re-review on the trigger events, not on a calendar habit.
Step two is the one teams skip, and skipping it is what produces a map full of end users and no signatory. Deciding what the purchase requires before you look at who you happen to know is the entire discipline. Definitions, validation rules and controlled values belong to whoever owns your data model, which in most teams means this sits inside RevOps rather than with individual reps.
Score committee coverage without pretending to predict the win
Committee coverage is the degree to which important, stage-relevant decision functions have verified people, usable access and observed engagement. It is not the percentage of persona slots you have filled, which is what most completeness metrics actually measure.
Each applicable function gets a coverage figure built from three inputs.
R = (0.40 × Presence) + (0.30 × Access) + (0.30 × Engagement)Presence carries the largest share because the role assignment is the prerequisite for the other two: access to someone who does not perform the function is not coverage. Access and engagement split the remainder evenly, because a relationship you cannot use and a contact who never engages both leave you exposed in different ways. These weights are workflow defaults we chose and made editable. They are not coefficients derived from outcome data, and the next section says exactly what that means.
| Input | Scale | What each level means |
|---|---|---|
| Presence (P) | 0 / 0.25 / 0.50 / 0.75 / 1.00 | Derived from role confidence: unknown, single-source inference, corroborated inference, direct evidence, verified and corroborated |
| Access (A) | 0 / 0.33 / 0.67 / 1.00 | No known access, indirect through another stakeholder, direct but limited or one-way, direct and reciprocal |
| Engagement (E) | 0 / 0.25 / 0.50 / 0.75 / 1.00 | None, passive activity, responded or attended, shared criteria and concerns, owns or completed a buying action |
| Importance (I) | 1 / 2 / 3 | Supporting, material, or critical to approval, veto, funding or a current gate |
| Stage multiplier (G) | 0.50 / 1.00 / 1.25 | Relevant to a later stage, relevant now, or a current gating dependency |
Functions are then weighted by how much they matter and how immediately, and rolled into a single figure across applicable functions only.
CCS = 100 × Σ(W × R) ÷ Σ(W), where W = I × GIf no function has been marked applicable, the workbook returns “Not calculated” rather than zero, because an unfilled map and a genuinely empty one are different problems. The band labels are 0-39 sparse evidence, 40-59 material gaps, 60-79 usable but incomplete, and 80-100 broadly covered. They describe the state of your evidence. They are not grades, and reading them as poor, average or good is the first step towards treating the number as a forecast. If you have built a transparent scoring model before, the governance pattern here matches the one in our ICP scoring rubric: publish the criteria, keep the weights editable, and never let the output leak into a probability field.
IMPORTANT
A critical gap is flagged whenever a function has importance 3, a stage multiplier of 1.00 or higher, and any of presence below 0.75, access below 0.67, or engagement below 0.50. The flag cannot be cleared by stronger coverage elsewhere. Read it before you read the score.
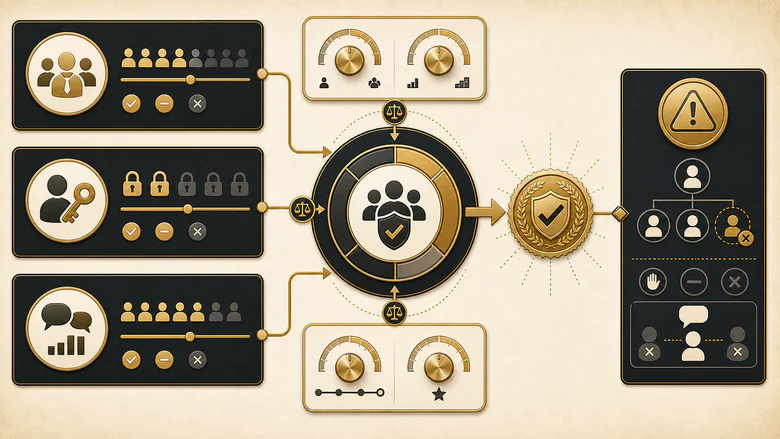
What the score cannot tell you is a short list worth reading twice. It does not know whether your solution is competitive, whether the budget survives the quarter, whether a rival has a stronger champion, or whether the buyer will do nothing. It measures the completeness and usability of the evidence your team currently holds. Nothing more.
Three worked examples, and why the override exists
The workbook ships with three scenarios, formulas exposed rather than values pasted, so you can change any input and watch the score move. They also demonstrate the single most useful thing the model does.
Example 1, a simple buying group. A smaller company evaluating a workflow application, three people covering six functions. Budget control and formal approval both sit at presence 0.75, access 0.67 and engagement 0.50. Technical fit is inferred and weakly accessed at 0.50 / 0.33 / 0.25.
| Scenario | Functions | Coverage score | Critical gaps | What to do next |
|---|---|---|---|---|
| 1. Simple buying group | 6 | 67.3 | None | Verify the technical function, which is currently a single-source inference |
| 2. Cross-functional mid-market | 10 | 59.2 | 2 (budget control, formal approval) | Find out who owns formal approval and build a credible access path |
| 3. Enterprise buying group | 10 | 66.5 | 1 (formal approval) | Same gap, higher score. Do not let the total reassure you |
Now put those three in order. Example 3 scores 7.3 points higher than Example 2 and is still gated on formal approval. Example 1 scores only 0.8 points above Example 3 and carries no gate at all. Ranked by the aggregate, the enterprise deal looks healthier than the mid-market one and almost as safe as the simple one. Ranked by risk, it is not. The aggregate ranks these maps in the wrong order. That is precisely why the critical-gap flag sits beside the score rather than inside it.
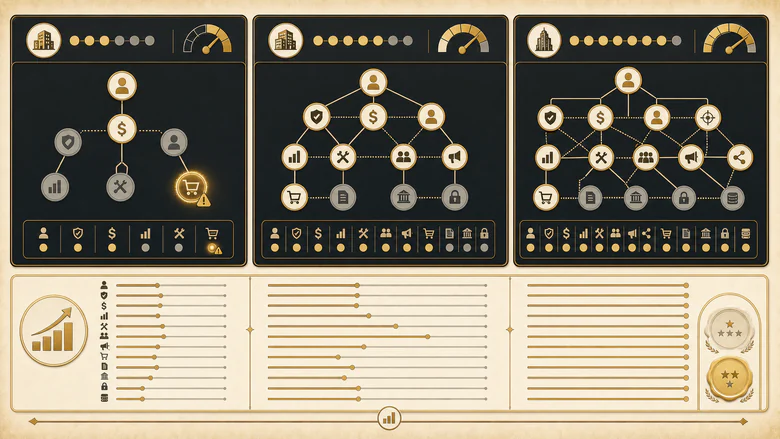
The practical consequence in Example 2 is the one every rep recognises. Adding a fifth end user would raise activity, feel productive, and move the score by a rounding error. Confirming who signs, and securing a route to them, resolves the gate. Once the map is honest about where the gaps are, the engagement plan almost writes itself, which is the territory covered in how to sell to B2B buying committees.
The CRM fields that make the map survive
A map that lives in a slide deck dies at the end of the quarter. The schema below is vendor-neutral and ships as a CSV so you can adapt it without importing anyone’s sales methodology vocabulary. The full dictionary carries 26 fields with validation rules, personal-data classifications and retention notes; these are the ones that do the work.
| Field | Object | Why it earns its place |
|---|---|---|
| Decision function + additional functions | Stakeholder-opportunity junction | Standard role fields hold one value. Multi-function people need a multi-select or they get recorded wrong. |
| Role, authority and stance confidence | Stakeholder-opportunity junction | Three separate claims, three separate scores. This is the field-level rule made concrete. |
| Influence level + influence mechanism | Stakeholder-opportunity junction | The mechanism field is what replaces an unexplained “high” with criteria ownership, budget, process control or coalition. |
| Relationship access, engagement level | Stakeholder-opportunity junction | The two inputs most often faked by pulling in an account-level intent score. Keep them manual and named. |
| Independent source group | Evidence record | A text key that stops the same original fact being counted twice as corroboration. |
| Contradiction flag, last verified, review due | Stakeholder-opportunity junction | Turns evidence decay into an exception report instead of a surprise. |
| Critical gap flag | Opportunity | Put it above the score on the page layout. If it sits below, nobody reads it. |
Every major platform already supports the underlying shape, and none of them supply the evidence layer. Salesforce’s OpportunityContactRole is a junction between a contact and an opportunity that accepts multiple contact roles with one marked primary, so it holds the relationship but not the confidence history. HubSpot’s association labels define the relationship between contacts and deals on Professional and Enterprise tiers, allow up to 50 labels per object pair, and work in lists, reports and workflows. Microsoft’s Dynamics 365 Sales stakeholders use connection records with out-of-the-box roles of Champion, Decision Maker, End User, Economic Buyer, Influencer and Technical Buyer.
Note what those defaults are: platform examples, not evidence that every opportunity requires them. Where a person holds several functions or a function needs an evidence history, extend the junction or add a custom object rather than forcing the standard single-value role field to carry a load it was never designed for. Teams choosing between platforms will find the object-model differences that matter set out in our CRM software examples breakdown.
Keeping the map current, and the ten errors that break it
Update the map on events, not on a schedule. The triggers that actually matter: a new stakeholder appears in a meeting, budget ownership changes, security or legal or procurement work begins, the stage or decision date moves, a requirement changes materially, someone changes role or employer, evidence becomes contradicted, an agreed internal action is completed or missed, or the deal is re-opened, expanded or split.
On top of that, review windows of 14 days at approval or negotiation stage, 30 days at other active stages, and 90 days for a strategic account with no live opportunity. Run a weekly exception report for missing owners, overdue reviews, open contradictions and critical gaps. The opportunity owner is accountable for the map, each evidence item belongs to whoever captured it, and definitions belong to RevOps.
The errors below account for most broken maps we see described in public playbooks:
- Copying job titles into role fields without evidence
- Mapping the account rather than the specific purchase
- Counting passive activity, or account-level intent, as engagement
- Treating advocates and blockers as personality types instead of evidenced behaviours
- Merging budget control, formal authority and contract signature into one idea
- Banning “unknown” from the data model, so guesses fill the gap silently
- Averaging contradictory evidence into a comfortable middle value
- Rewarding contact volume rather than coverage of critical functions
- Letting a healthy total score hide an uncovered veto
- Quoting the score as a probability in a forecast review
One more error deserves its own sentence, because it is built into most templates as a feature: setting a target number of committee members. Published research does not support a universal figure. Forrester’s State of Business Buying, 2026, drawn from a 2025 survey of nearly 18,000 global business buyers, reports that the typical buying decision “now includes 13 internal stakeholders and nine external influencers,” and separately that procurement professionals are decision-makers in 53% of buying cycles, engaging from the start. Other credible studies of narrower populations report far smaller designated groups. Those figures count different things for different purchases, and the reasons they diverge are set out in our B2B buying group statistics analysis. Let the purchase determine the required functions. Never let a headline average determine when the map is finished.
Methodology, limitations and how to cite this page
This section exists so the framework can be checked rather than trusted. Every claim on this page falls into one of five categories, and we have tried to keep the boundary visible in the prose itself.
| Category | What it covers here |
|---|---|
| Reported by an external source | Forrester’s stakeholder and procurement figures; the buying-centre role concept from Webster and Wind; platform behaviour documented by Salesforce, HubSpot and Microsoft |
| Calculated by IVRIS | The three worked example scores of 67.3, 59.2 and 66.5, reproducible from the published inputs and formula |
| Classified by IVRIS | The eleven decision functions, the confidence ladder, the access and engagement scales, the role-evidence matrix |
| Inferred by IVRIS | That aggregate coverage ranks maps in the wrong order for risk, demonstrated by the examples rather than by outcome data |
| Recommended by IVRIS | The weights, stage multipliers, critical-gap thresholds, review cadences and CRM field names |
The stated limitations are real ones. The 40 / 30 / 30 weighting has not been validated against won and lost opportunities, and no public evidence establishes it as an optimal commercial weighting; it is a transparent default you can change in the workbook. The stage multipliers of 0.50, 1.00 and 1.25 express priority, not a measured causal effect. Presence uses the strongest verified evidence for a function, scaled down where a function needs more people than you have mapped, which is our design choice rather than a research finding. Scores are not comparable across teams using different scales.
On sources: the separation of formal hierarchy from issue-specific influence, and the practice of recording an unknown position explicitly, draw on the World Bank Group’s stakeholder mapping toolkit (2016), which documents a case where the highest-ranking stakeholder was among the least influential on the issue at hand. Forrester’s full methodology is available to its clients only, so we have kept its own wording, including “influencers,” and have not converted 13 plus nine into a single committee headcount. The Webster and Wind paper is cited in full above; its publisher record sits behind a bot-verification gate, so no direct link is given.
Version 1.0, published 24 July 2026. Last reviewed 24 July 2026. Revision history is maintained on the Change Log tab of the workbook, and version 1.0 is the first public release. We will refresh this page when a material buyer study is published, when a cited platform changes its opportunity-role model, when a source link breaks, or whenever we change a formula, weight or controlled value.
Suggested citation: IVRIS, “Buying Committee Mapping Template: Roles, Evidence and Coverage Score,” version 1.0, 24 July 2026.
Frequently Asked Questions
There is no correct number. Published studies report very different group sizes because they count different things for different purchases. Let the purchase decide: list the decision functions it genuinely requires, then map whoever performs them. A six-person map covering every critical function beats a fifteen-person map missing the signatory.
Yes. The IVRIS template is a nine-tab XLSX workbook with live formulas, dropdown validation and a working coverage calculator, plus a separate CSV field dictionary for CRM implementation. Both download free with no email registration, and both open in Excel, Google Sheets or LibreOffice.
Record a blocking condition, not a person. The bar is that someone holds a formal or practical gate and has withheld approval, or an unresolved requirement of theirs prevents a required next step, or they repeatedly fail an agreed dependency. Store the gate, the consequence, the evidence and the date. Asking hard questions is not resistance.
No. Account-level intent is aggregated and probabilistic, so it cannot tell you which named person performs a decision function. Person-level engagement is more useful, but a content click still only makes someone a candidate for verification. In this template, anonymous intent can create a verification task and can never raise a person’s engagement score.
No. The score measures how complete and usable your stakeholder evidence is, not whether you will win. Its weights have never been validated against won and lost deals. Our own worked examples show a map scoring 66.5 carrying an uncovered approval gate while one scoring 67.3 carries none, so read the critical-gap flag first.





