

Search how to improve demo conversion rate and Google answers before you reach a single result. Shorten the form. Embed the calendar. Respond in under five minutes. Personalize the walkthrough. Add an interactive demo. Every page ranking underneath the AI Overview says a version of the same nine things, and most of them say it well.
None of them tells you which of those nine things is losing your meetings. That is the part the advice cannot do for you, because the answer depends on where your funnel actually breaks, and a demo request can die in twelve distinct places between the submit button and a meeting that someone attends.
This page is the diagnosis. It defines every state a demo request passes through, gives you a formula that converts each stage’s loss into the held meetings it really cost you, grades all eleven common interventions by the strength of the public evidence behind them, and ships the whole thing as a worksheet you can run against your own numbers.
Direct answer — How do you improve demo conversion rate?
Improve demo conversion by finding the broken stage first, not by applying a list of tactics. Reconcile form submissions against CRM records, separate validation from qualification, confirm routing and bookable capacity, then measure qualified-to-booked and booked-to-held separately. Rank each stage by the held meetings its loss actually costs, not by raw drop-off. A higher booking rate is not an improvement if opportunity creation or fit deteriorates.
Key Takeaways
- A demo request passes through twelve states. “Demo conversion rate” usually compresses four or five of them into one number, which is why published figures disagree by tens of points.
- Raw drop-off ranks your problems wrong. A loss high in the funnel would mostly have been filtered out anyway; a loss near the meeting was one step from a held meeting.
- Held-equivalent leakage fixes that. In the worked example below, the stage losing 279 records ranks fourth on priority and the stage losing 67 ranks first.
- Of eleven interventions the ranking pages recommend, exactly one is supported by randomized controlled trials, and every one of those trials was run in healthcare rather than B2B.
- Booked, held and accepted-opportunity are three different events. Optimizing the first without watching the third is how teams book more meetings and build less pipeline.
What demo conversion rate has to mean before you can improve it
Demo conversion rate is the share of a defined starting cohort that reaches a defined ending event, measured over a fixed window. That sentence is doing more work than it looks. Change the starting cohort from all submissions to qualified submissions and the same funnel reports a rate tens of points higher, without anyone booking a single extra meeting.
The three endings people collapse into “converted” are separate records in every CRM and every scheduler:
- Booked means a meeting object and an invite exist. Nobody has attended anything.
- Held means the meeting reached its start time and the required attendee joined under your stated policy.
- Accepted opportunity means a seller took the meeting and the resulting record survived your acceptance rule.
Booking rates travel widely because they are flattering and easy to instrument. Held rates travel rarely because they need an outcome policy and a maturation window. Opportunity rates almost never travel at all, which is precisely why they are the only honest check on whether a booking-rate gain was real. The same discipline that separates an MQL from an SQL at the handoff applies here, one layer further down the funnel.
Two rates that share a label but not a denominator cannot be compared, and that failure is not unique to demo funnels. It is the same error as measuring warm and cold leads against a single consistent target and then treating the resulting gap as performance. If you also run a self-serve motion, keep its trial-to-paid stages in a separate model entirely, because a product qualified lead and a demo request reach revenue through different events.
Write every rate you publish internally in this shape, and most arguments about whose number is right end immediately:
Rate = end event ÷ start event, over a fixed cohort window, counted in unique request IDsA worked version: held meetings due in Q2 ÷ qualified requests submitted in Q2, using a 60-day maturation window and deduplicated request IDs. Anyone reading that knows exactly what you counted. This page sits under the full B2B sales funnel, and owns only the operational stretch between a form submission and a meeting somebody attended.
The twelve places a demo request dies
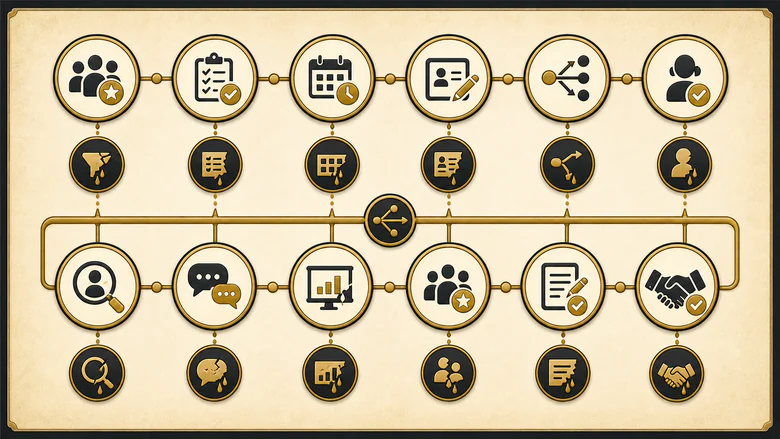
A demo request passes through twelve consecutive states, and every published tactic targets exactly one of them. Naming the states is what turns a vague conversion problem into a specific one, because each state has its own evidence source, its own failure mode and its own correct denominator.
| Code | Transition | What is lost here | Correct denominator | Intentional or recoverable |
|---|---|---|---|---|
| A | Eligible visit to form view | CTA not found, message mismatch, page failure | Eligible sessions | Usually recoverable |
| B | Form view to form start | Unclear value, perceived effort, privacy concern | Form views | Usually recoverable |
| C | Form start to valid submit | Field friction, validation errors, technical failure | Form starts | Usually recoverable |
| D | Valid submit to captured request | Webhook or CRM failure, duplicate overwrite, missing ID | Valid submits | Recoverable measurement failure |
| E | Captured to validated | Spam, invalid identity, incomplete record | Captured requests | Mixed |
| F | Validated to qualified | True reject, or a false negative from a bad rule | Validated requests | Mostly intentional |
| G | Qualified to routed | No rule match, ownership conflict, license or calendar disconnect | Qualified requests | Usually recoverable |
| H | Routed to availability shown | No slots, timezone error, blocked calendar, excessive buffers | Routed requests | Usually recoverable |
| I | Availability shown to booked | Calendar abandonment, duplicate booking, invite failure | Requests shown a valid slot | Usually recoverable |
| J | Booked to active at cut-off | Cancellation, or a reschedule nobody recovered | Booked meetings | Mixed |
| K | Meeting due to held | Prospect no-show, host no-show, link or timezone failure | Meetings due, never all bookings | Mixed |
| L | Held to accepted opportunity | Poor fit, weak discovery, duplicate account, process rejection | Held meetings | Quality guardrail |
The intentional column is the one teams skip, and skipping it produces the most expensive mistake in this whole subject. Stage F is supposed to lose records. Rejecting a student, a competitor or a company a third your minimum deal size is the qualification rule doing its job, and counting those rejections as leakage builds a business case for breaking the filter. Only false negatives at stage F are recoverable loss, and finding them means auditing a sample of rejected records rather than staring at the rejection rate.
IMPORTANT
Validation, qualification and scoring are three different decisions. Validation asks whether the record is real and usable, qualification asks whether the company fits, and scoring only sets the order of attention. Our nine-point validation gate keeps them separate, and the separation is what stops spam removal being reported as a conversion problem.
Fix the stage that costs the most meetings, not the one that looks biggest
Rank your stages by raw drop-off and you will almost always pick the wrong one to fix. A record lost near the top of the funnel still had to survive qualification, routing, bookable capacity and attendance before it became a held meeting, so recovering it returns only a fraction of a meeting. A record lost at the attendance stage was one step away from the outcome you wanted.
Start from the arithmetic of the whole chain. If N₀ is your starting cohort and r₁ through rₖ are the pass-through rates to a held meeting:
H = N₀ × r₁ × r₂ × … × rₖNow convert each stage’s loss into the held meetings it actually cost. The held-equivalent loss at a stage is that stage’s raw loss multiplied by every pass-through rate that comes after it:
HEL(i) = (N(i) − N(i+1)) × Π downstream rates after stage iThat quantity has an exact interpretation, which is what makes it citable rather than merely intuitive. HEL(i) is the number of held meetings you would gain if stage i became lossless and every other rate stayed where it is. It is a sensitivity calculation on your own numbers, not a forecast and not a causal claim about any intervention.
Here is the calculation run on the default cohort in the downloadable worksheet: 1,000 valid form submissions, a 70% qualification rate, a 72% booking rate once a slot is shown, an 82% show rate and a 35% held-to-opportunity rate. The funnel produces 305 held meetings and 107 accepted opportunities, and loses 695 records along the way.
| Code | Transition | Records lost | Downstream yield | Held-equivalent loss | Share of leakage | Priority score |
|---|---|---|---|---|---|---|
| D | Valid submit to captured | 20 | 0.312 | 6.2 | 1.5% | 0.44 |
| E | Captured to validated | 49 | 0.328 | 16.1 | 3.9% | 0.90 |
| F | Validated to qualified | 279 | 0.469 | 130.9 | 31.7% | 1.64 |
| G | Qualified to routed | 13 | 0.478 | 6.2 | 1.5% | 0.35 |
| H | Routed to availability shown | 64 | 0.531 | 33.9 | 8.2% | 1.91 |
| I | Availability shown to booked | 161 | 0.738 | 118.8 | 28.8% | 2.97 |
| J | Booked to active at cut-off | 41 | 0.820 | 33.9 | 8.2% | 1.59 |
| K | Active booking to meeting due | 0 | 0.820 | 0.0 | 0.0% | 0.00 |
| L | Meeting due to held | 67 | 1.000 | 67.0 | 16.2% | 4.71 |
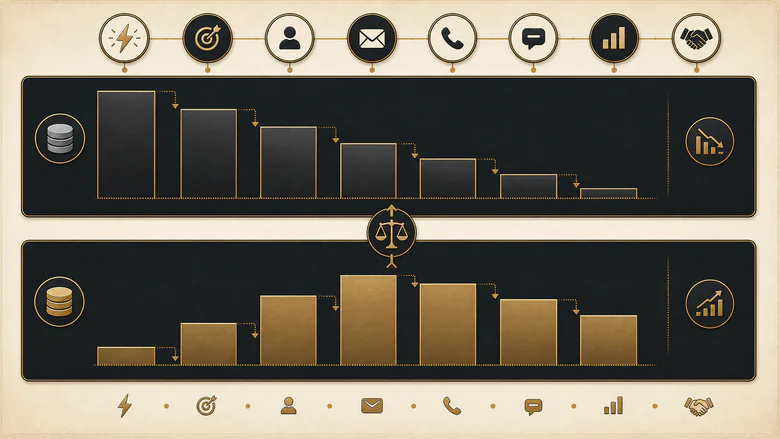
Read the first and last columns together, because that is where the whole argument lives. Stage F loses 279 records, more than four times what the attendance stage loses, and it ranks fourth on priority. The attendance stage loses 67 and ranks first. Two things drive that inversion: most of F’s loss is intentional, so only a small share is recoverable at all, and every record lost at the attendance stage carries a downstream yield of 1.00 because there is nothing left between it and a held meeting.
A quieter inversion sits lower in the table. Stage E discards 49 records and stage J discards 41, so raw drop-off says fix E first. In held-equivalent terms J costs 33.9 meetings against E’s 16.1, because a cancellation is one attendance step from success while an invalid record still has to clear qualification, routing, capacity and attendance.
The priority column adds the three things a ranking by impact alone still ignores: how much of the loss you could plausibly recover, how confident you are in the mechanism and the measurement, and what the fix costs to build.
Priority = (held-equivalent loss × recoverable share × evidence confidence × measurement confidence) ÷ effortRecoverable share is your estimate, not ours, and it should be zero wherever the loss is deliberate or your sellers have no capacity to absorb the extra meetings. That last condition matters more than it sounds: extra bookings that push your earliest available slot two weeks out will quietly damage your show rate, which is the stage you just decided was worth the most.
Run the diagnosis in this order
Run the seven gates in sequence, because each one can invalidate the conclusions of the gates after it. Measurement comes before quality, quality comes before capacity, and all three come before any tactic, since a funnel with an unreconciled capture gap will point you at a stage that is not actually broken.

Workflow · about 4 hours
How to diagnose a demo conversion problem: the seven gates
A single diagnostic pass from measurement reconciliation to downstream validation, run in order so that no gate is answered with data a later gate would have invalidated.
Reconcile submits against CRM records
Match client submits to server receipts, server receipts to unique CRM request IDs, and CRM requests to meeting objects. Stop the audit here if capture completeness is unknown.
Set the quality guardrail before touching anything
Record your current accepted-opportunity rate and fit mix, then pull a sample of rejected records and check how many were rejected in error.
Prove routing completed and capacity exists
Audit rule completion, owner eligibility, calendar connection, slot count, earliest available slot and timezone handling on a live sample of routed requests.
Calculate held-equivalent leakage per stage
Enter your stage counts into the worksheet and rank stages by downstream-weighted loss, not by raw drop-off.
Diagnose the chosen stage with stage-specific evidence
Use field analytics for form stages, routing logs for assignment, slot telemetry for capacity, and meeting lifecycle history for attendance.
Pick the smallest intervention with adequate evidence
Choose from the graded matrix below, define the control and variant cohorts, and write the quality guardrail into the test plan before launching it.
Validate downstream and roll back on a quality breach
Read held meetings, accepted opportunities, fit mix and seller load together. Reverse the change if the opportunity rate falls even when bookings rise.
Gate 0: reconcile the form, the server, the CRM and the meeting
Nothing downstream is trustworthy until you know that a submitted form becomes a countable record. In an automated audit of public B2B forms we published earlier this year, a static scanner detected expected capture values on only 8 of 20 forms where the browser payload confirmed them, missing 9. That gap is between two browser-side measurements. The gap between a browser payload and a CRM record is wider still, and it is invisible from outside the company.
Three queries find most of it: valid client submits with no server receipt after the retry window, server receipts with no unique CRM request ID, and booked meetings with no invite ID or a duplicate meeting record.
Gate 1: protect lead quality before you optimize anything
Every intervention below can raise bookings by lowering the bar. Set the guardrail first, in writing, so that the test has a way to fail. The minimum version is your accepted-opportunity rate per held meeting plus your fit mix, since acceptance is a handoff rather than an outcome and a booking that no seller accepts has cost you a slot rather than earned you a pipeline.
Then audit the rejections. Enterprise motions discard far more inbound before a seller sees it than mid-market motions do, which is correct behavior and also exactly the condition under which a badly written rule can reject good companies invisibly. Sample rejected records monthly and check how many later appear as opportunities through another route. If your rules assign points rather than pass-fail verdicts, the same audit applies to the signals and point values doing the rejecting.
Gate 2: prove routing completed and a real slot appeared
“No slots” is a systems state far more often than it is a statement about buyer demand. HubSpot’s scheduling documentation is explicit that availability depends on a connected calendar, configurable availability windows, a minimum-notice setting and buffer time between meetings, and that reminder emails send only when the calendar is connected (HubSpot Meetings documentation, updated June 2026). Calendly documents free/busy rules that decide which connected-calendar events block availability at all (Calendly free/busy rules).
Every one of those is a configuration that can silently produce an empty calendar for a qualified buyer. Instrument slot count, earliest available slot and displayed timezone on every scheduler impression, and treat any routed request that saw zero valid slots as a capacity failure rather than a conversion failure.
Gate 3: locate the loss that actually costs meetings
This is the leakage calculation above, run on your own frozen cohort. Two input rules do most of the work: use counts rather than rounded percentages wherever you have them, and use meetings due as the denominator for show rate so that meetings scheduled for next month are neither held nor no-shows.
Eleven interventions, graded by the evidence behind them
Grade every intervention by the strongest public evidence that supports it, and the received wisdom about demo conversion looks very different. Of the eleven interventions the ranking pages and Google’s own AI Overview recommend for this query, exactly one is supported by randomized controlled trials, and every one of those trials was run in healthcare rather than B2B sales.

| Intervention | Target stage | Strongest public evidence | Evidence grade | Main quality risk |
|---|---|---|---|---|
| Pre-meeting reminders | J, K | Cochrane review of 8 randomized trials; McLean realist synthesis of 31 RCTs | Randomized, but healthcare | Over-messaging, wrong contact or timezone |
| Easy cancel, reschedule and recovery | J, K | McLean synthesis, which found only three studies on cancellation and rebooking | Randomized but very sparse, healthcare | Lost ownership, slots never reallocated |
| Remove nonessential form fields | B, C | 40,000-page observational analysis plus one uncontrolled single-company test | Observational at scale | Quality dilution, missing routing data |
| Faster meaningful response | D to G | 2007 and 2011 observational studies; 2026 secret shops | Observational, mostly historical | Automated replies counted as responses |
| Instant embedded scheduling | H, I | Two large vendor telemetry datasets, no randomized exposure | Vendor telemetry, non-causal | No slots, wrong owner, low-quality volume |
| Round-robin and ownership routing | G, H | Product documentation plus inferred tool detection in secret shops | Documentation and weak observational | Conflicts, stale ownership, disconnected calendars |
| Increase bookable capacity or shorten lead time | H, K | Availability documentation; a single-clinic lead-time association | Documentation and weak observational | Seller overload, worse preparation |
| Prefill, enrichment and form shortening | B, C, F | Product documentation only; no published outcome data | Documentation only | Stale data, silent false rejection |
| Validation and qualification rules | E, F | Definitional frameworks and vendor routing documentation | Conceptual governance layer | False negatives, rule drift |
| Confirmation email and invite clarity | I, J | Product documentation only | Documentation only | Deliverability, missing video link |
| CRM and event reconciliation | D, and all reporting | Public form audit plus vendor sync documentation | Measurement prerequisite, not a lever | Double counting, overwritten status |
None of that means the documentation-only interventions do not work. It means nobody has published evidence that they do, so the correct posture is to treat them as hypotheses worth testing locally rather than as settled practice worth copying.
Simplify the form without diluting the pipeline
Field count is a weak proxy for form friction, and the largest public dataset says so directly. Dan Zarrella’s analysis of more than 40,000 HubSpot customer landing pages found that conversion fell only slightly as field count rose, but that multiple textareas had what he called a powerful depressing effect and multiple dropdowns were associated with lower conversion (HubSpot, analysis of 40,000+ landing pages). Field type beat field count.
The most-quoted counterexample is a Marketo test in which five-, seven- and nine-field forms converted at 13.4%, 12.0% and 10.0% with cost per lead of $31.24, $34.94 and $41.90 (MarketingExperiments, June 2011). It is a single company, from 2011, with no disclosed sample size or significance test, and it changed several fields at once. Useful as an illustration, useless as a benchmark.
Nielsen Norman Group’s EAS framework is the better instruction because it is about purpose rather than arithmetic: eliminate questions that are nonessential, automate what can be inferred, simplify what remains. The article says plainly that longer forms are sometimes necessary (Nielsen Norman Group, March 2025). Audit each field for a documented downstream use, and if a field feeds a routing rule, removing it moves your loss from stage C to stage G rather than removing it.
Turn on instant scheduling only after the prerequisites pass
Chili Piper’s 2025 benchmark report is the largest public dataset on this question: nearly 4 million 2024 form submissions across its customer base, of which 14.1% were disqualified and 66.7% of qualified submissions booked a meeting (Chili Piper, February 2025). Publishing the disqualification denominator alongside the booking rate is genuinely more transparent than most vendor benchmarks manage, and it is what makes the analysis in the next section possible at all.
The report then compares that 66.7% against a stated 30% industry average and concludes that form scheduling more than doubles conversion. That comparison does not survive contact with its own method. The 66.7% describes qualified submissions inside companies that bought scheduling software; the 30% comparator describes a different population, measured by someone else, against an unstated denominator. Nobody was randomly assigned to anything. What the dataset supports is that scheduling-software customers book a high share of their qualified inbound. What it cannot support is that the software caused a doubling for a company that does not yet use it.
PRO TIP
Before enabling instant scheduling, check the three prerequisites it depends on: routing completes with a real owner, that owner has a connected calendar and a license, and the calendar shows at least one slot inside your acceptable lead time. Instant scheduling on top of a broken route just moves the failure somewhere harder to see.
Measure response latency instead of promising five minutes
The five-minute rule descends from a 2007 study by Professor James Oldroyd with InsideSales.com, covering six companies, more than 15,000 web leads and more than 100,000 call attempts over three years. It found the odds of qualifying a lead fell roughly 21-fold as response time stretched from five minutes to thirty (Lead Response Management Study). The study explicitly did not examine close ratios, and it describes a phone-led environment that predates every scheduler in this article. A 2011 Harvard Business Review audit found comparable patterns across 2,241 US companies, though the full article sits behind a paywall (Oldroyd, McElheran and Elkington, HBR, March 2011).
The current picture is less flattering and more useful. Workato submitted demo requests to 114 B2B companies and found exactly one sent a personalized email within five minutes; the average personalized reply took 11 hours and 54 minutes, and only 31% called at all, averaging 14 hours and 29 minutes (Workato, March 2026). Treat latency as something to instrument in bands rather than a universal service level, and count an autoresponder as what it is. Our breakdown of each clock in the response chain separates form processing, routing, first attempt and first meaningful human contact, which is the level of detail this stage needs.
Send reminders, and be honest about where the evidence comes from
This is the one intervention with randomized support. A Cochrane review of eight trials covering 6,615 participants found SMS reminders improved appointment attendance against no reminder, with attendance at 67.8% with no reminder, 78.6% with SMS and 80.3% with phone calls, and a relative risk of 1.14 across the seven studies and 5,841 participants in the main comparison (Gurol-Urganci et al., Cochrane, 2013).
Those are healthcare appointments. The mechanism transfers plausibly to a B2B meeting booked three weeks in advance; the effect size does not, and no B2B team should plan on an eleven-point attendance gain because a clinic saw one. McLean and colleagues, synthesizing 31 randomized trials, added the operational half of the finding: reminders work, but only three studies examined cancellation and rebooking, and services need supportive administrative processes to turn a cancellation into a reallocated slot (McLean et al., Patient Preference and Adherence, 2016). A reminder that prompts a cancellation you never refill has not helped you.
The measurement plan that makes the diagnosis provable
Instrument the events below and the entire diagnosis becomes a query rather than an argument. The rule that matters most is the last column: a request ID that survives every reschedule, so a moved meeting stays one request instead of becoming two.
| Event | System | Core IDs and timestamp | Rule |
|---|---|---|---|
| demo_form_view | Analytics | session_id, form_id, form_version | Must mean rendered and viewable, not page loaded |
| demo_form_submit_client | Browser | request_id, timestamp, payload hash | Not proof of server or CRM receipt |
| demo_form_submit_server | Web server or MAP | request_id, timestamp, response code | Reconcile against the client submit |
| demo_request_created | CRM | request_id, contact_id, created_at | System-of-record receipt; carry duplicate_group_id |
| demo_request_validated | Validation service | request_id, validated_at, status | Separate invalid and spam from poor fit |
| demo_request_qualified | Routing or CRM | request_id, qualified_at, status | Store the reason and the rule version; audit rejects |
| demo_route_completed | Router | request_id, routed_at, owner_id | Record no-match, conflict and fallback states |
| demo_scheduler_shown | Scheduler | request_id, shown_at, slot_count, earliest_slot_at | Require at least one valid slot to count as shown |
| demo_meeting_booked | Calendar | request_id, meeting_id, booked_at, start_at | Invite creation is a separate check |
| demo_meeting_rescheduled | Scheduler | old_meeting_id, new_meeting_id, reschedule_count | Preserve the parent request ID |
| demo_meeting_due | Warehouse | request_id, meeting_id, start_at | The only valid denominator for show rate |
| demo_meeting_outcome | CRM | meeting_id, outcome_at, outcome | Held, no-show, host failure or cancelled, with a stated source |
| demo_opportunity_created | CRM | request_id, opportunity_id, accepted flag | The quality guardrail for every experiment above |
Seven implementation faults that fake a conversion problem
Rule these seven out before you conclude that buyers have gone cold, because each of them produces a chart that looks exactly like falling demand:
- Zero slots on a connected calendar. Buffers, minimum notice and busy-status rules can empty a calendar that its owner believes is open.
- Duplicate meeting records. Two sync paths writing the same meeting inflate bookings and corrupt every rate built on them.
- Contact-level status overwriting history. A “latest meeting status” field on the contact record loses the reschedule that preceded it. Report from the meeting object.
- Timezone display errors. A slot rendered in the host’s timezone converts worse and produces no-shows that are really scheduling failures.
- Future meetings in the show-rate denominator. Counting bookings created this month against meetings held this month guarantees a depressed show rate that no intervention can fix.
- Host no-shows counted as prospect no-shows. Two different problems, two different owners, one metric.
- Reschedules counted as new requests. This inflates the denominator, deflates every rate, and hides genuine recovery.
What published benchmarks can and cannot tell you
Published demo benchmarks describe the population, definition and period their publisher disclosed, and nothing more. Two large datasets dominate this subject, and they are not comparable with each other or with yours.
| Chili Piper, February 2025 | RevenueHero, February 2026 | |
|---|---|---|
| Sample | Nearly 4,000,000 submissions | More than 1,000,000 inbound submissions |
| Data period | Calendar year 2024 | Calendar year 2025 |
| Population | Chili Piper customers | RevenueHero customers, B2B SaaS-heavy |
| Headline rate | 66.7% qualified-to-booked | 62% median qualified-to-booked |
| Disqualification published | Yes, 14.1% | Not in the headline figures |
| Held-meeting benchmark | No | Named as a metric, no benchmark published |
| Weighting | Not disclosed | Volume-weighted |
Averaging those two numbers would be a category error, and we have deliberately not done it. What you can do is derive something neither publisher printed. Chili Piper reported 561,977 disqualifications representing 14.1% of submissions, which implies roughly 3,985,652 submissions and 3,423,675 qualified records. Applying its own 66.7% booking rate gives about 2,283,592 booked meetings, so the submission-to-booked rate is 57.3%, or 9.4 points below the headline. Both numbers are correct. They answer different questions, and only one of them is the number a marketer comparing their own form performance actually wants.
RevenueHero’s 2026 benchmark deserves credit on the point most of this field gets wrong: it separates qualified-to-booked from request-to-held and warns that booking gains can coexist with worse downstream conversion. The same company’s growth-lever article does the opposite, claiming a customer moved from 34% to 58% and added $2.5 million in pipeline, with no cohort, no period and no source for any figure in the piece. A customer example is not an experiment, and demo conversion is not automatically anyone’s largest growth lever; whether it is depends entirely on where your held-equivalent leakage actually sits.
Before you benchmark yourself against either dataset, check that your own rate answers the same question theirs does. Almost none do on the first attempt, which is why our lead-to-meeting benchmark reference keeps every published rate attached to its lead definition, motion, endpoint and sample rather than printing a single tidy figure.
The 30-day demo conversion audit
Week one is measurement: reconcile submits to CRM records to meeting objects, and record every gap. Week two is quality: set the opportunity guardrail and sample 50 rejected records for false negatives. Week three is capacity: audit routing completion, owner eligibility, slot count and earliest slot across a live sample. Week four is the calculation and one experiment, chosen from the graded matrix, with its guardrail written down before it starts.
The worksheet below carries all of it: a funnel calculator with the leakage and priority formulas already built, the stage diagnostic, the graded intervention matrix, the event and field map, the public source ledger and an experiment log. No hidden benchmark defaults sit inside it, and every input cell is yours to change.
Download the IVRIS Demo Conversion Audit Worksheet (XLSX), and the public source ledger (CSV) if you want to check our evidence grading against the originals.
Methodology, sources and revision history
How the evidence was graded
Every source was scored on six transparency criteria: sample disclosed, population defined, data period disclosed, metric defined, methodology available and primary source accessible. Transparency was scored separately from causal strength, because a vendor report can be fully transparent and still be descriptive and self-selected. Repeated citations of one underlying study were treated as one evidence path rather than independent confirmation. Every source in the ledger was re-fetched and re-verified on 24 July 2026.
What is excluded and what limits apply
No universal demo conversion benchmark appears on this page, because the public figures start at different events, end at different events and describe different populations. No published vendor uplift has been applied to any calculation. The funnel calculator produces deterministic scenarios from inputs you supply; it does not estimate causal effects, and capacity constraints can invalidate its results. The healthcare reminder evidence is used directionally and its effect size is not transferred to B2B. One source in the ledger, a scheduling vendor’s calendar-availability documentation, returned an HTTP 403 to automated retrieval and is recorded as excluded rather than cited. The Harvard Business Review article is paywalled beyond its opening.
Citation, review date and revision history
Suggested citation: IVRIS, Demo-Funnel Diagnostic Framework and Public Evidence Ledger, updated 24 July 2026. The original organizations retain ownership of their research; the IVRIS contribution is the state model, the leakage calculation, the evidence grading and the transfer limits.
Last reviewed: 24 July 2026. Version 1.0. First publication. Review triggers: a new public B2B dataset above 10,000 submissions or meetings, a methodology correction or retraction by any cited publisher, a material change to scheduler or CRM behavior, the first randomized B2B trial of reminders or instant scheduling, or a material shift in the results ranking for this query. Scheduled review every six months, and immediately on any trigger.
Frequently Asked Questions
There is no defensible universal figure, because published rates start and end at different events. Two large scheduling-platform datasets report 62% to 66.7% of qualified inbound booking a meeting. Neither is a held-meeting rate, and neither describes companies that do not use those products.
Booked means a meeting object and invite exist. Held means the meeting reached its start time and the required attendee joined. Between them sit cancellation, reschedule and no-show, which are three separate states. Show rate must use meetings due as its denominator, never all bookings created.
No. The largest public dataset found conversion fell only slightly as field count rose, while field type mattered more: textareas and multiple dropdowns were associated with lower conversion. Removing a field that feeds a routing rule moves the loss downstream rather than eliminating it.
Only when three prerequisites hold: routing completes to an eligible owner, that owner has a connected calendar and a license, and at least one slot appears inside an acceptable lead time. Instant scheduling on a broken route relocates the failure rather than fixing it.
Separately, and never as leakage by default. A correct rejection is the qualification rule working. Only false negatives, meaning suitable prospects rejected by a bad rule or bad data, count as recoverable loss, and finding them requires auditing a sample of rejected records.





