
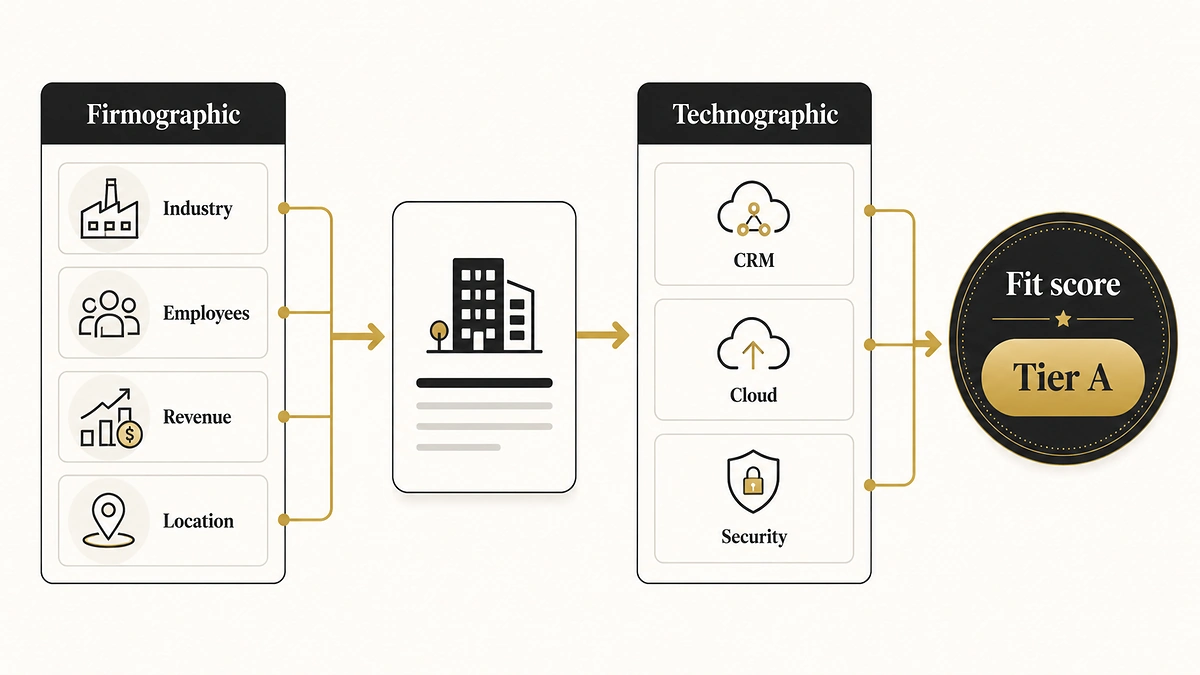
Most B2B teams can buy a list of 10,000 companies by lunch. The hard part is knowing which 200 are worth a rep’s time this quarter. That is the job firmographic and technographic data do together: firmographics tell you what a company is, and technographics tell you how it operates and what it already runs.
Used well, the two data types turn a generic total addressable market into a ranked, defensible target list. Used badly, they become expensive fields nobody scores on. This guide covers what each type is, the fields that matter, where the data comes from, and how revenue teams put it to work in ICP, segmentation, scoring, and routing.
Direct answer – What is firmographic and technographic data?
Firmographic data describes what a company is: its industry, employee count, revenue, location, and ownership. Technographic data describes what it runs: CRM, marketing automation, cloud, and security tools. B2B teams use the two together to define an ideal customer profile, segment accounts, and score leads. Firmographics set who could buy; technographics narrow to who fits. Neither shows buying timing, which is where intent data comes in.
Key Takeaways
- Firmographic data answers what a company is (industry, size, revenue, location, ownership). It sets the boundary of your addressable market.
- Technographic data answers what a company runs (CRM, martech, cloud, security). It reveals product fit, integration needs, and competitive displacement openings.
- The two work in sequence: firmographics define the pool, technographics rank it. Intent data then tells you when an account is actually in-market.
- The data only pays off when it feeds a decision: an ICP definition, an account tier, a lead score, or a routing rule.
- Both types decay. Technographic signals move fastest as companies swap tools, so refresh cadence matters more than one-time coverage.
What is firmographic data?
Firmographic data is company-level information used to describe and segment businesses by traits like industry, size, revenue, location, and corporate structure. It is the B2B equivalent of demographic data for people. Where demographics profile a person by job title and seniority, firmographics profile the organization those people work for.
These are the attributes that decide whether a company belongs in your market at all. A vendor selling enterprise procurement software does not care about five-person startups, no matter how much they might like the product. Firmographics draw that line before anyone wastes a call.
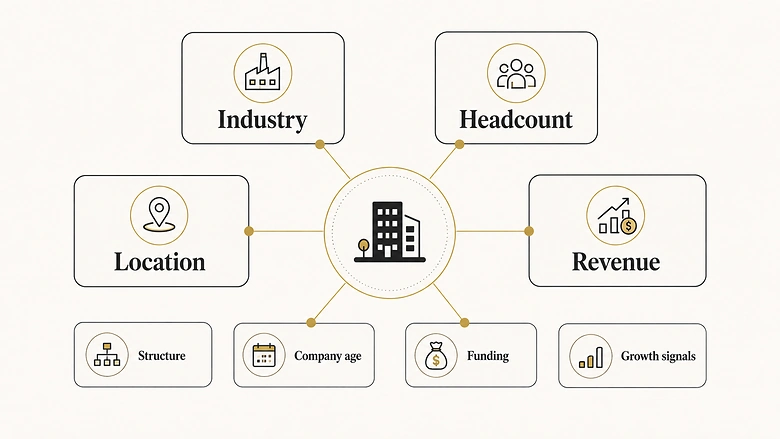
Common firmographic data fields
Most firmographic records center on the same core fields:
- Industry and sub-industry: the vertical plus a specific classification, often a NAICS or SIC code.
- Employee headcount: total size, and often department-level counts.
- Annual revenue: reported for public companies, modeled for private ones.
- Location: headquarters plus the countries or regions where the company operates.
- Corporate structure: public or private, parent and subsidiaries, and any private-equity or venture backing.
- Company age: founding year and maturity stage.
- Funding: stage, total raised, and most recent round for venture-backed firms.
- Growth signals: hiring pace, new office locations, funding rounds, and merger or acquisition activity.
An example of firmographic data: a 1,200-employee logistics company headquartered in Ohio, roughly $400 million in revenue, privately held, founded in 1998. Every attribute there is about the organization, not any individual inside it.
What is technographic data?
Technographic data is information about the technology a company uses to run its business: the software, platforms, and infrastructure in its stack. Where firmographics tell you the shape of a company, technographics tell you how it operates day to day.
This matters because two companies with identical firmographics can run completely different stacks, and that difference often decides whether your product fits. A prospect already running Salesforce is a very different conversation for an integration vendor than one running a homegrown database. Technographic data also carries timing clues that firmographics never do, like a contract renewal window that hints at when a company might switch tools.
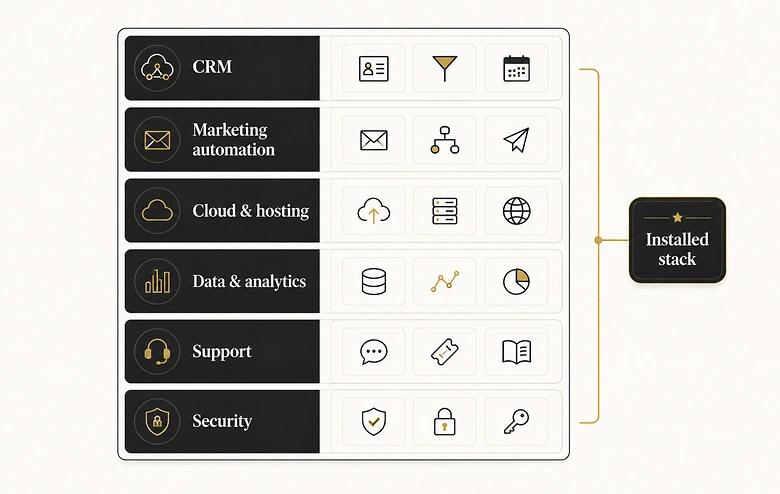
Common technographic data fields
Technographic records track both which tools a company uses and how it uses them:
- CRM: Salesforce, HubSpot, Microsoft Dynamics.
- Marketing automation: Marketo, Pardot, HubSpot, Eloqua.
- Sales engagement: Outreach, Salesloft, Apollo.
- Cloud and hosting: AWS, Azure, Google Cloud.
- Data and analytics: Snowflake, BigQuery, Tableau, Power BI.
- Support and CX: Zendesk, Intercom, Freshdesk.
- Security and identity: Okta, CrowdStrike, Cloudflare.
- Ecommerce and payments: Shopify, Magento, Stripe.
Beyond the list of tools, richer technographic data adds depth of adoption, install date, contract renewal windows, and estimated IT spend. An example: knowing that same logistics company runs Salesforce for CRM, Marketo for email, and AWS for hosting, renewed its Marketo contract three months ago, and recently posted three jobs asking for Snowflake experience.
Firmographic vs technographic data: what actually differs
Firmographic data tells you what a company is; technographic data tells you what it runs. The two answer different questions and behave differently once they sit in your CRM. Both also differ from demographic data, which profiles the individual buyer (job title, seniority, department) rather than the organization. Most account targeting uses all three layers: demographic for the person, firmographic for the company, and technographic for the stack. Those same layers resolve identity in reverse when you merge duplicate records into one account, since a shared domain plus matching firmographics is what confirms two records are the same company. None of the three becomes first-party data by arriving in your database, which is why provenance belongs to the field rather than the database holding it once legal or a quality review starts asking where a value came from.
| Attribute | Firmographic data | Technographic data |
|---|---|---|
| What it answers | What kind of company is this? | What does this company run? |
| Example fields | Industry, headcount, revenue, location | CRM, cloud, martech, security tools |
| Unit of analysis | The organization | The technology stack |
| Typical sources | Filings, business registries, aggregators | Website scans, job posts, integrations |
| Rate of change | Slow (funding, mergers, layoffs) | Fast (tools get added and dropped) |
| Best used for | Sizing the market and setting ICP boundaries | Product fit, integrations, displacement |
| Blind spot | Says nothing about tooling or timing | Says nothing about company size or timing |
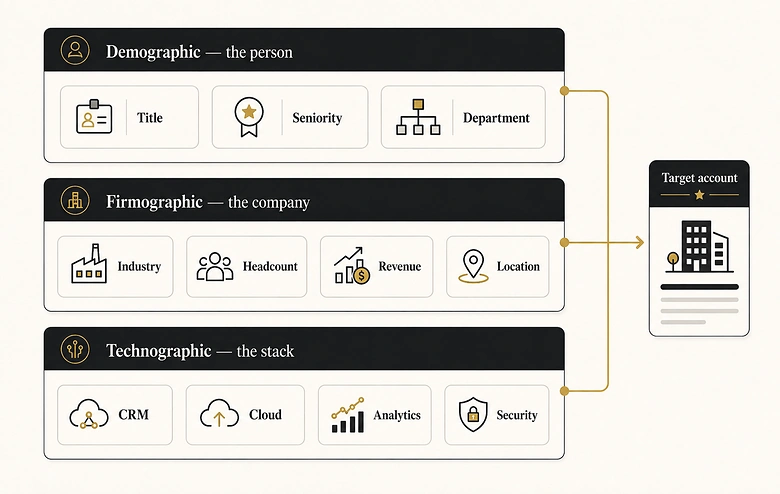
The practical read on that table: firmographics are the filter you apply first, and technographics are the ranking you apply second. One decides if a company is even in your market; the other decides how good a fit it is once it clears the bar. Skip the firmographic filter and you rank companies that were never viable; skip the technographic ranking and every in-market company looks equally good, which is rarely true.
Where firmographic and technographic data come from
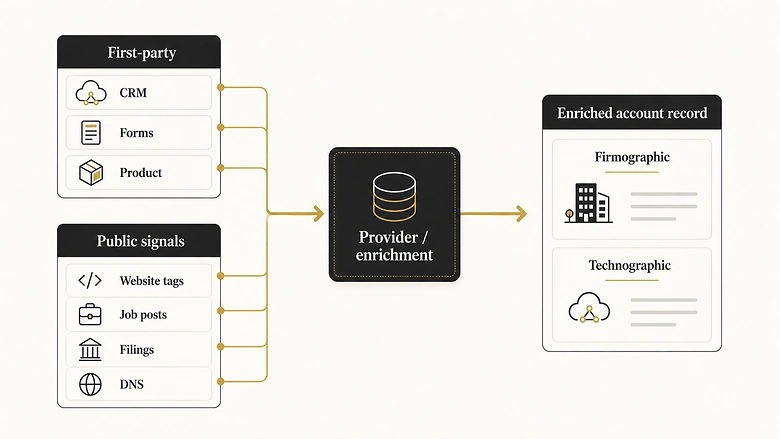
Firmographic and technographic data come from a mix of first-party records, public sources, and third-party providers that scan, infer, and aggregate signals at scale. No single source is complete, which is why most teams blend several. Blending is also why the published numbers stop being comparable, because a waterfall querying fifteen providers and a single database reporting the same fill rate are not measuring the same thing, and almost no provider states which population its figure came from.
First-party sources
Your own CRM, form fills, product usage, and sales-call notes are the most accurate data you have, because customers told you directly. The limit is coverage: first-party data only exists for accounts you have already touched, so it cannot size a market you have not sold into yet.
Third-party and public sources
Firmographic data is compiled from business registries, regulatory filings, credit databases, and news. Technographic data is inferred from public signals: providers scan company websites for code and tracking tags, read job postings that name specific tools, and pull from app marketplaces, integration directories, and DNS records. A posting that asks for a “Salesforce Administrator” is a strong tell that the company runs Salesforce.
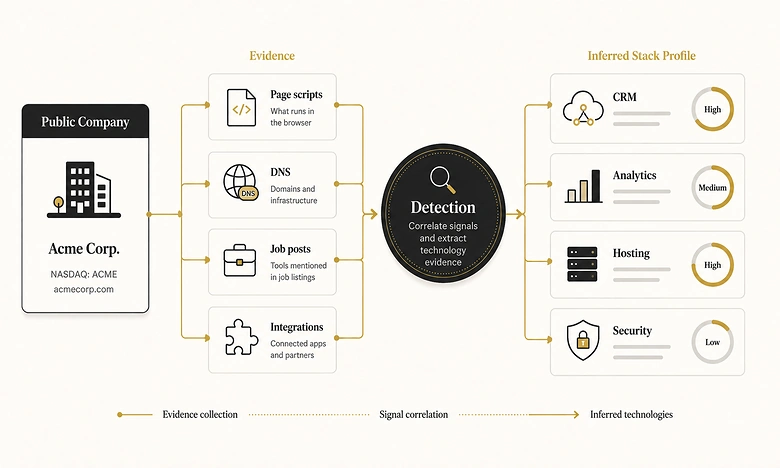
Because coverage and freshness vary by provider, most teams append and refresh these fields continuously through B2B data enrichment rather than buying a static list once. A few tools specialize in detecting technology stacks in particular:
What to look for in a data provider
Most teams buy at least some of this data, and providers vary widely on the things that decide whether it earns its cost. Judge a firmographic or technographic data provider on five points:
- Coverage: how many companies in your target market the provider actually holds records for, not the global total on the marketing page.
- Accuracy and match rate: how often a record is correct, and how many of your existing accounts it can match and fill in.
- Refresh cadence: how often fields are re-verified, which matters most for fast-moving technographic data.
- Field depth: whether technographic records go past “uses Salesforce” to adoption level, install date, and renewal timing.
- Integration and compliance: whether it pushes cleanly into your CRM and sourced its data in line with GDPR and similar rules.
Run a free sample against 100 of your own accounts before signing anything. A provider that looks strong on its own dashboard can miss half your market in practice.
IMPORTANT
Both data types decay, and technographic data decays fastest. Published annual decay figures run from 22.5% to 70.3% depending on which field is counted and how the rate is annualised, so a record you bought a year ago is already part wrong in ways no single number captures; our CRM data decay statistics page separates them. Treat freshness, not raw coverage, as the measure that matters.
How B2B teams use firmographic and technographic data
B2B teams use firmographic and technographic data to turn a broad market into a ranked set of accounts, then to decide who gets attention and how. Four uses cover most of the value.
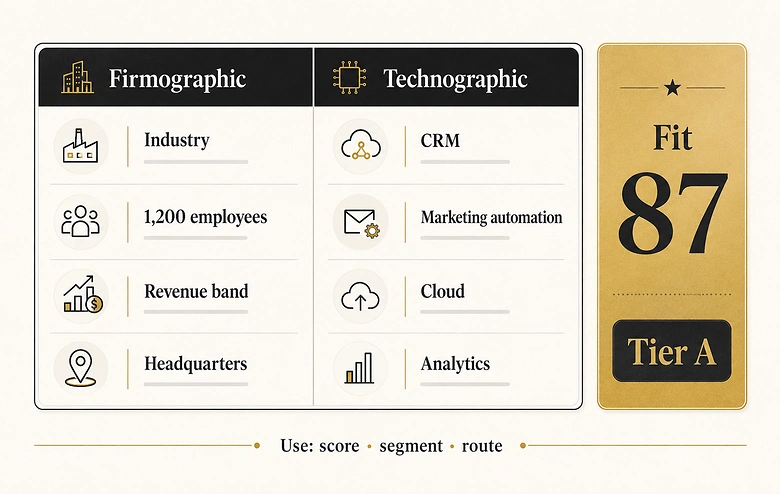
Here is the sequence on one account. A firmographic filter flags a 2,000-person medical-device maker in your target region as the right size. Technographic data shows it runs a CRM you integrate with and a competitor’s analytics tool you could displace. That combination pushes the account into Tier A, adds fit points to its lead score, and routes it to a senior rep with a displacement pitch ready. Same record, four decisions.
Define and sharpen your ICP
Pull your closed-won accounts, find the firmographic and technographic attributes they share, and write those patterns into your targeting. The same attributes become the backbone of an ideal customer profile for a specific vertical, and then the criteria in a weighted ICP scoring rubric that ranks new accounts against your best customers. The tighter that pattern, the less time reps waste on accounts that were never going to close.
Segment and prioritize accounts
Tier your market by combining firmographic fit (right size, right industry) with technographic fit (runs a complementary tool, or a competing one you can displace). A Tier A account matches on both; a Tier C account matches on size but runs nothing your product touches. Segmentation like this tells reps where to spend the first hour of the day, and it is the foundation of account-based marketing, where firmographic and technographic fit decides which named accounts earn a coordinated, multi-touch play. All of that assumes you matched the account correctly in the first place, and the company name is the least reliable field to match on — three separate registered entities share the name “Bank of China Limited”.
Score and route leads
Firmographic and technographic attributes become inputs to a lead score, where each signal carries a point value in your B2B lead scoring criteria. A prospect in your target industry and size band earns points; one running a technology your product integrates with earns more. The score then drives routing: high-fit accounts go straight to a rep, the rest drop into automated follow-up.
Account Fit Score = (Firmographic Match × Weight) + (Technographic Match × Weight)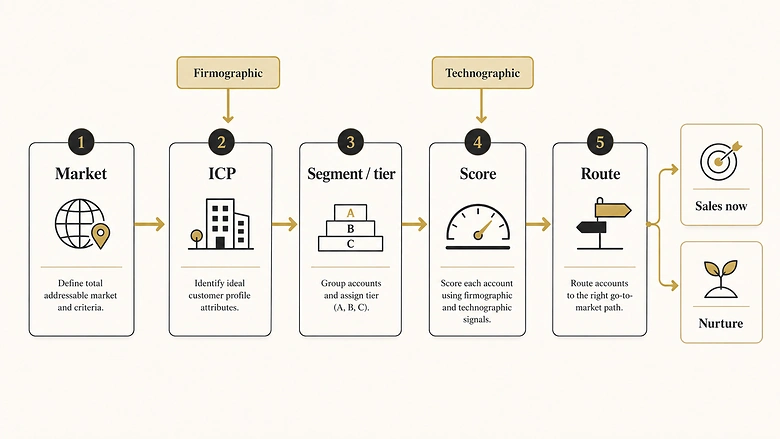
Run competitive displacement and compatibility plays
Technographic data drives two targeting moves firmographics cannot. Displacement means finding accounts on a competitor’s tool and reaching out with messaging aimed at that tool’s known weak spots. Compatibility means finding accounts already running a technology yours integrates with, where the technical fit is obvious and rollout is fast. A payments vendor, for example, can prioritize every account running a specific ecommerce platform it already plugs into.
PRO TIP
Do not score on a field you cannot act on. If your sales motion is identical whether a company runs AWS or Azure, that field is trivia. Keep the attributes that change what a rep says or does, and drop the rest before they clutter the model.
Common mistakes with firmographic and technographic data
The data fails in predictable ways. Four mistakes account for most of the wasted spend.
- Trusting stale technographic data. A stack detected eighteen months ago may be gone. Old technographic data is worse than none, because it reads as precise while being wrong.
- Over-filtering on firmographics. Tight revenue and headcount bands feel safe, but they quietly cut fast-growing accounts that will fit next quarter.
- Buying coverage instead of freshness. A bigger database is not a better one. A smaller set of recently verified records beats millions of aging ones.
- Treating fit as timing. A perfect firmographic and technographic match still says nothing about whether the account is buying right now.
Where fit data stops: adding intent
Firmographic and technographic data establish fit, not timing. They show which accounts could buy, not which are shopping right now. A perfect-fit account that is not looking is still a cold call.
That gap is what intent data fills: signals like content consumption, review-site activity, and search behavior that flag an account moving into a buying cycle. Pairing fit with B2B intent data tells you not just who to target but when to reach out.
A simple sequence keeps the three layers in order:
- Start with firmographics to draw the boundary of your addressable market.
- Add technographics to rank fit and surface displacement plays.
- Layer intent to time outreach to accounts already in-market.
Frequently Asked Questions
A firmographic data point describes a company as a whole. Examples include a business having 500 employees, $50 million in annual revenue, a headquarters in Texas, an industry of commercial construction, and private ownership. Each fact is about the organization, not about any single person who works there.
Demographics describe individual people by traits like age, job title, seniority, and department. Firmographics describe organizations by traits like industry, employee count, and revenue. In B2B targeting you use both: firmographics to pick the right companies, and demographics to reach the right decision-makers inside them.
A technographic data point names a technology a company uses. Examples include running Salesforce as its CRM, HubSpot for marketing automation, AWS for cloud hosting, and Okta for identity. Deeper technographic data adds context, such as when a contract renews or how heavily a tool is adopted.
Technographic data is gathered mainly by scanning public signals. Providers detect code and tracking tags on company websites, read job postings that name specific tools, and pull from app marketplaces, integrations, and DNS records. Buying from a specialized provider is faster and broader than tracking stacks by hand.
Refresh on a rolling basis rather than once a year. Technographic data changes fastest, since companies add and drop tools constantly, so many teams re-verify it quarterly. Firmographic fields like revenue and headcount shift more slowly but still need updates after funding, hiring, or acquisitions.
Your first move
Pull your last 50 closed-won accounts and list the firmographic and technographic attributes they share. If a pattern holds across most of them, you have found the fields worth scoring on. Wire those into your ICP and your lead score before you buy another record, because data you never act on is just an expensive column in a spreadsheet.





