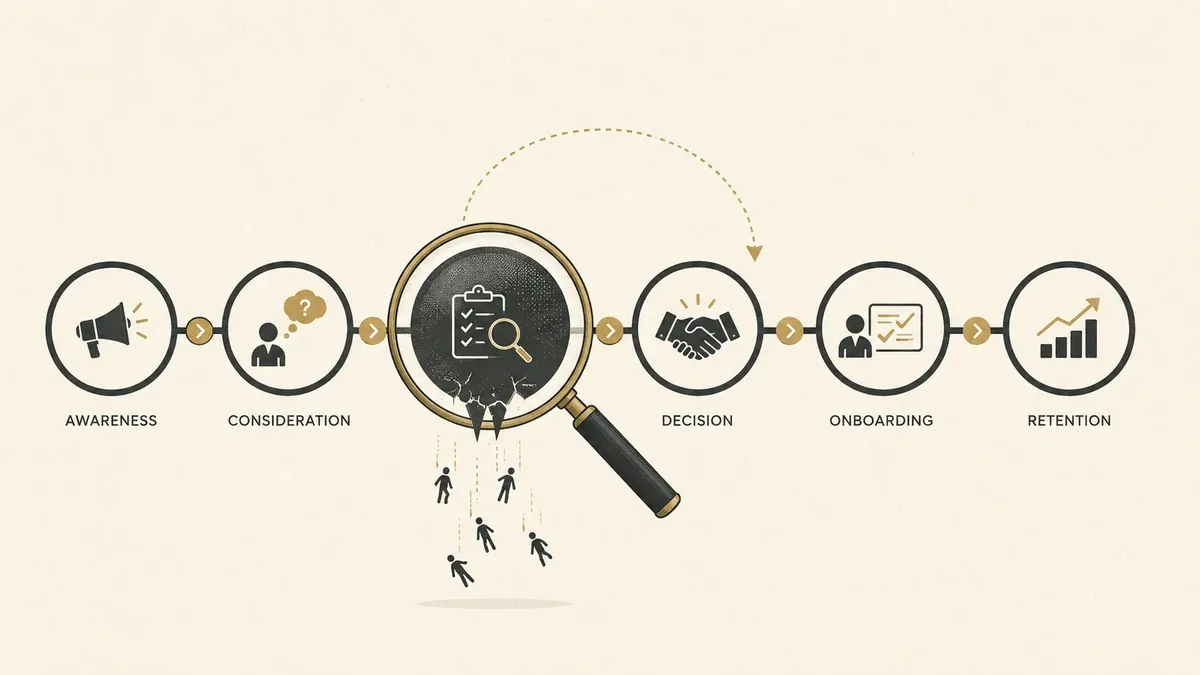
Most B2B buying journeys are quietly broken even when you win the deal. Forrester’s State of Business Buying, 2024, a survey of more than 16,000 buyers, found that 86% of purchases stall somewhere in the process and 81% of buyers end up dissatisfied with the provider they chose. Customer journey optimization is the discipline that finds where those journeys leak and fixes the stages that lose the most revenue.
The hard part is that most of the journey happens where you can’t see it. Gartner puts the time a B2B buyer spends with all potential suppliers combined at just 17% of the purchase, and as little as 5% with any single sales rep. If four-fifths of the decision runs on self-directed research, guesswork won’t tell you which touchpoint is bleeding pipeline. You have to instrument the journey, read the drop-off, and act on it, which is what this guide walks through stage by stage.
Direct answer — What is customer journey optimization?
Customer journey optimization is the ongoing practice of improving how customers move through every stage of their journey, from first touch to renewal, by finding friction and drop-off, prioritizing the highest-impact fixes, testing them, and measuring the lift. It works on the journey a map describes and uses journey analytics as its measurement input. It is not journey mapping, which is the picture, or generic funnel CRO, which is one conversion point; it improves the whole end-to-end path.
Key Takeaways
- Customer journey optimization improves the end-to-end path, not a single landing page or funnel step. The unit of work is the stage that loses the most customers, found in the data rather than guessed.
- B2B journeys leak differently than B2C. A buying group of six to ten people, spending only 17% of its time with suppliers, means the friction is mostly invisible and mostly self-serve.
- Measurement comes first. Journey analytics tells you where drop-off happens; optimization decides what to fix. Treating the two as one job is why most “optimization” is really guesswork.
- Prioritize by impact and effort, not by which stage annoys you most. The highest-traffic leak usually beats the worst-converting stage for recoverable revenue.
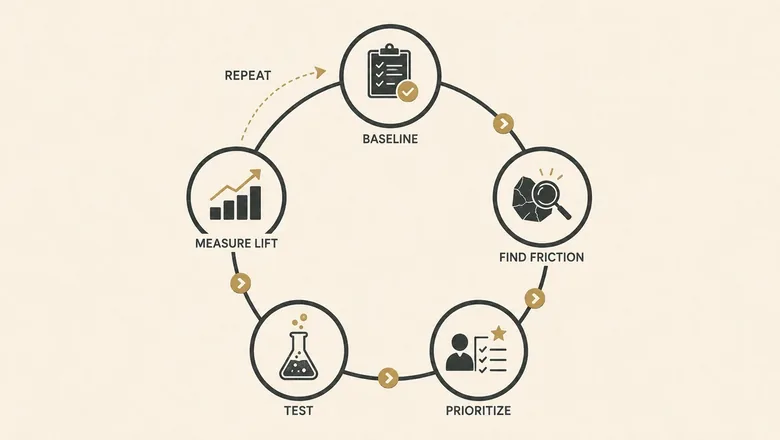
- Optimization is a loop, not a project: baseline, find friction, prioritize, test, measure lift, repeat, and tie every fix to pipeline or revenue instead of vanity metrics.
What customer journey optimization is (and what it isn’t)
Customer journey optimization is the practice of systematically improving each stage of the customer journey to reduce friction, lift stage-to-stage conversion, and grow customer lifetime value. It combines journey analytics, prioritization, and controlled testing so changes are driven by measured drop-off rather than opinion, and it treats the journey as one connected system rather than a set of isolated pages.
The term gets tangled with three neighbors that do related but different jobs. Journey mapping produces the picture of stages and touchpoints. Journey analytics measures what actually happens across them. Journey orchestration coordinates and delivers the right action at each step. Optimization is the improvement layer on top of all three: it reads the analytics, decides what to change, and proves the change worked.
| Discipline | What it is | Use it when | Don’t confuse it with |
|---|---|---|---|
| Journey mapping | A visual model of stages, touchpoints, and emotions | Teams need a shared picture of the journey to align | The map is not the improvement; a pretty map changes nothing on its own |
| Journey analytics | Measurement of behavior and drop-off across stages | You can’t yet say which stage loses the most customers | Data is a diagnosis, not a treatment |
| Journey orchestration | Coordinating and triggering the next best action per stage | The right action exists but isn’t reaching people | Delivering a step well is wasted if the step is wrong |
| Journey optimization | Improving the journey by fixing measured friction | You know where the leak is and need it to stop | It is not a one-time CRO test on a single page |
Use mapping when teams disagree about what the journey even is. Use analytics when you can’t name the stage that loses the most customers. Use orchestration when the right action exists but isn’t reaching people. Reach for optimization when you know where the leak is and need it to stop. In practice you cycle through all four, but only optimization is judged on whether a number moved.
Why B2B customer journeys leak differently
A B2B customer journey leaks differently than a consumer one because the decision is made by a group, stretched over months, and mostly hidden from the vendor. Optimizing it means designing for a buying committee and a long, self-directed research process, not a single shopper clicking buy. The underlying B2B customer journey is therefore a committee system before it is a conversion path.
Gartner’s research on the B2B buying journey describes a typical buying group of six to ten decision-makers, each arriving with four or five independently gathered pieces of information they then have to reconcile. Every extra stakeholder is another place the journey can stall. That’s why a B2C playbook built around one person’s path rarely transfers: you aren’t removing friction for a buyer, you’re removing it for a committee.
The second difference is visibility. When buyers spend as little as 5% of their time with any single rep, and 67% now say they’d prefer a rep-free buying experience (Gartner, March 2026), most of the journey happens in the dark funnel of peer forums, review sites, and search. You optimize what you can measure, so the first job is making those invisible stages visible.
Inside your own funnel, the most reliable leak is the handoff between marketing and sales. A lead marked ready that a rep never works, or works two weeks late, is friction you created; getting the MQL-to-SQL handoff and the SLA that enforces it right is usually the highest-value stage to fix first.
IMPORTANT
Don’t optimize a B2B journey with B2C conversion tactics. Countdown timers, one-click checkout, and cart-abandonment emails assume a single impulsive buyer. A committee evaluating a six-figure contract needs consensus tools, proof, and internal-champion enablement, not urgency nudges.
With that context set, here is the loop the rest of this guide follows: baseline the journey, find the friction, prioritize the fixes, test them, and measure the lift, then run it again.
Step 1: Baseline the journey as it actually runs
To optimize a journey you first have to baseline it: define the stages, list the touchpoints in each, and attach a metric to every stage so you have a number to move.
Most B2B journeys fit a familiar arc whatever labels you use: awareness, consideration, evaluation, decision, onboarding, and retention or advocacy. Kotler’s 5 A’s model (aware, appeal, ask, act, advocate) maps to the same shape. The exact stage names matter less than agreeing on them and on where one ends and the next begins, because that boundary is where you measure drop-off.
If you already run a structured funnel, use it as the skeleton. The stages in a six-stage B2B funnel give you the checkpoints to instrument; the journey view just adds the pre-funnel dark-funnel touches and the post-sale stages a funnel usually ignores.
Baseline each stage with one primary metric plus the timestamp of entry and exit. Stage-to-stage conversion tells you how many advance; time-in-stage tells you where they stall. Without this baseline you can’t later tell whether a change helped, and “we optimized the journey” stays a story instead of a result.
Step 2: Find the friction and drop-off in every stage
Finding friction means reading your journey analytics for the stages where customers slow down, drop out, or double back, then ranking those leaks by how much they cost.
This is where journey analytics does the work. Funnel and path reports show the exact step where entries fall off; segment those reports by persona, channel, and deal size, because a journey that converts fine for SMB self-serve can be badly broken for enterprise committees. Quantitative drop-off tells you where; qualitative signals tell you why.
Weigh a few signals per stage rather than one. Stage-to-stage conversion and time-in-stage locate the leak; customer satisfaction (CSAT), Net Promoter Score, and first-contact resolution rate explain the friction behind it. Pair those with the numbers in your core marketing KPI set so the journey view reconciles with pipeline reporting instead of contradicting it.
For multi-touch B2B journeys, attribution is the diagnostic that connects a touchpoint to a downstream deal. Knowing which stage a stalled opportunity last engaged with, and through which channel, turns “engagement dropped” into a fix you can aim; the tradeoffs between models sit in our guide to B2B attribution software.
The mechanics of finding the worst leak are simple enough to run in an afternoon.
Workflow · 20 min
How to find your highest-drop-off journey stage
A five-step desk exercise that pinpoints the journey stage costing you the most pipeline, using data you already have.
Pull a stage funnel report
In your analytics tool, build a funnel with one step per journey stage over the last 90 days, or a window long enough to cover your sales cycle.
Rank stages by conversion loss
Calculate the drop-off between each pair of stages. The largest absolute number of people lost, not the lowest percentage, is usually the biggest opportunity.
Segment the worst stage
Break that stage down by persona, channel, and deal size. A leak concentrated in one segment is a more fixable problem than an even one.
Isolate the friction
For the worst segment, watch session recordings, read support tickets, and check the survey comments tied to that stage. Name the specific obstacle.
Size the prize
Multiply the recoverable drop-off by stage traffic and average deal value to estimate the revenue at stake. That number decides whether the fix is worth it.
Step 3: Prioritize the fixes by impact and effort
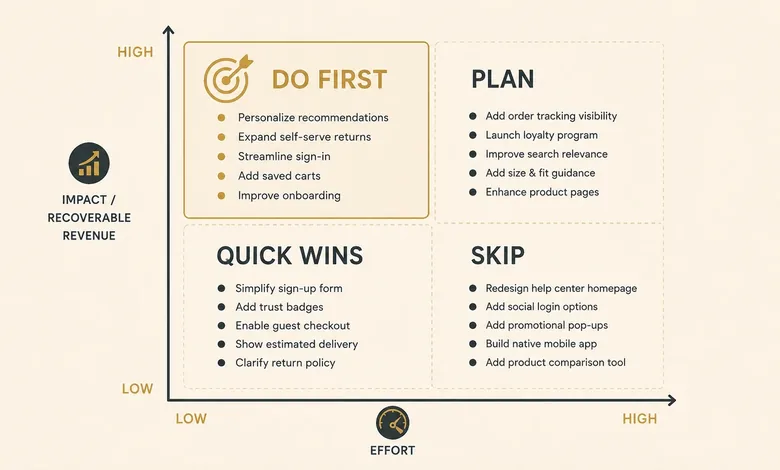
Prioritizing fixes means scoring each identified leak by the revenue it could recover and the effort to fix it, then working the list from the top instead of fixing whatever is loudest. Scoring a leak by the revenue it could recover assumes you can trace revenue back to the stage that earned it, which is a customer journey attribution problem.
Start from a map of the usual suspects. Each B2B stage has a characteristic failure and a signal that exposes it, and naming the fix is easier once you can see the pattern.
| Journey stage | Common B2B friction | Signal to measure | Fix |
|---|---|---|---|
| Awareness | Invisible in the dark funnel; buyers never shortlist you | Branded search volume, direct and organic entries, review-site mentions | Publish decision-stage content and get listed where committees actually research |
| Consideration | Content answers the vendor’s questions, not the buyer’s | Time-in-stage, content engagement by persona | Reframe assets around buyer jobs; add comparison and proof content |
| Evaluation | The committee can’t build internal consensus | Multi-contact engagement per account, stalled-deal rate | Give champions enablement kits: ROI models, security docs, mutual action plans |
| Decision | The handoff drops or delays the qualified lead | MQL-to-SQL conversion, speed-to-lead | Enforce an SLA and route qualified leads instantly |
| Onboarding | Time-to-first-value is too long; early churn | Activation rate, time-to-value | Shorten setup and define a clear activation milestone |
| Retention / advocacy | No trigger to expand or refer | Net revenue retention, NPS, referral rate | Build lifecycle triggers for reviews, expansion, and referral asks |
Turn that table into a ranked backlog with a simple score, so the biggest recoverable leak that takes the least work rises to the top.
Priority = (Estimated Conversion Lift × Stage Traffic × Deal Value) ÷ EffortPRO TIP
Fix the highest-traffic leak before the worst-converting one. A stage that converts at 20% but sees 10,000 people usually hides more recoverable revenue than a stage that converts at 3% but sees 200. Rank by absolute customers lost, not by the ugliest percentage.
The size of the prize also depends on the quality of leads entering the stage. The same fix pays back far more when the traffic is warm, which is why the gap between warm and cold lead conversion should weight your priority score, not just raw volume.
Step 4: Test the fix, and respect the limits of B2B testing
Testing a fix means running it as a controlled change against a holdout, so any lift can be attributed to the fix rather than to the season, the quarter, or luck.
Where you have volume, A/B test. A pricing page, a demo-request flow, or an onboarding email sequence often has enough traffic to split cleanly. Change one thing, hold everything else steady, and let it reach significance before you call it.
But be honest about B2B volumes. A journey stage that sees 300 enterprise accounts a quarter will never reach clean statistical significance on a classic A/B test, and pretending otherwise produces confident nonsense. For low-volume stages, use holdout groups, pre/post comparison against a matched baseline, or sequential rollouts by segment, and lean harder on qualitative evidence. A fix that removes an obstacle five champions described in interviews is worth shipping even without a p-value.
Not every fix is a UI tweak; often the friction is missing information. Gartner found that buyers who see the information a supplier gives them as genuinely helpful in moving their buying jobs forward are three times more likely to buy the bigger deal with less regret. Testing better enablement content is journey optimization too, even when the interface is a sales conversation.
Step 5: Measure the lift and make optimization continuous
Measuring lift means comparing the stage’s performance after the fix against its own pre-fix baseline, in absolute terms, and checking that the gain didn’t just push the problem to the next stage.
Report lift the way finance reads it: the stage moved from X% to Y%, which at current traffic is N more opportunities and roughly $M in pipeline per quarter. A conversion percentage on its own doesn’t survive a budget meeting; the pipeline number does.
Every optimization can improve one stage while quietly harming the next. Watch a downstream guardrail metric on every change, or you’ll celebrate a conversion lift that shipped worse-fit deals to sales.
Then do it again. The journey moves: buyers change, competitors ship, your product evolves, so last quarter’s smooth stage becomes this quarter’s leak. Treat optimization as a standing quarterly loop with a living backlog, not a project that closes. The teams that compound gains are the ones that never declare the journey finished.
The customer journey optimization stack
The customer journey optimization stack is the small set of tools that let you see the journey, test changes on it, and hear from customers along the way: journey analytics, experimentation, and voice-of-customer feedback.
You don’t need a new platform for each. Product and web analytics tools handle the seeing; experimentation tools handle the testing; survey and session tools handle the listening. Most teams already own two of the three and just aren’t pointing them at the journey.
Pick for the stage you’re optimizing, not for the logo. If the leak is in a digital self-serve flow, path analytics and session replay matter most. If it’s in a committee evaluation, the most useful “tool” is often an enablement document, not software. The stack serves the diagnosis; it doesn’t replace it.
Where B2B teams get journey optimization wrong
The most common way to get journey optimization wrong is to do everything except the part that moves a number.
The first mistake is mapping without measuring. A workshop that produces a beautiful journey map and no instrumentation has produced art, not optimization. The map is a hypothesis; if nothing downstream counts the drop-off, you’ve spent a week agreeing on a picture. The loudest critics of journey mapping are right about this specific failure and wrong to write off the whole discipline. Mapping plus measurement plus a fix is the point.
The second is optimizing vanity stages. It feels productive to lift a top-of-funnel click-through, but if the leak costing real pipeline is a stalled evaluation stage, you’re polishing the wrong step. Rank by revenue at stake, every time.
The third is treating the committee as one buyer. A fix that delights the champion but gives the CFO nothing to justify the spend doesn’t advance the deal. Optimize for consensus, not just the primary contact.
The last is running it once. Optimization that isn’t a standing loop decays; the journey you fixed in Q1 has new friction by Q3. Put it on a cadence, or watch the gains erode.
Frequently Asked Questions
Journey mapping is the visual model of the stages and touchpoints a customer moves through; journey optimization is the work of improving that journey by fixing measured friction. Mapping is a picture and a hypothesis. Optimization reads the analytics, changes the highest-impact stage, and proves the change lifted conversion, retention, or revenue.
The core metrics are stage-to-stage conversion, time-in-stage, and journey completion rate, paired with experience signals like CSAT, NPS, and first-contact resolution. For B2B, add MQL-to-SQL conversion, sales-cycle length, and net revenue retention. The metric that matters most is the recovered pipeline or revenue a specific fix produces.
B2B journeys are optimized for a buying group of six to ten people, a months-long cycle, and a mostly self-directed process where buyers spend only about 17% of their time with suppliers. The friction is consensus and information, not impulse, so the fixes are enablement, proof, and clean handoffs rather than urgency tactics.
Most B2B journeys have six stages to optimize: awareness, consideration, evaluation, decision, onboarding, and retention or advocacy. Kotler’s 5 A’s (aware, appeal, ask, act, advocate) describe the same arc. The exact labels matter less than instrumenting the boundary between each stage so you can measure where customers drop off.
Find the stage with the largest drop-off in your journey analytics, isolate the specific obstacle with session data and customer feedback, then remove it and measure the lift against a baseline. Shortening the journey is rarely about speed tricks; it’s about deleting the steps and unanswered questions that make buyers stall.