Search for account based marketing benchmarks and you’ll get confident numbers within seconds. ABM lifts win rates 86% of the time. It raises average contract value by 171%. It returns 200%+ ROI, or 137%, depending on which page you land on. Every one of those figures is published. Most of them are repeated without a sample size anywhere near them.
We traced them. Across the five pages currently ranking for this term there are roughly 86 numeric ABM benchmarks, and not one states how many companies it measured. Two of the most-quoted figures come from a research firm that stopped existing in 2019.
This page used to repeat four of those numbers itself. That was the wrong thing for a page about measurement to do, so the first half now reports what each benchmark actually counted, and the second half keeps the metric definitions, formulas and dashboard guidance that were here before. If you want the wider account-level picture, our ABM campaign operations piece covers execution and our B2B marketing metrics guide covers funnel volume.
You’ll need both halves. Benchmarks tell you what other people claim. Your own ABM instrumentation tells you what’s true in your business, and for subscription models that means reading account engagement against SaaS marketing metrics so the program stays tied to revenue efficiency.
Direct answer — What are the benchmarks for account-based marketing?
There is no independently verified set of ABM benchmarks. The widely quoted figures come from vendor-sponsored practitioner surveys, small qualitative interview studies, or platform data drawn from a single vendor’s customers. Sample sizes range from 50 phone interviews to 1,452 software instances, and most published figures state no sample at all. Use published ABM benchmarks as directional context, and measure lift against your own non-ABM accounts as the real comparison.
Key Takeaways
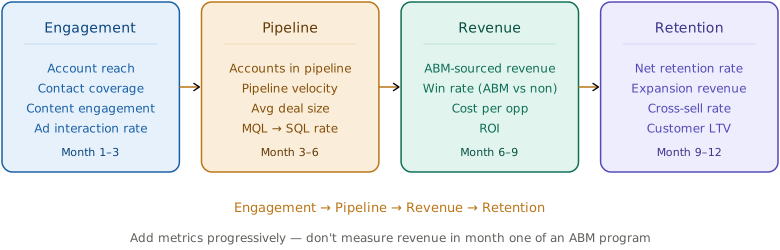
- ABM metrics fall into four categories: Engagement, Pipeline, Revenue, and Retention. Track at least two from each.
- Across the five pages ranking for this term, roughly 86 numeric benchmarks are published and none states a sample size.
- The “86% say ABM improves win rates” and “171% higher contract value” figures both trace to TOPO, a firm Gartner acquired in October 2019. The 171% came from 50 phone interviews.
- The only comparison that survives scrutiny is internal: ABM-targeted accounts against your own non-ABM accounts, over the same period.
- We withdrew two figures from this page because no source for them exists. Details are in the correction section below.
- Account Engagement Score remains the most useful leading indicator, because it tells you which accounts are warming before pipeline exists.
What ABM benchmarks actually measure
An ABM benchmark is a published figure describing how account-based programs perform on a given metric, usually drawn from a survey of marketers or from one vendor’s platform data. It is not an industry standard, and no standards body verifies it.
That distinction matters more in ABM than in most channels, because the people publishing the benchmarks are usually the people selling the software. A survey of ABM practitioners run by an ABM platform is a survey of that platform’s likely buyers, answering questions about a program they chose and defend.
Account-based marketing metrics themselves are performance indicators measured at the account level rather than the lead level, tracking how target accounts engage, move through pipeline, convert to revenue, and expand. Traditional marketing asks how many leads it generated. ABM asks how deeply target accounts are engaging and how fast they’re moving toward revenue.
That’s why MQL count, cost per lead and email open rates don’t transfer. They measure individual activity, and you’re trying to influence a buying committee rather than capture a single name. The account-level rates that do work, like win rate and penetration rate, are still one division underneath, and calculating an account-level win rate in SQL means grouping the conditional average by account instead of by lead.
The most-quoted ABM benchmarks, and where they came from
Below is every widely circulating ABM benchmark we could trace to a primary source, with what the original document actually said. The right-hand column tells you what to do with each one.
| The claim as you’ll meet it | Actual origin | Sponsor’s commercial interest | Sample | Method | Fielded / published | Verdict |
|---|---|---|---|---|---|---|
| 86% of marketers say ABM improves win rates | TOPO, Predictions for 2019, distributed by Terminus | Terminus sells ABM software; TOPO was acquired by Gartner in October 2019 | Not published | Self-reported, method never released | 2019 / 2019 | Don’t present as current |
| ABM increases average contract value by up to 171% | TOPO, ABM: State Of The Market, commissioned by the ABM Leadership Alliance | Vendor consortium; Demandbase is a member | 50 marketing executives | Qualitative phone interviews, self-reported | c. 2017 / c. 2017 | Quote n=50, or not at all |
| Well-executed ABM delivers 200%+ ROI | Forrester | Sells research and advisory, not ABM software | Not disclosed publicly | Self-reported share of respondents | 2024 / 2024 | Don’t state as absolute ROI |
| ABM win rates should be 15–30% higher | No traceable origin | — | None | None | — | Withdrawn from this page |
| 137% average ROI from ABM programs | Outcomes Rocket, a healthcare marketing agency | Sells marketing services | 771 marketers, Prolific paid panel | Mean of respondents’ own estimates | Oct 2025 / Nov 2025 | Call it an estimate, never a measurement |
| 93% say their ABM efforts were successful | Foundry, 2023 ABM Benchmarking & Intent Data Study | Sells intent data and ABM services to the audience surveyed | 500 marketers, 79% in tech and computer manufacturing | Self-assessment, top-two-box | Aug 2023 / Sept 2023 | Attach the sector and the 2023 date |
| 2.1× win rates when sales is involved early | No traceable origin | — | None | None | — | Don’t use |
| Buying-group alignment delivers 2–3× win rates | Demandbase, State of ABM 2026 | Sells ABM software; population is its own customers | 1,452 tenants, meaning Demandbase instances | Platform-measured plus modelling | 2025 / Mar 2026 | Keep the words “up to” and “tenants” |
| 81% say ABM delivers higher ROI than other activity | MomentumABM (formerly ITSMA), Global ABM Benchmark, sponsored by Demandbase | Sponsor sells ABM software | Over 300 B2B marketers | Self-reported practitioner survey | 2024/25 | Name the sponsor when you quote it |
Two patterns are worth noticing. The two oldest and most-repeated figures, 86% and 171%, come from the same research firm, and that firm has not published independently since 2019. And the single largest dataset in the table, Demandbase’s, is the one whose population is most tightly bounded: it measures the customers of one platform.

IMPORTANT
None of these studies measure the same population, so they cannot be averaged. Any page presenting a single cross-study “typical” ABM benchmark has invented it.
The four claims this page used to make
This page published four benchmark claims from its first version in March 2026 until this revision. All four are corrected below. We’re showing the work rather than quietly editing, because a page arguing for provenance should be auditable itself.
“According to HubSpot’s research, 86% of marketers say ABM improves their win rates.” This was wrong in three ways. It isn’t HubSpot’s research; HubSpot repeated it in a statistics roundup that credits Terminus. The underlying document is a TOPO Predictions for 2019 ebook distributed by Terminus, an ABM vendor. And the link pointed at a State of Marketing 2024 PDF that returns a 404 and never contained the figure. The claim is seven years old and no sample size was ever published for it.
“The ITSMA/ABM Leadership Alliance found that ABM programs can increase average contract value by up to 171%.” The figure is real but the attribution and the framing were not. It traces to TOPO’s ABM: State Of The Market, commissioned by the ABM Leadership Alliance around 2017, and it rests on phone interviews with 50 marketing executives. The original said annual contract value. MomentumABM, the firm ITSMA became, does not publish this figure in its current benchmark at all.
“According to Forrester’s research, well-executed ABM programs deliver 200%+ ROI.” Forrester’s finding is that 23% of respondents reported ABM ROI 51% to 200% higher than traditional marketing, while most reported 21% to 50% higher. That’s a relative lift over a comparator, not an absolute 200% return, and the top of a minority band was being presented as the typical outcome. The URL we cited was a podcast episode page, and it now 404s.
“ABM win rates should be 15–30% higher than your overall win rate.” We could not find a source for this, and the only page on the open web stating it in this form was this one. It appeared twice, including in the summary box. It has been withdrawn. Where 15–30% does appear in ABM research it means something else entirely: the absolute B2B win-rate range, the share of a target list in-market at any moment, or the cost premium of running ABM.
We also removed “2.1× win rates when sales is involved early”, which we had considered adding. It appears on one page, cites nothing, and no primary source states it.
Why ABM benchmark numbers disagree
Six mechanisms produce most of the spread. Recognising them is faster than checking every figure individually.
The sponsor sells the outcome. Most ABM research is funded by ABM platforms or by consortia of them. That doesn’t make the data false, but it shapes which questions get asked and which results get published.
The sample selects itself. A survey of ABM practitioners reaches people already committed to ABM. Programs that failed and were shut down are not in the denominator, so success rates like 93% describe survivors.
Self-report is treated as measurement. The 137% ROI figure is the clearest case: respondents were asked to estimate their own ROI, and the mean of those estimates became a published benchmark. Nobody audited a single one.
Fielding year is quoted as publication year. HubSpot’s 2024 report was fielded in September 2023 among 1,400+ B2C and B2B marketers. Foundry’s 93% was fielded in August 2023 and has no newer edition. Both circulate as current.
The unit changes in transit. Demandbase’s report says it analysed 1,452 tenants, and defines a tenant as a Demandbase instance. Its own headline says 1,452 companies. One company can hold several instances, so the two are not interchangeable, and the coverage that followed used the headline.
Hedges get dropped. Demandbase wrote that buying-group alignment delivers “up to” 2–3× higher win rates, and its report notes the benchmark rests on roughly one year of data. Downstream coverage prints “2–3× higher win rates” flat.
PRO TIP
Before quoting any ABM benchmark, find three things: who paid for the study, how many organisations it covered, and what year the data was collected. If a page won’t tell you all three, treat the number as marketing copy.
Which ABM benchmarks are safe to quote
These are the figures that survive tracing, with wording you can paste that keeps the scope attached.
| Statistic | Recommended wording | Scope that must stay attached |
|---|---|---|
| Buying group size | Forrester’s State Of Business Buying, 2026 reports that 13 internal stakeholders and nine external participants influence the typical buying decision. | Survey of nearly 18,000 global business buyers, fielded 2025. Two separate counts. Never add them into one committee size. |
| ABM ROI vs other marketing | Forrester found 23% of respondents reported ABM ROI 51–200% higher than traditional marketing, with most reporting 21–50% higher. | Relative lift against a comparator, self-reported, sample not publicly disclosed. Not an absolute ROI figure. |
| Contract value lift | TOPO’s ABM: State Of The Market, commissioned by the ABM Leadership Alliance, reported a 171% lift in average annual contract value. | 50 executives, qualitative phone interviews, c. 2017, vendor-commissioned. Say “annual”. |
| Buying-group alignment | Demandbase reports that organisations aligning around buying groups achieve up to 2–3× higher win rates than lead-centric teams. | 1,452 Demandbase instances, platform-measured and modelled, roughly one year of buying-group data. Demandbase customers only. |
| Practitioner sentiment | In Foundry’s 2023 study, 93% of 500 B2B technology marketers rated their ABM efforts extremely or very successful. | August 2023 fieldwork, 79% concentrated in tech and computer manufacturing, self-assessment. No newer edition exists. |
| Estimated ROI | In a 2025 panel survey of 771 marketers, respondents estimated average ABM ROI at 137%. | Respondents’ own estimates, recruited through a paid research panel. Not audited or measured. |
How we scored the evidence
Each study gets one point for publicly disclosing each of six things. The score measures whether you can audit the claim, not whether the research is good.
| Study | Sample | Population | Field period | Metric defined | Method | Primary source reachable | Score |
|---|---|---|---|---|---|---|---|
| Forrester, State Of Business Buying 2026 | Partial | Yes | Yes | Yes | Yes | Yes | 5/6 |
| Foundry, 2023 ABM Benchmarking Study | Yes | Yes | Yes | Yes | Yes | Partial | 5/6 |
| Demandbase, State of ABM 2026 | Yes | Yes | Partial | Partial | Yes | Yes | 4/6 |
| Outcomes Rocket, State of ABM 2025 | Yes | Partial | Yes | Yes | Yes | Yes | 5/6 |
| MomentumABM, Global ABM Benchmark 2024/25 | Partial | Partial | No | No | Partial | No | 1/6 |
| Demand Gen Report, ABM Benchmark Survey 2026 | No | No | No | No | No | No | 0/6 |
| TOPO, ABM: State Of The Market | Yes | No | No | No | Yes | No | 2/6 |
| TOPO / Terminus, Predictions for 2019 | No | No | No | No | No | No | 0/6 |

The result that surprised us: the lowest score belongs to a dedicated benchmark survey. Demand Gen Report’s 2026 ABM Benchmark Survey publishes percentages on its public page while stating no sample size, no field period and no methodology anywhere outside a gated form. Meanwhile 6sense’s 2026 BDR research discloses that 872 people responded, 490 completed, and that sample sizes vary by finding. That is a vendor doing it properly, and it is rare enough to name.
Limitations. Scores reflect what is public. Forrester’s and Demandbase’s full methodologies sit behind client access or forms, so both are scored on public materials. MomentumABM’s benchmark page moved behind a login in December 2025; we scored the last openly available version and say so. Absence of a source in indexed and archived material is strong evidence but not proof: a figure inside a paywalled PDF would be invisible to this method. Vendor-run studies carry selection effects we have labelled but cannot correct for.
The ABM metrics framework: 4 stages
With the evidence in view, here is the measurement half of the page. The most effective way to organise your account based marketing metrics is by funnel stage, because each stage answers a different question about program health.
| Stage | Question It Answers | Key Metrics |
|---|---|---|
| Engagement | Are target accounts paying attention? | Account Engagement Score, Account Coverage, Content Engagement |
| Pipeline | Are engaged accounts becoming opportunities? | Account Penetration Rate, Pipeline Velocity, Influenced Pipeline |
| Revenue | Are opportunities converting to closed revenue? | Win Rate, Average Deal Size, Target Account Revenue, ABM ROI |
| Retention | Are customers expanding and renewing? | Net Revenue Retention, Expansion Revenue, Customer Lifetime Value |
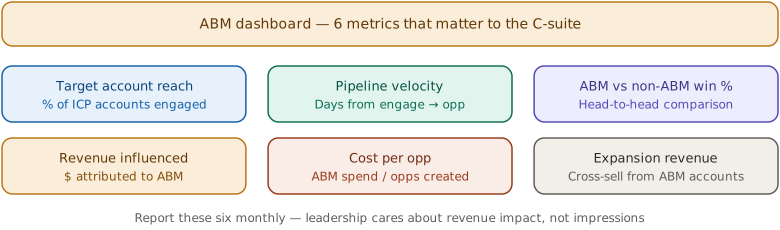
Track at least two metrics from each stage. If you only measure engagement, you won’t know whether it turns into pipeline. If you only measure revenue, you’ll miss the leading indicators. The same balance holds for content, where a content dashboard built on the same four-layer rule pairs reach and engagement signals with the conversion numbers that prove they paid off.
Each metric below carries two lines. What the evidence says reports any published figure with its scope attached, or states plainly that no independent benchmark exists. IVRIS working range is our own operating heuristic with the reasoning shown. The second is not research, and we don’t present it as any.
Engagement metrics: are target accounts paying attention?
Engagement metrics are leading indicators. They tell you whether campaigns are reaching the right people at the right accounts and whether those people are responding.
Account Engagement Score
An Account Engagement Score aggregates every interaction across an account: website visits, content downloads, email opens, ad clicks, event attendance, sales touches. Instead of scoring individual leads, you score the account. The aggregation logic gets vertical-specific weighting once you score regulated industries, and clinical-veto-weighted account scoring for healthcare assigns +40 to CMO, CNO and CQO engagement because clinical staff can block adoption regardless of executive sign-off.
How to calculate: Assign point values to each interaction type (website visit = 1 point, whitepaper download = 5, demo request = 20, meeting booked = 25). Sum across all contacts at the account. Weight recent activity higher than older activity.
What the evidence says: No independent benchmark exists. Scoring models are proprietary and the point scales aren’t comparable between companies, so a published “average engagement score” would be meaningless.
IVRIS working range: Compare rather than absolute. We look for ABM-targeted accounts scoring 2–3× non-targeted accounts on the same model. The reasoning is that the ratio cancels out the arbitrary point scale, which is the only part of the metric that transfers between companies.
Tools: 6sense, Demandbase, HubSpot and Terminus all include account scoring. If you’re building your own, use your CRM plus a tool like LeanData to roll contact-level activity up to the account.
Disclosure worth making plainly: several vendors listed above also publish the ABM benchmark research assessed earlier on this page. They are listed here as platforms in the category, which is a separate judgement from whether their research is auditable.
Account Coverage
Coverage measures how many of the decision-makers and influencers within a target account you’ve actually reached. If you’re engaging one person at a ten-person buying committee, your coverage is 10% and the deal is exposed. A number that low is more often a matching failure than a real absence, which is why crediting pipeline to the account rather than the lead starts by resolving every contact to one company record before counting anything.
Account Coverage = (Known contacts at account ÷ Total buying committee size) × 100What the evidence says: Forrester’s State Of Business Buying, 2026, based on a survey of nearly 18,000 global business buyers fielded in 2025, reports 13 internal stakeholders and nine external participants influencing a typical decision. Those are two separate counts and shouldn’t be summed. No study publishes a benchmark for what share of them a seller should reach.
IVRIS working range: 60–80% of the identified committee before sales makes a serious push. This is derived from the committee sizes above rather than measured: below roughly 60% you are usually missing an entire function, and above 80% the marginal contact is rarely a decision-maker. Set the denominator from your own closed-won deals, not from a published average.
Content Engagement by Account
This tracks which assets your target accounts consume: blog posts, case studies, webinars, product pages, pricing pages. The pattern tells you where an account sits in the buying journey. Reading that pattern across every touch is the job of measuring the journey at the account level, and turning it into revenue credit only holds up when attribution runs at the account level instead of crediting whichever contact filled in the form.
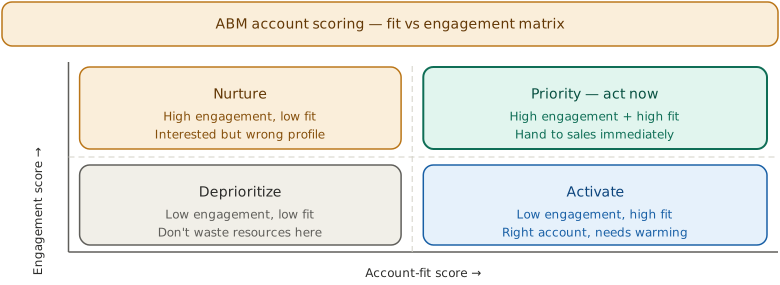
An account reading top-of-funnel posts is early. An account on your pricing page, reading case studies and attending a product webinar is in active evaluation. Engagement only means something against fit, so read every signal alongside how closely the account matches your manufacturing ICP, and against the firmographic and technographic attributes that define the segment in the first place. Detecting the shift into active evaluation at scale is what buyer intent data is built to do.
Pipeline metrics: are accounts becoming opportunities?
Engagement means nothing if it doesn’t convert. These metrics tell you whether the program is creating sales opportunities.
Account Penetration Rate
This measures what share of your target account list has entered the pipeline as active opportunities.
Penetration Rate = (Target accounts with open opportunities ÷ Total target accounts) × 100What the evidence says: No independently verified benchmark exists. Published penetration figures come from vendor platform data on self-selected customers, and the denominator depends entirely on how aggressively a company builds its target list.
IVRIS working range: 15–25% within the first year. This is a planning heuristic, not a finding: it assumes a target list sized to your sales capacity rather than to your total addressable market. A list twice as long halves the rate without anything changing operationally, so treat a low number as a list-sizing question first.
Pipeline Velocity
Velocity measures how fast deals move from opportunity creation to close. For ABM accounts this should beat your overall average, because the committee was warmed before the opportunity existed. Warming a committee at that speed is increasingly a machine job, and AI-driven ABM times each touch to signals a manual cadence can’t watch in real time.
Pipeline Velocity = (Number of opportunities × Average deal size × Win rate) ÷ Average sales cycle lengthWhat the evidence says: No independent benchmark. Vendor pages publish velocity ranges without stating sample or population; we could not trace any of them to a primary study.
IVRIS working range: Expect ABM accounts to move faster than your own non-ABM baseline, and treat the gap as the measurement. We don’t publish a target percentage because velocity is denominated in your deal size and cycle length, which makes cross-company comparison meaningless. If ABM deals move slower, you may be targeting accounts too large for your current motion, and the enterprise sales funnel these accounts move through adds committee, procurement and security stages a standard pipeline never models. Keep the two populations separate when you report velocity off the back of it, because a mix shift can lift a blended figure while both segments get worse, and an ABM programme that shifts volume toward the faster-converting segment will produce exactly that pattern.
Influenced Pipeline
This captures the total value of pipeline where ABM touchpoints played a role, even where marketing didn’t create the opportunity. It’s a more honest measure than marketing-sourced pipeline alone, because ABM often warms accounts sales was already working.
Sum of pipeline value for all opportunities where target account contacts engaged with ABM campaigns before or during the sales cycle.How to track it: Use multi-touch attribution in your CRM. Adobe Marketo Measure, HubSpot’s attribution reporting, or CaliberMind can connect marketing touches to pipeline at the account level.
What the evidence says: Influenced-pipeline multiples circulate widely and none we checked carried a source. Treat any published “influenced revenue is 3–5× sourced revenue” figure as unverified.
Revenue metrics: is ABM generating closed revenue?
Revenue metrics are where ABM programs live or die. Leadership cares about engagement scores for exactly one meeting.
ABM Win Rate
Win rate for ABM-targeted accounts against your overall win rate. This is the clearest single indicator of whether the program works.
ABM Win Rate = (Closed-won ABM opportunities ÷ Total ABM opportunities) × 100What the evidence says: Demandbase reports that organisations aligning around buying groups achieve up to 2–3× higher win rates than lead-centric teams, measured across 1,452 instances of its own platform over roughly one year. That is the best-evidenced win-rate figure available, and it describes one vendor’s customer base. The widely quoted “86% of marketers say ABM improves win rates” is a 2019 vendor-distributed claim with no published sample, and we previously repeated it here.
IVRIS working range: We no longer publish a target uplift percentage. The earlier “15–30% higher” figure had no source, and a single percentage would in any case conflate relative lift with percentage points. Measure ABM win rate against your own non-ABM win rate over the same period and let the delta stand on its own.
Average Deal Size (ABM vs. Non-ABM)
ABM should produce larger deals because you’re targeting high-value accounts and engaging the full committee. Measure average contract value for ABM accounts against non-ABM accounts.
What the evidence says: The often-cited 171% lift in average annual contract value comes from TOPO’s ABM: State Of The Market, commissioned by the ABM Leadership Alliance and based on phone interviews with 50 marketing executives around 2017. Quote it with those conditions or leave it out.
IVRIS working range: Expect a lift, and size it from your own data. We don’t publish a percentage because deal-size lift is mostly a function of which accounts you put on the list, which makes it a selection effect as much as a program effect.
Target Account Revenue
Total revenue from your target account list over a period. Simple and powerful.
Sum of all closed-won revenue from accounts on your target account listTrack monthly and quarterly, and trend it. When this grows faster than overall revenue, ABM is pulling its weight. This one needs no benchmark, which is part of why it’s the most reliable number on the list.
ABM ROI
How much revenue ABM generated relative to what you spent on it.
ABM ROI = ((Revenue from ABM accounts - Total ABM program cost) ÷ Total ABM program cost) × 100What to include in program cost: platform fees, ad spend on account-targeted campaigns, content creation for personalised assets, headcount allocated to ABM, and sales time spent on ABM-specific outreach.
What the evidence says: The two circulating ROI figures are weaker than they look. Forrester found 23% of respondents reporting ABM ROI 51–200% higher than traditional marketing, with most reporting 21–50% higher, which is a relative lift rather than an absolute return. The 137% figure is the mean of 771 panel respondents’ own estimates. Neither was audited.
IVRIS working range: Judge the program against your own cost base and give it 6–12 months before reading the number at all. The reasoning is that ABM program cost lands immediately while revenue lands a sales cycle later, so an early ROI calculation measures the accounting lag more than the program.
Retention metrics: are ABM customers growing?
ABM doesn’t stop at closed-won. The best programs keep engaging customers post-sale to drive expansion, cut churn and grow lifetime value, which matters most for subscription businesses. Treating that post-sale stretch as one continuous program rather than a separate CS motion is what extends account-based marketing into a full-lifecycle experience.
For SaaS accounts, pair expansion metrics with SaaS churn rate so ABM quality is judged against retention, not only deal size.
Net Revenue Retention (NRR) for ABM Accounts
NRR measures how much revenue you retain from existing ABM accounts after churn, downgrades and expansion. Above 100% means those accounts are growing even after some churn.
NRR = ((Beginning revenue + Expansion - Churn - Contraction) ÷ Beginning revenue) × 100What the evidence says: NRR benchmarks exist for B2B SaaS generally, but no study we could trace reports NRR segmented by whether an account was ABM-targeted. The ABM-specific figure does not exist in public research.
IVRIS working range: Hold ABM accounts at or above your own company NRR average. The reasoning is straightforward: these were selected as your highest-value, best-fit accounts, so they should not be retaining worse than the accounts you didn’t select. That comparison is internal and needs no industry benchmark.
Customer Lifetime Value (CLV) for ABM Accounts
CLV predicts total revenue from an account over the relationship. ABM accounts should show higher CLV because they were selected for fit and value potential.
What the evidence says: No independent benchmark for ABM-segmented CLV exists. Figures in circulation are vendor-reported and unsourced.
IVRIS working range: Expect ABM accounts above your blended CLV, and treat a gap as a selection problem before a marketing one. If your best-fit accounts aren’t worth more over time, the target list criteria are the thing to examine.
How to measure ABM: building your dashboard
You don’t need every metric from day one. Add them as the program produces the data they depend on.
| Stage | Metrics to add | Question you can finally answer | Why not earlier |
|---|---|---|---|
| Month 1–3, launch | Account Engagement Score, Account Coverage, target list health | Are the right accounts responding at all? | No pipeline exists yet, so engagement is the only real signal |
| Month 3–6 | Account Penetration Rate, Influenced Pipeline, Pipeline Velocity vs non-ABM | Is engagement converting into opportunities? | Needs enough opportunities created for a rate to mean anything |
| Month 6–12 | ABM Win Rate vs overall, Average Deal Size comparison, ABM ROI, NRR | Is the program paying for itself? | Requires at least one full sales cycle of closed deals |
Build the dashboard in whatever tool your team already uses. Running HubSpot, use their ABM reporting. On Salesforce, use reports filtered to the target account list. The data doesn’t need a specialised ABM platform. It needs to be account-level rather than lead-level.
Common ABM measurement mistakes
Quoting a vendor benchmark without its population and date. This is the mistake this page itself made for four months. If you cite a figure in a board deck, carry the sponsor, the sample and the year with it, or expect to be asked and have no answer.
Measuring individual leads instead of accounts. If your ABM dashboard shows MQL count, that’s a demand gen dashboard. ABM success is measured by how many contacts within an account are engaging, not how many leads you captured.
Not comparing ABM against non-ABM. ABM metrics only mean something in contrast. A 25% win rate sounds good until you notice your overall win rate is also 25%. The internal delta is the one comparison no published benchmark can invalidate.
Expecting revenue impact too early. If your sales cycle is six months, don’t expect closed-won revenue in month three. Start with engagement, graduate to pipeline, let revenue follow the cycle.
Tracking too many metrics. Pick 6–8 across the four stages. More creates dashboard clutter nobody reads. Drill deeper when something looks off.
Ignoring post-sale metrics. Acquiring an account is expensive; expanding it is where ABM ROI compounds. Skip NRR and expansion and you’re measuring half the value.
IMPORTANT
Start measuring at the account level from day one. If your dashboard still shows individual MQL counts, you’re running a demand gen report, not an ABM report. Filter everything by your target account list before drawing conclusions.
Sources and how to cite this page
The full evidence ledger is public. It carries one record per circulating claim with the exact wording, the sponsoring organisation and its commercial interest, publication and fieldwork dates, sample, population, statistic type, transparency score, recommended safe wording and a compatibility note, plus the provenance chains for the claims that changed in transmission.
Original organisations retain ownership of their studies. IVRIS did not conduct any of the underlying research. What we contribute is the provenance tracing, the classification, the transparency scoring and the safe-wording guidance. When you quote a figure, cite the original source. When you quote the provenance finding or the comparison, cite this page. The same conventions are used on our B2B buying group statistics ledger, which traces a related claim set.
Suggested citation: IVRIS, Account-Based Marketing Metrics and Benchmarks: claim provenance ledger, version 2.0, verified 6 August 2026, https://ivristech.com/account-based-marketing-metrics/
Version 2.0 — evidence verified 6 August 2026. Every source above was checked against its original document on that date. We review this page quarterly, and immediately when a new annual study publishes from Forrester, Demandbase, Foundry, 6sense or MomentumABM, when an original source releases a sample size or methodology that was previously unavailable, or when a primary URL breaks or moves behind a paywall.
Revision history. v2.0 (6 August 2026): traced all four benchmark claims published in v1.0 to their primary sources; corrected the “86%” attribution from HubSpot to a TOPO ebook distributed by Terminus; corrected the 171% attribution from ITSMA to TOPO and added its n of 50 phone interviews; corrected the Forrester ROI claim from an absolute 200%+ to a relative 51–200% lift reported by 23% of respondents; withdrew the “15–30% higher win rate” claim as untraceable; replaced three dead citation URLs; added the claim-provenance ledger, transparency scorecard and safe-wording table. v1.0 (26 March 2026): first publication.
Frequently Asked Questions
There is no independently verified set. Published ABM benchmarks come from vendor-sponsored practitioner surveys, small interview studies, or one platform’s customer data. Samples range from 50 phone interviews to 1,452 software instances, and most figures state no sample at all. Use them as directional context and measure lift against your own non-ABM accounts.
Treat them as directional. Most are self-reported by marketers describing programs they chose, funded by companies selling ABM software, and drawn from samples that exclude failed programs. Several widely quoted figures are more than five years old or trace to research firms that no longer exist. Always check sponsor, sample size and fieldwork year.
Measure at the account level across four stages: engagement (are target accounts interacting?), pipeline (are they becoming opportunities?), revenue (are opportunities closing?), and retention (are customers expanding?). Always compare ABM account performance against non-ABM accounts over the same period to isolate the program’s incremental impact.
Five carry most of the weight: Account Engagement Score (leading indicator), Account Penetration Rate (pipeline creation), Pipeline Velocity (deal speed), Win Rate against your non-ABM baseline (conversion), and ABM ROI (financial return). Together they tell a complete story from first engagement through closed revenue.
Reputation (awareness and perception among target accounts), Relationships (depth of engagement across committee members), and Revenue (pipeline, closed deals, returns). The framework originated with ITSMA, now MomentumABM, and gives executives a simple way to group ABM metrics without pretending the underlying benchmarks are standardised.
ABM strategies include one-to-one (highly personalised campaigns for a few strategic accounts), one-to-few (personalised campaigns for clusters of similar accounts), and one-to-many (programmatic campaigns across a broader list). Each tier needs different metrics. For how ABM fits a wider plan, see our guide to B2B marketing campaign strategies.
Start tracking what matters
Pull up your CRM and filter pipeline by your target account list. Answer two questions. What’s the win rate for ABM accounts against everything else? What’s the average deal size for ABM accounts against non-ABM? If ABM accounts win more often with larger deals, you have your ROI story, and it’s yours rather than a vendor’s. If they don’t, you’ve found the exact problem to fix first.
Notice that neither question needs a published benchmark. That’s the point. ABM metrics live inside a broader revenue-operations measurement system, the same data definitions and account-level rollups that RevOps best practices covers from the org-design side. Teams that treat ABM measurement as a standalone exercise re-derive answers RevOps already has documented, and then reach for someone else’s numbers to fill the gap.