Shopify Q2 2026 earnings delivered $3.583 billion in revenue, up 34% year over year, while gross merchandise volume reached $115.567 billion, up 32%. The results cover the quarter ended June 30, 2026.
Gross profit rose 31% to $1.708 billion, operating income increased 68% to $488 million, and free cash flow reached $654 million, equal to an 18% margin. Shopify also guided third-quarter revenue growth to the low-thirties percentage range.
Our read: the useful operator signal is not the share-price reaction. It is that B2B GMV grew 76% and AI-driven traffic and orders both tripled. Those figures show faster adoption in two strategic channels, but they do not prove that Shopify fits every merchant or disclose the economics behind the growth.
Direct answer — What do Shopify’s Q2 2026 results mean for ecommerce teams?
Shopify reported 34% revenue growth and $115.6 billion in GMV, with an 18% free cash flow margin. For operators, the standout signals are 76% B2B GMV growth and tripled AI-driven traffic and orders. They show channel momentum, not automatic platform fit: Shopify did not disclose B2B GMV dollars or merchant-level return on investment.
Key Takeaways
- Shopify revenue rose 34% to $3.583 billion in Q2 2026.
- Total GMV increased 32% to $115.567 billion; that figure is not B2B GMV.
- B2B GMV grew 76%, but Shopify did not disclose its absolute dollar value.
- AI-driven traffic and orders both tripled, although agentic-commerce volume remained small relative to total GMV.
- Shopify expects Q3 revenue to grow at a low-thirties percentage rate.
What Shopify Reported in Q2 2026
The quarter was broad-based rather than dependent on one revenue line. Merchant Solutions revenue rose 37% to $2.781 billion, while Subscription Solutions revenue increased 22% to $802 million. Shopify Payments penetration reached 68% of global GMV, up three percentage points year over year, and Shop Pay GMV grew 53%.
The profitability improvement matters because transaction-led growth can pressure gross margin as payments become a larger part of the mix. Shopify still expanded operating income and free cash flow while funding AI products. Its official Q2 financial release shows free cash flow margin rising from 16% to 18% year over year.
For Q3, Shopify expects revenue growth in the low thirties, gross profit growth in the mid-to-high twenties, operating expenses at 33% to 34% of revenue, and free cash flow margin in the high teens to low twenties. That guidance is a company forecast, not a guaranteed outcome.
Why the 76% B2B GMV Growth Matters
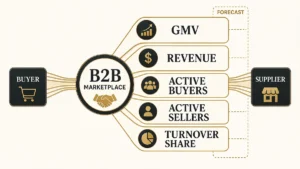
On the Q2 earnings call transcript, Shopify said B2B GMV grew 76% and that it had expanded native B2B capabilities beyond Plus for the first time. The strategic direction is clear: Shopify wants more merchants to run wholesale and direct-to-consumer operations from the same administration layer.
The hidden catch is the denominator. Shopify disclosed the B2B growth rate, not the dollar value of B2B GMV. The $115.567 billion headline is total platform GMV and should not be presented as B2B volume. A fast growth rate can still come from a much smaller base.
For platform buyers, this is evidence of adoption rather than a selection verdict. Contract pricing, account hierarchies, approvals, punchout, ERP integration, and implementation capacity still decide whether Shopify Plus fits. A use-case comparison of B2B ecommerce platforms adds that decision context to the earnings signal.
AI Traffic Tripled, but the Base Is Still Small
Shopify said AI-driven traffic and orders both tripled year over year. New-buyer orders from AI channels arrived at nearly twice the rate of other channels, while daily active merchants using Sidekick increased 3.6 times. Reuters also reported that Shopify described AI as a growth driver rather than only a competitive threat.
Shopify supplied an equally important caveat: agentic-commerce volume remains small relative to its total GMV. In our earlier reporting on IDC’s agentic commerce 2030 forecast, we argued that current evidence supports a discovery-and-infrastructure shift more strongly than a claim of widespread autonomous purchasing. Shopify’s quarter fits that narrower interpretation.
What Ecommerce Teams Should Do Now
Separate platform momentum from merchant economics. Compare Shopify’s growth with your own B2B digital-adoption rate, repeat-order share, cost to serve, payment mix, and contribution margin. Platform GMV cannot tell you whether an individual implementation is profitable.
Audit the operating requirements before treating growth as a migration case. Test account-specific catalogs, negotiated pricing, approval routing, ERP synchronization, returns, and tax logic with real data. The most useful B2B ecommerce operating practices remain the same regardless of which vendor posted the strongest quarter.
Measure AI as a channel, not a slogan. Track AI-attributed sessions, new-buyer rate, conversion, assisted revenue, feed accuracy, and price or inventory mismatches. Tripling from a small base is worth monitoring, but it needs absolute volumes and merchant-level outcomes before budgets move.
Frequently Asked Questions
Shopify reported Q2 2026 revenue of $3.583 billion, up 34% from $2.680 billion a year earlier. Merchant Solutions contributed $2.781 billion and Subscription Solutions contributed $802 million. The company said revenue growth for the quarter was 33% when measured in constant currency.
Shopify’s total gross merchandise volume reached $115.567 billion in Q2 2026, up 32% year over year. GMV measures the value of orders facilitated through the platform, net of refunds and including items such as shipping, duties, and value-added taxes. It is not the same as Shopify revenue.
Shopify said B2B GMV grew 76% year over year in Q2 2026. The company did not disclose the absolute dollar value of B2B GMV, so the 76% rate should not be applied to the $115.567 billion total. It is an adoption signal, not a complete measure of B2B scale.
Shopify expects Q3 2026 revenue to grow at a low-thirties percentage rate year over year. It forecasts gross profit dollar growth in the mid-to-high twenties, operating expenses equal to 33% to 34% of revenue, and free cash flow margin in the high-teens to low-twenties range.