Every business has processes that grind. The invoice that sits in approval for two weeks, the new-hire onboarding that takes 40 person-hours across three teams, the customer handoff that drops one in five accounts. Business process improvement is the discipline of fixing those processes systematically rather than hoping they’ll improve on their own.
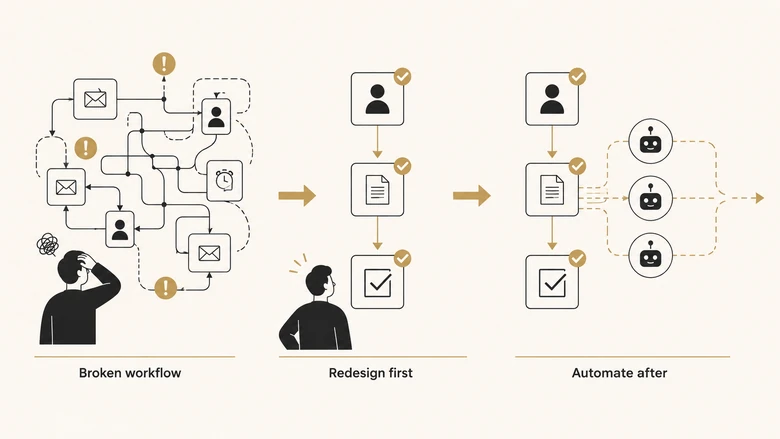
In 2026 the discipline has a new wrinkle: AI agents and hyperautomation can now do the work that a process consultant used to recommend on a whiteboard. That’s an opportunity and a trap at the same time. The opportunity is real cost reduction — the same shift our AI agents in RevOps piece tracks across demand-gen and operations workflows. The trap, as McKinsey keeps warning, is that bolting AI onto a broken workflow makes the workflow run faster while still being broken.
This guide walks through what BPI actually is in 2026, the methodologies that still matter, a prioritization framework for picking which process to improve first, and the honest failure modes most guides skip. It’s written for mid-market B2B operators who have to ship this work inside a quarter, not enterprise consultants with 18-month engagements.
Key Takeaways
- Business process improvement (BPI) is the systematic analysis, redesign, and optimization of workflows to reduce cost, improve quality, and increase speed. In 2026 it almost always includes an AI or automation layer.
- Six methodologies dominate: Lean, Six Sigma, Kaizen, TQM, Theory of Constraints, and PDCA. Pick based on whether your bottleneck is waste, variability, culture, quality, throughput, or ongoing iteration.
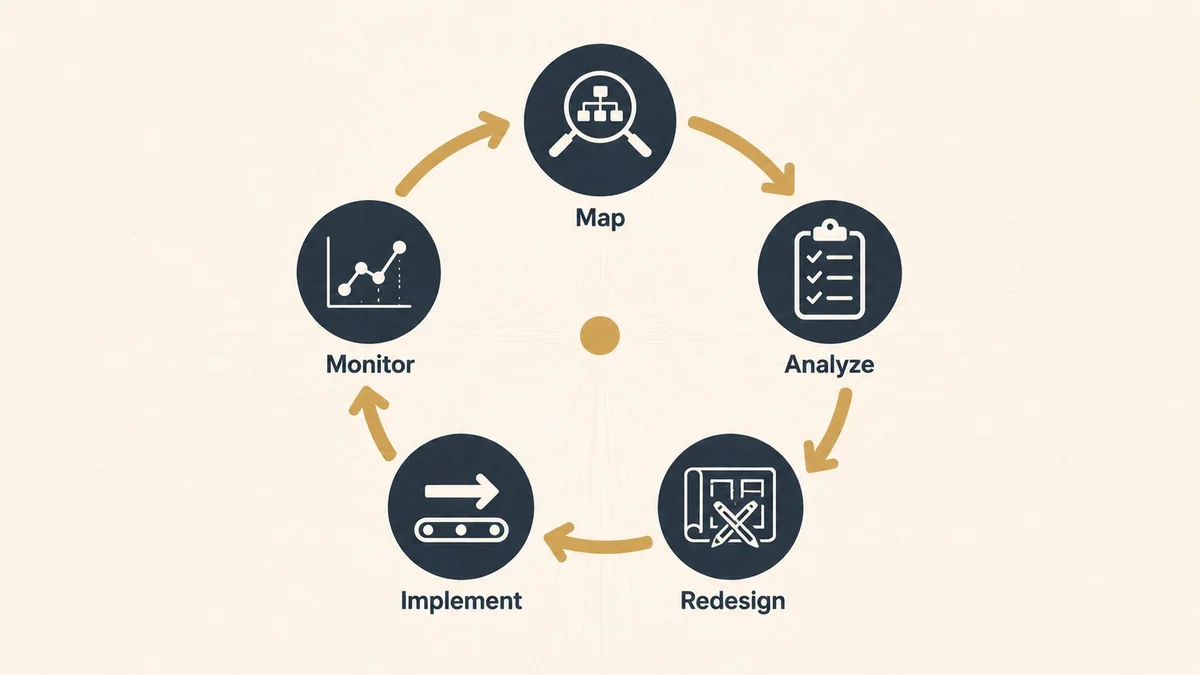
- The five-step BPI cycle is Map, Analyze, Redesign, Implement, Monitor. Every successful project runs through this loop at least twice.
- Prioritize processes using an Impact vs Effort matrix. Most mid-market teams should pick one high-impact/low-effort process per quarter, not five at once.
- BPI projects most commonly fail from three causes: redesigning the tool without redesigning the workflow, insufficient employee buy-in, and treating BPI as a one-time project instead of a continuous function.
- AI and hyperautomation change the economics of BPI in 2026, but only when applied after the workflow has been redesigned. Automating a broken process just makes it broken faster.
What Is Business Process Improvement?
Business process improvement is a systematic approach to analyzing, redesigning, and optimizing business workflows to improve efficiency, reduce costs, improve quality, and better align operations with business goals. BPI is continuous by design: once a process is improved, the cycle starts again with the next bottleneck.
BPI sits under the broader umbrella of Business Process Management (BPM), which is the permanent organizational function of managing all processes end-to-end. BPI is project-based and targeted at specific workflows; BPM is the ongoing system that governs them. Most mid-market companies do BPI without ever formalizing a full BPM function, and that’s fine.
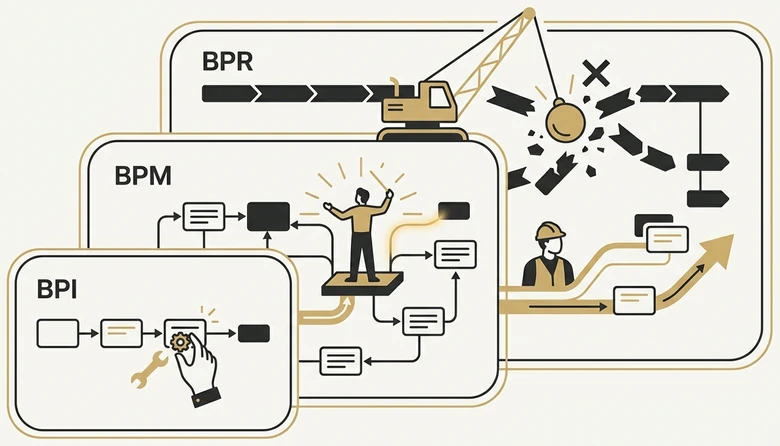
BPI vs BPM vs Business Process Reengineering
Three terms get used interchangeably in practice, but they describe different levels of change:
- BPI (Business Process Improvement): incremental improvement to existing processes. Fix what’s broken, tune what’s slow, eliminate what’s wasteful. Works inside the current process architecture.
- BPM (Business Process Management): the ongoing discipline of designing, modeling, and monitoring all processes as a system. Includes BPI but extends to governance, compliance, and cross-process orchestration.
- BPR (Business Process Reengineering): radical redesign. Throw the current process out, rebuild from scratch against first principles. BPR is what you do when incremental improvement can’t deliver the step-change the business needs.
Most mid-market teams need BPI, not BPR. Reengineering is expensive, risky, and disruptive, and the returns only justify the cost when the existing process is fundamentally misaligned with the business model.
The 5-Step Business Process Improvement Cycle
Every BPI methodology shares a common five-step cycle, sometimes expanded to six or seven depending on the framework. The fundamentals don’t change: you can’t improve what you haven’t mapped, and you can’t know if the change worked without monitoring. The steps below are a synthesis that works across Lean, Six Sigma, and Kaizen projects.

Step 1: Map the Current Process
Document how the process actually runs today, not how the SOP says it should. Shadow the people doing the work, capture every handoff, note every manual step, and mark every place where work waits. Tools like Lucidchart, Miro, and SAP Signavio make this visual. The output is a process map with every step, decision point, and actor labeled.
This step takes longer than teams expect. Most processes in mid-market companies have two to three times as many steps in practice as they do in documentation, because workarounds have accumulated over years.
Step 2: Analyze for Bottlenecks and Waste
With the map in hand, find where the process breaks. Look for rework loops (work going backward), wait states (work sitting idle), handoffs across teams (where things drop), manual data entry (where errors enter), and redundant approvals (where authority is unclear). Every bottleneck gets a quantified cost: hours wasted, errors produced, or revenue delayed.
Step 3: Redesign the Process
Design the new process before you build it. The redesign should eliminate the waste identified in step 2, not just automate around it. This is the step where the McKinsey warning matters most: if you automate step 3 onto a process that still has six unnecessary handoffs, you’ve just made the broken process faster.
Step 4: Implement
Roll out the new process to a pilot group first — a single team, a subset of accounts, a specific region. Measure against baseline for 30 to 60 days. Fix the issues the pilot surfaces, then expand. Don’t big-bang implement across the whole organization on day one.
Step 5: Monitor and Iterate
Track the new process’s performance against the baseline you captured in step 2. If the numbers don’t move, the redesign missed the real problem and you loop back to step 2. If they move, you harvest the gains and pick the next process. Good BPI teams revisit every improved process quarterly for the first year.
PRO TIP
Most mid-market teams under-invest in step 1 and over-invest in step 4. They map a process in two days and then spend three months implementing a redesign that solves a problem the map didn’t actually surface. Spend 3x the time mapping than you think you need. The redesign gets obvious once the map is complete.
The 6 Core BPI Methodologies
Six methodologies dominate the BPI space, each designed for a different root cause of process failure. The right methodology depends on what’s actually broken, not on what’s fashionable. Pick one, not five — running Lean and Six Sigma and Kaizen in parallel produces governance overhead, not improvement.

1. Lean Manufacturing
Originated at Toyota. Focused on eliminating waste across eight categories: defects, overproduction, waiting, non-utilized talent, transportation, inventory, motion, and extra processing. Best used when the process has obvious inefficiency and nobody owns it. Value stream mapping is Lean’s signature tool.
2. Six Sigma
Data-driven methodology focused on reducing variability and defects. Uses the DMAIC cycle (Define, Measure, Analyze, Improve, Control) and statistical analysis to take processes to 3.4 defects per million opportunities. Best used when quality is quantifiable and variability is the problem (manufacturing, transaction processing, billing accuracy).
3. Kaizen
Japanese for “continuous improvement.” Not a single framework but a culture: small, daily improvements from everyone, not just specialists. Best used when the process problem is organizational apathy rather than technical, like when employees have identified issues for years but nobody acts on them.
4. Total Quality Management (TQM)
Customer-centered approach focused on quality as an organization-wide priority. Emphasizes customer satisfaction, employee involvement, and continuous measurement. Best used in service delivery and customer-facing processes where quality is a brand differentiator.
5. Theory of Constraints
Identifies the single bottleneck limiting system throughput, then eliminates it. Moves to the next bottleneck when the first is gone. Best used when the process is a sequential chain and one step is clearly slower than the others (classic example: production lines, but also sales pipeline funnels).
6. Plan-Do-Check-Act (PDCA)
A meta-methodology for running any improvement cycle: plan the change, do it on a small scale, check the results, act on what you learned. Best used as the operational wrapper around any of the five above. PDCA is less a methodology and more a discipline.
How to Prioritize Which Process to Improve First
Most mid-market teams have 20 broken processes and the capacity to fix two per quarter. The failure mode is picking the wrong two. Prioritize using an Impact vs Effort matrix: impact measured in dollars saved or revenue added per year, effort measured in person-weeks to redesign and implement.

Quick Wins (High Impact, Low Effort)
Pick these first. Automate invoice approval routing. Eliminate a redundant QA step. Consolidate two handoffs into one. Usually these are processes where the fix has been obvious to the team for months but nobody had authority to implement it. These deliver visible wins that build political capital for the harder projects.
Big Bets (High Impact, High Effort)
The second priority, but only one at a time. These are the deep-cycle processes: order-to-cash, procure-to-pay, customer onboarding. They take a quarter or two to redesign and implement but pay for themselves many times over. Assign a full-time owner.
Fill-Ins (Low Impact, Low Effort)
Run these when you have spare capacity. They’re morale boosters more than material wins. Things like automating a weekly status report or cleaning up a shared folder structure. Useful for keeping an improvement rhythm going, not for driving business results.
Money Pits (Low Impact, High Effort)
Skip these entirely, or redesign them out of existence. A process that costs 40 hours to fix and saves 10 hours per year is a money pit even if the pain is real. Sometimes the right answer is to eliminate the process altogether, not improve it.
BPI Priority Score = (Annual Cost of Current Process − Annual Cost of Improved Process) ÷ Implementation Effort (person-weeks)How AI and Automation Change BPI in 2026
In 2026, business process improvement almost always includes an AI or automation layer — the same operational shift our business process automation services overview maps end-to-end. The economics have shifted enough that processes which couldn’t justify automation two years ago now can. According to Gartner, 40% of enterprise applications will include task-specific AI agents by the end of 2026, up from roughly 4% in 2024.
The productivity gains are real but conditional. A March 2026 McKinsey analysis of US productivity showed that administrative task automation delivers material productivity gains only when the underlying workflow is redesigned at the same time. Bolting AI onto an unchanged workflow adds another layer to the process and often makes it slower, not faster.
Where AI Adds Clear Value in BPI
- Process mining: tools like Celonis and UiPath Process Mining automatically discover how work actually flows (the step 1 map), eliminating the manual shadowing work
- Document processing: invoice extraction, contract review, form filling. High-volume, high-accuracy workflows where AI now matches or exceeds human performance
- Classification and routing: customer tickets, lead scoring, exception handling. Places where rules used to be coded and now are learned
- Summarization: meeting notes, long email threads, multi-page PDFs compressed into actionable briefs
Where AI Currently Underperforms
- Processes that require cross-system judgment under ambiguity (most exception handling)
- Decisions with high-stakes legal or compliance consequences (AI errors here are expensive)
- Relationship-driven workflows (customer escalation, complex negotiation)
- Anything where the training data is thin or biased in ways the team hasn’t caught
IMPORTANT
Gartner’s own research shows 90% of large enterprises are running hyperautomation initiatives, but less than 20% have mastered the measurement of those initiatives. Translation: most teams are automating without knowing whether it’s working. Build measurement into the BPI cycle before you add an AI layer.
Common Business Process Improvement Examples
The processes that most mid-market teams tackle first tend to cluster into a handful of categories. Each of these has well-understood pain points and well-understood solutions, which is why they’re usually the best places to start:
Order-to-Cash
The full cycle from customer order through invoicing to cash collection. Classic BPI targets: reducing order entry errors (automated data capture), shortening approval cycles (rules-based routing), eliminating billing disputes (upstream data quality), accelerating cash application (AI-powered reconciliation). Typical gains: 30–40% reduction in days sales outstanding.
Procure-to-Pay
From purchase request through vendor payment. Improvements typically target requisition approval speed, PO matching accuracy, and payment scheduling. Heavy candidate for automation in 2026 — tools like Ramp, Brex, and NetSuite now handle large parts of this cycle automatically.
Employee Onboarding
New hire setup usually crosses HR, IT, facilities, and the hiring manager’s team. Improvements target the handoffs: a single checklist that triggers parallel workflows across teams, a centralized dashboard, automated account provisioning. Time-to-productivity is the metric.
Customer Support Ticket Routing
From inbound ticket to resolution. AI classification and routing is the common 2026 upgrade. According to industry research, contact centers using AI report a 30% reduction in operational costs, with 43% of centers having already adopted AI technologies.
Sales Pipeline Management
From lead capture through closed-won. BPI targets: shortening lead response time, improving qualification accuracy, eliminating data re-entry between tools. Lead response time is the single highest-leverage variable — every minute past five drops conversion by roughly 10%, which the B2B sales funnel walkthrough covers with the underlying cohort data.
Why BPI Projects Fail
Most BPI projects don’t fail on strategy. They fail on three specific traps, and the same three traps show up in nearly every post-mortem.
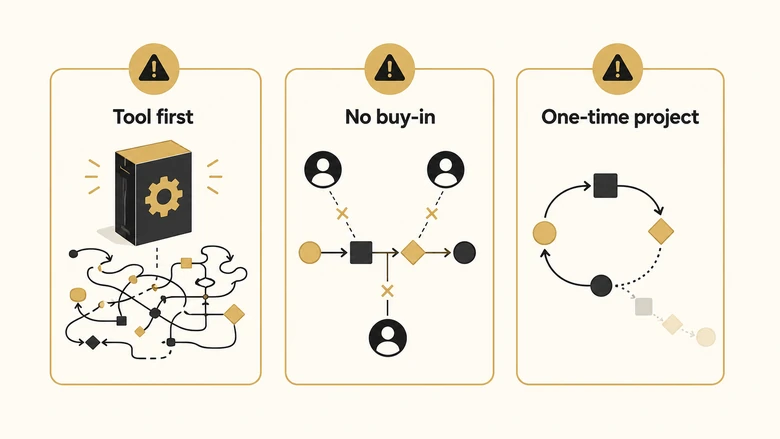
1. Redesigning the Tool Instead of the Workflow
A team decides their CRM is the problem. They migrate to a new CRM. Six months later the same handoffs are broken, the same data lives in the same silos, and the new tool is customized to mirror the old broken process. The tool wasn’t the problem — the workflow was. Most tool migrations should follow a workflow redesign, not substitute for one.
2. Insufficient Employee Buy-In
BPI projects change how people work every day. If the people doing the work weren’t consulted during mapping and redesign, they won’t adopt the new process. They’ll revert to the old workarounds within weeks. According to NetSuite’s research, employee resistance to change is consistently cited as the top obstacle in BPI initiatives, ahead of budget or technology.
The fix: include the people who do the work in steps 1, 2, and 3. Not as interviewees, as co-designers. The best BPI projects feel like they were designed by the team, not imposed on them.
3. Treating BPI as a One-Time Project
A consultant redesigns the process. The team implements it. Six months later everyone is back to doing things the old way because nobody owned the process after the consultant left. BPI is a continuous function, not a project. Every improved process needs a named owner and a monthly check-in for at least six months post-implementation.
Business Process Improvement Tools
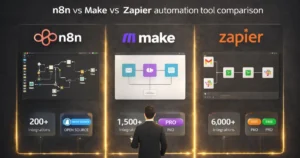
You don’t need a dedicated BPM platform to do BPI well. Most mid-market teams run their first year of BPI using a process mapping tool, a spreadsheet, and whatever automation platform the rest of the org already uses. Only add the heavy BPM platforms when process count scales past roughly 50.
The automation layer for most mid-market BPI projects comes down to n8n, Make, or Zapier — the choice usually hinges on in-house technical depth and whether self-hosting matters. For the process analytics side, Celonis is the mid-market-to-enterprise leader; Signavio is strong if you’re already in the SAP ecosystem.
Frequently Asked Questions
The five steps are: (1) Map the current process to understand how work actually flows, (2) Analyze the map to find bottlenecks and waste, (3) Redesign the process to eliminate the problems identified, (4) Implement the new process starting with a pilot group, and (5) Monitor the results against baseline metrics and iterate. Every successful BPI project runs through this loop at least twice.
A common example is automating invoice approval. The original process requires a manager to manually email each invoice for approval, causing 7-day cycles. The improved process uses automated rules-based routing with digital approvals, reducing cycle time to under 48 hours and eliminating 90% of the manual effort. The before-and-after measurement is what makes it a BPI project, not just a technology upgrade.
The 4 P’s are People, Process, Platform, and Performance. People refers to who executes and owns the process. Process is the sequence of steps and decisions. Platform is the technology that supports the work. Performance is how results are measured. Every BPI project should address all four; fixing only the platform without the people and the process is the most common failure pattern.
BPI (Business Process Improvement) is incremental: optimize the existing process, fix bottlenecks, reduce waste. BPR (Business Process Reengineering) is radical: throw the current process out and rebuild from first principles. BPI is appropriate for most mid-market improvements; BPR is reserved for processes so fundamentally misaligned that incremental fixes won’t move the needle.
A single process improvement project typically runs 8 to 16 weeks end-to-end: 2 to 4 weeks mapping and analysis, 2 to 3 weeks redesign, 4 to 8 weeks pilot implementation, and 2 to 4 weeks of monitoring before full rollout. Complex cross-functional processes can take 6 months or more. Projects that promise to be done in under 4 weeks are usually skipping the mapping step.
Next Steps
BPI works when you pick one high-impact process per quarter, map it honestly, redesign the workflow before adding tools, include the people who do the work in the redesign, and monitor for at least six months after rollout. It fails when teams chase methodologies instead of outcomes, or when they automate broken processes without fixing them first.
If you’re starting your first BPI project, begin with the Impact vs Effort matrix from above. List every process that’s visibly broken, score each on impact and effort, and pick the highest-value quick win as your first project. The goal is to ship one improvement before trying to build a whole BPI function.
The discipline rewards depth on a small number of processes over breadth across many. Pick the one process where the cost of staying broken is highest, work through the five steps with the people who actually do the work, and treat the first project as a template the team will reuse — not a one-off engagement. The teams that compound BPI wins are the ones who finish what they start.