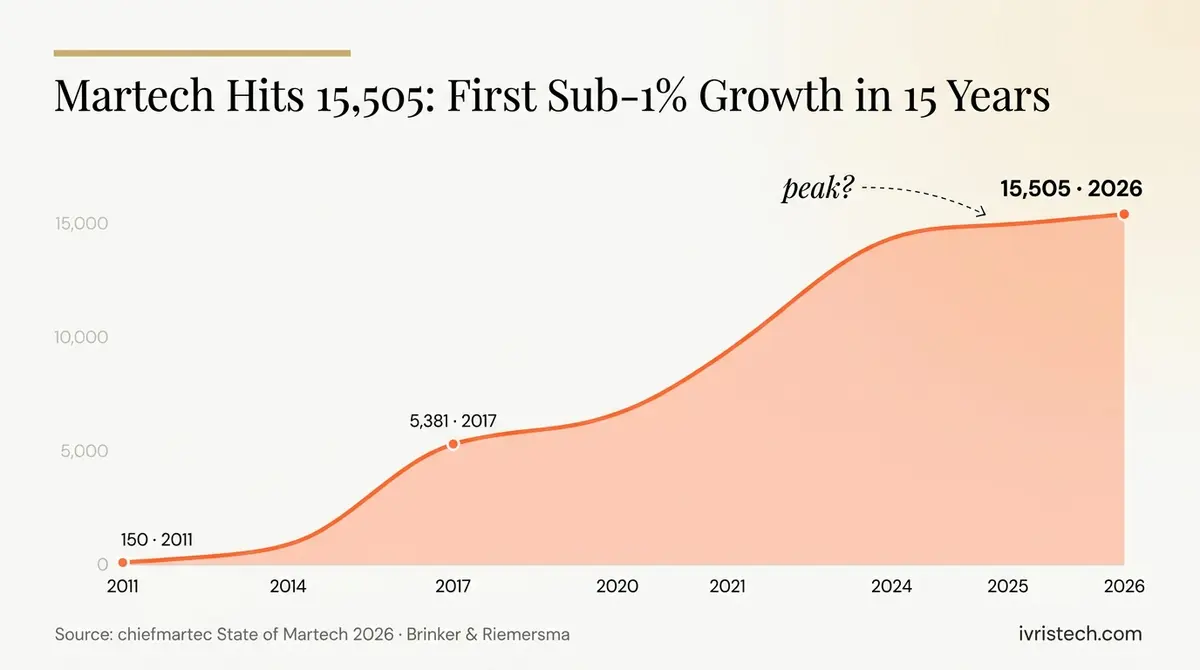
Scott Brinker and Frans Riemersma published the 2026 Marketing Technology Landscape Supergraphic and the State of Martech 2026 report on May 5, debuted at MartechDay. The headline number is 15,505 products, up just 121 from last year’s 15,384, 0.79% growth and the slowest year in the supergraphic’s 15-year history. From 150 products in 2011 to 15,505 in 2026, the landscape has grown 100x. This year, for the first time, it effectively stopped.
The flat headline hides churn. Brinker’s data shows 1,488 products added this year against 1,367 removed, additions down 40% from last year’s 2,489, removals up 13% from last year’s 1,211. The 2010-2019 SaaS wave accounted for 51.7% of this year’s exits, meaning a meaningful slice of the first great martech SaaS generation is now being recycled out. By revenue band, 45.5% of removed products were in the $1M-$10M range. By headcount, 41.2% had 1-10 employees and 38.7% had 11-50. The middle of the market, companies that became real businesses but never became inevitable ones, is where the bonfire is.
For B2B martech buyers, the procurement implication is the part of the report nobody else is reading carefully. A 9.7% gross churn rate on the installed landscape (1,367 exits / 14,138 prior-year base) is the highest the supergraphic has measured. Any stack-level purchase decision made in 2026 is being made into a market with a materially higher vendor-mortality risk than it had in 2022, and the playbook for managing that risk has not caught up.
Key Takeaways
- The 2026 Marketing Technology Landscape reached 15,505 products, up 0.79% from last year’s 15,384, the slowest growth in 15 years per chiefmartec’s May 5 release.
- 1,488 products were added (a 40% decline from 2025’s 2,489) and 1,367 were removed (a 13% increase from 2025’s 1,211), the headline plateau hides a 9.7% gross churn rate.
- 51.7% of this year’s exits came from products founded between 2010 and 2019, meaning the first great SaaS martech generation is being recycled out.
- Fastest-growing categories: CMS & Web Experience Management (+21.4%), Ecommerce Platforms & Carts (+19.9%), Mobile & Web Analytics (+11.3%), Call Analytics (+8.9%), iPaaS/Data Integration (+8.0%), Governance & Privacy (+7.1%), Marketing Automation (+5.9%), old categories reactivated by AI.
- The landscape has grown 100x since 2011 (150 products to 15,505), a 10,236.7% expansion that may have finally hit its plateau.
What the Numbers Actually Say
The headline is the slowdown. From 2011 to 2024, the supergraphic averaged double-digit annual growth. The 2025 release came in at 27%. The 2026 release is at 0.79%. That is not a smooth deceleration, it is a structural inflection. Either martech consolidation has finally arrived or the landscape methodology has caught up to a churn rate that was always present and is now visible because the entry rate slowed.
The composition of exits points to the first reading. The 51.7% of exits coming from 2010-2019 vintages is not random. It is the cohort of products that took Series A and B funding during the cheap-money era, hit ARR thresholds that made them appear durable, and are now being squeezed from three directions at once: incumbents like Salesforce and HubSpot bundling AI features down-market, AI-native startups attacking from below with simpler architectures, and B2B buyers consolidating tools under cost pressure. Brinker’s framing, “incumbents are bundling AI features from above, AI-native startups are attacking from below, and buyers are rationalizing what they already have, the middle gets squeezed”, is precise. The middle of the market is the bonfire.
The exit-by-size cuts tell the same story from the company side. 45.5% of removed products had $1M-$10M revenue. 41.2% had 1-10 employees and 38.7% had 11-50. These were not zombies. These were real companies with real customers, run by real teams. They found enough traction to become operating businesses. They did not find enough escape velocity to become inevitable ones, and in a market where the cost of compute and acquisition both rose against a flat marketing-budget environment, the middle didn’t make it.
Where the Growth Actually Is
Inside the flat headline, seven categories grew at meaningful rates. Each of them tells the same story about what’s actually happening to the martech stack under AI pressure.
CMS & Web Experience Management grew 21.4%, from 504 to 612 products. Ecommerce Platforms & Carts grew 19.9%, from 547 to 656. Brinker’s reading is that websites built for two audiences (humans and search crawlers) now need to serve a third: AI agents acting on behalf of humans. AI search assistants, agentic browsers, shopping agents, and procurement agents don’t browse, they extract, compare, summarize, and act. CMS and ecommerce platforms are rebuilding their entire value proposition around being machine-readable and agent-actionable, and the proliferation in those categories reflects how unsettled the architecture still is.
Mobile & Web Analytics grew 11.3% and Call Analytics grew 8.9%. As more customer journeys disappear into AI-mediated interactions, marketers are trying to instrument the parts of the journey they can still see. This is a defensive build, analytics tooling is growing because measurement coverage is shrinking elsewhere, not because the discipline got more sophisticated. eClerx’s martech activation-gap report shows why instrumentation alone does not settle the ROI question: 78% of leaders still say their stacks miss business goals because insight generation is running ahead of execution.
iPaaS and data integration grew 8.0%; governance, compliance and privacy grew 7.1%. When agents can act across systems, the connective tissue and the rules governing it matter more. This is the boring-but-important growth, middleware and guardrails, and it is exactly where Gartner’s CMO Spend Survey says the mature 30% AI-ready cohort is investing ahead of tool purchases. Twilio’s May 7 GA of its agentic conversation layer is the same connective-tissue investment made one layer up, holding conversation state across channels so the agents above it can act without losing context at the channel boundary.
Marketing automation and campaign/lead management grew 5.9%. The category every analyst has been declaring mature since 2016 is back on the growth chart because AI is changing what orchestration means. The orchestration layer is being rewritten around agents that compose campaigns dynamically, and the incumbents and challengers are both rebuilding for it. HubSpot’s Breeze move to outcome-based pricing and Adobe’s repricing of AJO B2B Prime for mid-market are both visible inside this category’s growth number. Hightouch’s $150M Series D for agentic marketing on April 27 is the same orchestration-layer fight from the challenger side, with Goldman Sachs and Bain Capital backing the bet that the new orchestration tier is owned by an agentic-first vendor rather than an incumbent suite. The supply side has a ceiling, though: SaaStr’s May 28 report card grading 144 B2B APIs on agent-readiness found marketing automation scoring near the bottom, with Marketo at 50, so the agents composing those campaigns are only as capable as the APIs underneath them.
The Procurement Reality Nobody Is Pricing Yet
The recap pieces published over the past week have all asked the same question: is this peak martech? It is the wrong question for buyers. The right question is what 9.7% gross churn means for the next purchase decision. Three things matter.
First, the survival check has to enter the procurement process. A vendor evaluation in 2024 could reasonably skip a five-year survival assessment because the base rate of vendor mortality was lower. In a market where one in ten products on the supergraphic exits each year, the five-year survival probability of any specific vendor at the median is materially lower than buyers are pricing. Procurement criteria need to add: years to default profitability, customer count by tier, dependency on a single funding source, and product position relative to the squeeze (where is this vendor relative to incumbent bundling from above and AI-native disruption from below). Publicis-LiveRamp showing one survival outcome under that base rate reframes the procurement question: the survival check now needs an acquisition-pathway column too, because the asset that survives via holdco acquisition continues operating but with a materially different governance posture than the pre-acquisition platform did.
Second, the Content Marketing outflow is the canary. The 2026 supergraphic’s largest single-category contraction was Content Marketing, with 176 products removed. Brinker doesn’t break down which specific products exited, but the pattern is consistent across his commentary: generic-AI content workflow tools, the ones that wrapped GPT-4 in a content marketing UI in 2023, are the cohort getting squeezed first. Any B2B martech stack still running a 2023-vintage generic AI content tool should audit it against the 2026 alternatives within the next quarter, because a meaningful share of those vendors will be gone before contract renewal. The B2B AI subscription pricing reset we covered earlier is the parallel pressure: even the vendors that survive are repricing in ways that make 2023 contracts look expensive.
Third, the growth categories tell buyers where the next stack dollar should go. If 7 of the 7 fastest-growing subcategories are about machine-readable infrastructure, integration, governance, and the agentic-orchestration rebuild of existing tools, the procurement signal is unambiguous: the budget should rotate from net-new tools to foundations that make existing tools agent-ready. That is the same signal coming out of the major suite comparisons, buyers consolidating onto fewer suites with deeper integration, not adding standalone tools.
Is It Really Peak Martech
Brinker’s own framing is hedged: “We may have finally hit peak martech, or at least a plateau.” Three reasons the hedge is the right call.
Generative AI is producing new categories faster than the supergraphic can index them. The 70 AI use cases the State of Martech 2026 report breaks down are visibly mid-formation; many will collapse into existing categories within a year, some will become standalone categories the next supergraphic has to add. The data architecture supporting agentic marketing is the same, still mid-formation, still introducing categories. The next 12 months will add categories that didn’t exist in May 2026.
The exits are also concentrated in vintages, not in categories. The 51.7% exit share from 2010-2019 vintages says the cohort got squeezed, not that the market hit a hard ceiling. A new cohort of 2024-2026 vintage AI-native martech vendors is currently between Series A and Series B funding, and they will populate the 2027 supergraphic at scale regardless of whether the 2010-2019 cohort continues exiting. The supergraphic could see another expansion cycle before the next plateau arrives.
Our read: this is the first true plateau in the landscape’s history, but it is a transition plateau, not an end state. The next two years will produce churn on the order of 2,000-3,000 products in each direction as the AI architecture settles, with the headline count moving sideways. Buyers who treat the plateau as a sign that martech consolidation has finally arrived will under-procure for the AI rebuild that is still mid-flight. The Feedonomics agentic-catalog work, Microsoft’s AI Max agentic web push, and Zeta’s Athena agent launch are all early innings of a category formation that hasn’t named itself yet. The 2027 supergraphic will likely have one new top-level category, three new subcategories, and a churn rate higher than 2026’s.
What B2B Martech Buyers Should Do This Quarter
Four moves are defensible against the 2026 data:
- Add a five-year survival probability check to every new vendor evaluation. The base rate of vendor mortality is materially higher than the procurement playbook assumes. Years to profitability, customer count, single-source funding risk, and squeeze position should all be standard scorecard items now, not optional ones.
- Audit existing tools in shrinking subcategories first. The 176-product Content Marketing outflow is the loudest signal. Generic-AI content workflow tools bought in 2023 should be audited against current alternatives before contract renewal. The RevOps software pillar covers the same audit logic across adjacent categories.
- Route the next stack dollar toward the foundations layer. Integration (iPaaS), governance, and analytics are growing because they are the connective tissue and guardrails for the AI rebuild. Buying a new top-of-funnel tool without the foundations is the procurement equivalent of buying the eighth marketing-automation seat without fixing the data model.
- Build a tracker of vendor squeeze position by quarter. Brinker’s “squeezed middle” pattern is forecastable at the vendor level. Track each vendor in the existing stack for: incumbent suite encroachment, AI-native disruption presence, customer consolidation pressure. Vendors with all three pressures rising have a measurably higher exit probability. Replanning the stack around that signal before the exit happens is materially cheaper than after.
The 0.79% headline is not the story. The 9.7% gross churn rate is the story, and it changes how the next 18 months of B2B martech procurement should be run. Intuit’s May 20 reduced-investment posture for Mailchimp made the churn pattern concrete at name-brand scale eight days after Brinker’s release, with CEO Goodarzi confirming the company tried to sell Mailchimp and could not find a buyer at an acceptable price in the current software-equity environment. That posture now has its first product datapoint: Analytics AI shipping eight days after Intuit’s cuts shows the platform can still release visible scope, while leaving the longer release-cadence question open.
Frequently Asked Questions
The supergraphic catalogs every marketing technology product Brinker and Riemersma can identify, grouped into categories and subcategories. The 2026 release includes 15,505 products, up from 15,384 in 2025 and from 150 products in the very first 2011 edition. It tracks additions, removals, and net change at the category level, and is published annually at MartechDay alongside the State of Martech report that explains the year’s movements.
Brinker himself uses a hedged “peak martech, or at least a plateau” framing. The plateau is real for 2026, but the AI-driven category formation underway suggests the 2027 and 2028 supergraphics will likely add new categories and subcategories that don’t exist yet. A more accurate read is that this is the first true plateau in the landscape’s 15-year history but a transition plateau, not an end state. The current 0.79% growth headline hides a 9.7% gross churn rate that points to ongoing restructuring rather than market closure.
The fastest-growing subcategories are CMS & Web Experience Management (+21.4%), Ecommerce Platforms & Carts (+19.9%), Mobile & Web Analytics (+11.3%), Call Analytics (+8.9%), iPaaS/Data Integration (+8.0%), Governance & Privacy (+7.1%), and Marketing Automation (+5.9%). The common thread is that these are existing categories being reactivated by AI, websites needing to serve AI agents, analytics needing to instrument AI-mediated journeys, integration and governance becoming load-bearing for agent-based workflows. New categories purely created by AI are still mid-formation.
Four moves: add a five-year survival probability check to every new vendor evaluation, audit existing tools in contracting subcategories like Content Marketing first, route the next stack dollar toward integration and governance foundations rather than another point tool, and track vendor squeeze position quarterly (incumbent encroachment + AI-native disruption + customer consolidation pressure). The 9.7% gross churn rate is the operational signal, vendor mortality is now high enough that procurement playbooks built before 2024 are systematically under-pricing the risk.